Category Trend  Published on 28/07/2023

Wave Segregation Index

An update for this algorithm is currently pending moderation. Please revisit this page shortly to access the algorithm's latest version.
Description

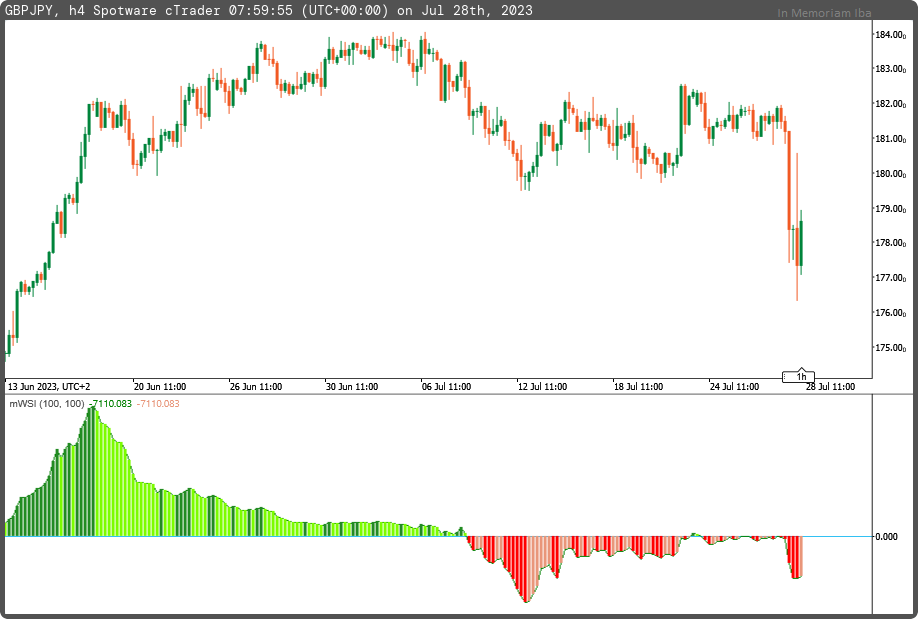
The Wave Segregation Index (WSI) oscillator is based on the ratio of two indicators: DMS (Directional Movement System) and CCI (Commodity Channel Index), both in confluence with Typical Price. 

The result is displayed as a colored histogram, indicating the strength of price wave segregation in four types of conditions. 

This version is the common interpretation, attempting to assess the force and velocity of price.


mfejza's avatar
mfejza

Joined on 25.01.2022

  • Distribution: Free
  • Language: C#
  • Trading platform: cTrader Automate
  • File name: mWSI.algo
  • Rating: 5
  • Installs: 393
Comments
Log in to add a comment.
mfejza's avatar
mfejza · 11 months ago
using System;
using cAlgo.API;
using cAlgo.API.Indicators;
using cAlgo.API.Internals;

namespace cAlgo
{
    [Levels(0)]
    [Indicator(IsOverlay = false, AccessRights = AccessRights.None)]
    public class mWSI : Indicator
    {
        [Parameter("CCI Period (100)", DefaultValue = 100, MinValue = 2)]
        public int inpPeriodCCI { get; set; }
        [Parameter("DMS Period (100)", DefaultValue = 100, MinValue = 2)]
        public int inpPeriodDMS { get; set; }

        [Output("WSI - Wave Segregation Index", PlotType = PlotType.Line, LineColor = "Black", Thickness = 3)]
        public IndicatorDataSeries outWSI { get; set; }
        [Output("Up Bullish", PlotType = PlotType.Histogram, LineColor = "ForestGreen", Thickness = 3)]
        public IndicatorDataSeries outStrongBullish { get; set; }
        [Output("Down Bullish", PlotType = PlotType.Histogram, LineColor = "LawnGreen", Thickness = 3)]
        public IndicatorDataSeries outWeakBullish { get; set; }
        [Output("Down Bearish", PlotType = PlotType.Histogram, LineColor = "Red", Thickness = 3)]
        public IndicatorDataSeries outStrongBearish { get; set; }
        [Output("Up Bearish", PlotType = PlotType.Histogram, LineColor = "DarkSalmon", Thickness = 3)]
        public IndicatorDataSeries outWeakBearish { get; set; }
        
        private CommodityChannelIndex _cci;
        private DirectionalMovementSystem _dms;
        private IndicatorDataSeries _wsi;
        

        protected override void Initialize()
        {
            _cci = Indicators.CommodityChannelIndex(inpPeriodCCI);
            _dms = Indicators.DirectionalMovementSystem(20);
            _wsi = CreateDataSeries();
        }

        public override void Calculate(int i)
        {
            _wsi[i] = (_cci.Result[i] * _dms.ADX[i] * Bars.TypicalPrices[i]) * Symbol.PipSize;
            
            outWSI[i] = _wsi[i];
            outStrongBullish[i] = _wsi[i] > 0 && _wsi[i] > _wsi[i-1] ? _wsi[i] : double.NaN;
            outWeakBullish[i] = _wsi[i] > 0 && _wsi[i] <= _wsi[i-1] ? _wsi[i] : double.NaN;
            outStrongBearish[i] = _wsi[i] < 0 && _wsi[i] < _wsi[i-1] ? _wsi[i] : double.NaN;
            outWeakBearish[i] = _wsi[i] < 0 && _wsi[i] >= _wsi[i-1] ? _wsi[i] : double.NaN;
        }
    }
}