Warning! This section will be deprecated on February 1st 2025. Please move all your Indicators to the cTrader Store catalogue.
Description
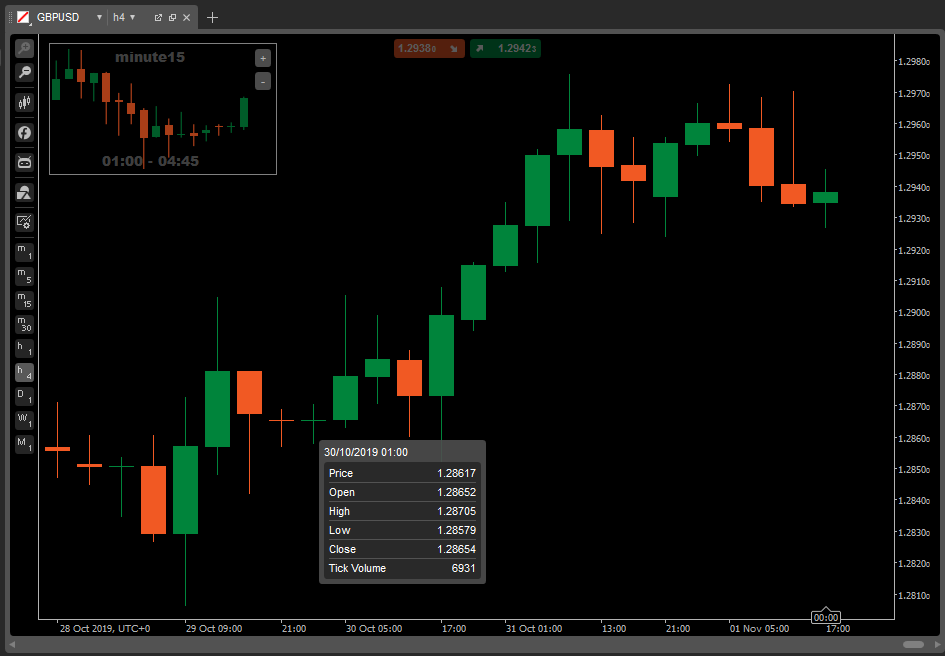
Are you want to view detailed bars from a smaller timeframe? Just move the cursor!
P.S. Hold "Shift" to freeze the image.
Feel free to make your suggestions to improve this indicator!
using System;
using cAlgo.API;
using cAlgo.API.Internals;
using System.Collections.Generic;
using System.Linq;

namespace cAlgo
{
    [Indicator(IsOverlay = true, TimeZone = TimeZones.UTC, AccessRights = AccessRights.None)]
    public class ChartInChart : Indicator
    {
        private static readonly TimeFrame[] TimeFrames;
        private static readonly Dictionary<TimeFrame, uint> TimeFrameMinutes;
        private TimeFrame[] _compatibleTimeFrames;
        private int _currentIndex;

        [Parameter("Vertical", DefaultValue = VerticalAlignment.Top, Group = "Alignment")]
        public VerticalAlignment VerticalAlignment { get; set; }

        [Parameter("Horizontal", DefaultValue = HorizontalAlignment.Left, Group = "Alignment")]
        public HorizontalAlignment HorizontalAlignment { get; set; }

        [Parameter("Width", DefaultValue = 120, Group = "Size")]
        public int Width {  get; set;}

        [Parameter("Height", DefaultValue = 60, Group = "Size")]
        public int Height { get; set; }

        [Parameter("Opacity", DefaultValue = 0.6, MinValue = 0.1, MaxValue = 1, Group = "Other")]
        public double Opacity { get; set; }

        [Parameter("Show Period", DefaultValue = true, Group = "Other")]
        public bool ShowPeriod { get; set; }

        [Parameter("Show Time Range", DefaultValue = true, Group = "Other")]
        public bool ShowTimeRange { get; set; }

        static ChartInChart()
        {
            TimeFrames = new[]
            {
                TimeFrame.Minute,
                TimeFrame.Minute2,
                TimeFrame.Minute3,
                TimeFrame.Minute4,
                TimeFrame.Minute5,
                TimeFrame.Minute6,
                TimeFrame.Minute7,
                TimeFrame.Minute8,
                TimeFrame.Minute9,
                TimeFrame.Minute10,
                TimeFrame.Minute15,
                TimeFrame.Minute20,
                TimeFrame.Minute30,
                TimeFrame.Minute45,
                TimeFrame.Hour,
                TimeFrame.Hour2,
                TimeFrame.Hour3,
                TimeFrame.Hour4,
                TimeFrame.Hour6,
                TimeFrame.Hour8,
                TimeFrame.Hour12,
                TimeFrame.Daily,
                TimeFrame.Day2,
                TimeFrame.Day3,
                TimeFrame.Weekly,
                TimeFrame.Monthly
            };

            TimeFrameMinutes = new Dictionary<TimeFrame, uint>()
            {
                {TimeFrame.Minute,      1      },
                {TimeFrame.Minute2,     2      },
                {TimeFrame.Minute3,     3      },
                {TimeFrame.Minute4,     4      },
                {TimeFrame.Minute5,     5      },
                {TimeFrame.Minute6,     6      },
                {TimeFrame.Minute7,     7      },
                {TimeFrame.Minute8,     8      },
                {TimeFrame.Minute9,     9      },
                {TimeFrame.Minute10,    10      },
                {TimeFrame.Minute15,    15      },
                {TimeFrame.Minute20,     20     },
                {TimeFrame.Minute30,     30     },
                {TimeFrame.Minute45,     45     },
                {TimeFrame.Hour,         60     },
                {TimeFrame.Hour2,        60*2     },
                {TimeFrame.Hour3,        60*3     },
                {TimeFrame.Hour4,        60*4     },
                {TimeFrame.Hour6,        60*6     },
                {TimeFrame.Hour8,        60*8     },
                {TimeFrame.Hour12,       60*12     },
                {TimeFrame.Daily,        60*24     },
                {TimeFrame.Day2,         60*24*2     },
                {TimeFrame.Day3,         60*24*3     },
                {TimeFrame.Weekly,       60*24*7     },
                { TimeFrame.Monthly,      60*24*31     },
            };
        }

        public override void Calculate(int index)
        {
            if (_panelCanvas != null)
                UpdatePanelData(_lastParentBarIndex);
        }

        protected override void Initialize()
        {
            var tfSize = GetMinutes(TimeFrame);
            var tfIndex = Array.IndexOf(TimeFrames, TimeFrame);

            if (tfSize <= 1 || tfIndex < 0)
                return;

            _compatibleTimeFrames = GetCompatibleTimeFrames(tfIndex, tfSize).ToArray();
            _currentIndex = 0;

            UpdatePanel();

            Chart.MouseMove += Chart_MouseMove;
        }

        Canvas _panelCanvas = null;
        List<Shape> _panelShapes = new List<Shape>();

        private void UpdatePanel()
        {
            if (_panelCanvas == null)
            {
                _panelCanvas = CreatePanel();
            }

            var currentTimeFrame = _compatibleTimeFrames[_currentIndex];
            var barCount = GetMinutes(TimeFrame) / GetMinutes(currentTimeFrame);
            _barPartWidth = (double) Width / barCount / 3d;

            Print("Current: ", currentTimeFrame, ", bars: ", barCount);

            _periodTextBlock.Text = currentTimeFrame.ToString().ToLower();
            _zoomOutBtn.IsEnabled = _currentIndex > 0;
            _zoomInBtn.IsEnabled = _currentIndex < _compatibleTimeFrames.Length - 1;

            UpdatePanelData(-1);
        }

        private void Chart_MouseMove(ChartMouseEventArgs obj)
        {
            if (obj.ShiftKey)
                return;

            UpdatePanelData((int) Math.Ceiling(obj.BarIndex));
        }

        int _lastParentBarIndex = -1;
        private TextBlock _periodTextBlock;
        private Button _zoomInBtn;
        private Button _zoomOutBtn;
        private double _barPartWidth;
        private TextBlock _rangeTextBlock;

        private void UpdatePanelData(int parentBarIndex)
        {
            if (_lastParentBarIndex == parentBarIndex && parentBarIndex < MarketSeries.OpenTime.Count - 2)
                return;

            _lastParentBarIndex = parentBarIndex;

            foreach (var s in _panelShapes)
                _panelCanvas.RemoveChild(s);

            _panelShapes.Clear();
            _rangeTextBlock.Text = string.Empty;

            if (parentBarIndex < 0)
                return;

            var currentBarTime = MarketSeries.OpenTime[parentBarIndex];
            if (currentBarTime == DateTime.MinValue)
                return;

            var maxPrice = MarketSeries.High[parentBarIndex];
            var minPrice = MarketSeries.Low[parentBarIndex];

            var nextBarTime = MarketSeries.OpenTime.Count == parentBarIndex + 1
                ? DateTime.MaxValue
                : MarketSeries.OpenTime[parentBarIndex + 1];

            var currentTimeFrame = _compatibleTimeFrames[_currentIndex];
            var currentSeries = MarketData.GetSeries(currentTimeFrame);
            var currentBarIndex = currentSeries.OpenTime.GetIndexByTime(currentBarTime);

            var firstBar = currentSeries.OpenTime[currentBarIndex].ToString("HH:mm");

            double barWidth = _barPartWidth * 2;
            double offset = _barPartWidth / 2;
            while (currentBarTime < nextBarTime && currentBarIndex < currentSeries.OpenTime.Count)
            {
                var open = Transform(minPrice, maxPrice, currentSeries.Open[currentBarIndex]);
                var close = Transform(minPrice, maxPrice, currentSeries.Close[currentBarIndex]);

                Color barColor;

                if (currentSeries.Open[currentBarIndex] > currentSeries.Close[currentBarIndex])
                    barColor = Chart.ColorSettings.BearFillColor;
                else
                    barColor = Chart.ColorSettings.BullFillColor;

                if (Math.Abs(open - close) >= Symbol.TickValue)
                {
                    var ocRect = new Rectangle();
                    ocRect.StrokeThickness = 0;
                    ocRect.FillColor = barColor;
                    ocRect.Width = barWidth;
                    ocRect.Left = offset;
                    ocRect.Top = Math.Min(open, close);
                    ocRect.Height = Math.Max(open, close) - ocRect.Top;

                    _panelShapes.Add(ocRect);
                    _panelCanvas.AddChild(ocRect);
                }
                else
                {
                    if (currentSeries.Open[currentBarIndex - 1] > currentSeries.Close[currentBarIndex - 1])
                        barColor = Chart.ColorSettings.BearFillColor;
                    else
                        barColor = Chart.ColorSettings.BullFillColor;

                    var ocLine = new Line();
                    ocLine.StrokeThickness = 1.2;
                    ocLine.StrokeColor = barColor;
                    ocLine.X1 = offset;
                    ocLine.X2 = offset + barWidth;
                    ocLine.Y1 = open;
                    ocLine.Y2 = close;

                    _panelShapes.Add(ocLine);
                    _panelCanvas.AddChild(ocLine);
                }

                var hlLine = new Line();
                hlLine.StrokeThickness = 1 * 1.2;
                hlLine.StrokeColor = barColor;
                hlLine.X1 = offset + _barPartWidth;
                hlLine.X2 = offset + _barPartWidth;
                hlLine.Y1 = Transform(minPrice, maxPrice, currentSeries.High[currentBarIndex]);
                hlLine.Y2 = Transform(minPrice, maxPrice, currentSeries.Low[currentBarIndex]);

                _panelShapes.Add(hlLine);
                _panelCanvas.AddChild(hlLine);

                offset += _barPartWidth + barWidth;

                currentBarTime = currentSeries.OpenTime[++currentBarIndex];
            }

            var lastBar = currentSeries.OpenTime[currentBarIndex - 1].ToString("HH:mm");

            _rangeTextBlock.Text = string.Format("{0} - {1}", firstBar, lastBar);
        }

        private Canvas CreatePanel()
        {
            var canvas = new Canvas();
            canvas.Margin = "0 5";
            canvas.Width = Width;
            canvas.Height = Height;

            _zoomInBtn = new Button();
            _zoomInBtn.Text = "+";
            _zoomInBtn.Padding = "5 2";
            _zoomInBtn.Margin = "5 5 5 0";
            _zoomInBtn.Click += _zoomInBtn_Click;

            _zoomOutBtn = new Button();
            _zoomOutBtn.Text = "-";
            _zoomOutBtn.Padding = "5 2";
            _zoomOutBtn.Margin = "5 5 5 0";
            _zoomOutBtn.Click += _zoomOutBtn_Click;

            _periodTextBlock = new TextBlock();
            _periodTextBlock.Margin = 5;
            _periodTextBlock.FontSize = 14;
            _periodTextBlock.FontWeight = FontWeight.ExtraBold;
            _periodTextBlock.Opacity = 0.5;
            _periodTextBlock.ForegroundColor = Chart.ColorSettings.ForegroundColor;
            _periodTextBlock.TextAlignment = TextAlignment.Center;
            _periodTextBlock.VerticalAlignment = VerticalAlignment.Top;

            _rangeTextBlock = new TextBlock();
            _rangeTextBlock.Margin = 5;
            _rangeTextBlock.FontSize = 14;
            _rangeTextBlock.FontWeight = FontWeight.ExtraBold;
            _rangeTextBlock.Opacity = 0.5;
            _rangeTextBlock.ForegroundColor = Chart.ColorSettings.ForegroundColor;
            _rangeTextBlock.TextAlignment = TextAlignment.Center;
            _rangeTextBlock.VerticalAlignment = VerticalAlignment.Bottom;

            var grid = new Grid(3, 2);
            grid.Rows[0].SetHeightToAuto();
            grid.Rows[1].SetHeightToAuto();
            grid.Rows[2].SetHeightInStars(1);

            grid.AddChild(canvas, 0, 0, 3, 1);

            if (ShowPeriod)
                grid.AddChild(_periodTextBlock, 0, 0, 3, 1);

            if (ShowTimeRange)
                grid.AddChild(_rangeTextBlock, 0, 0, 3, 1);
            grid.AddChild(_zoomInBtn, 0, 1);
            grid.AddChild(_zoomOutBtn, 1, 1);

            var border = new Border();
            border.BorderThickness = 1;
            border.BorderColor = Color.Gray;
            border.Margin = 10;
            border.VerticalAlignment = VerticalAlignment;
            border.HorizontalAlignment = HorizontalAlignment;
            border.Child = grid;

            var gridStyle = new Style();
            gridStyle.Set(ControlProperty.BackgroundColor, Chart.ColorSettings.BackgroundColor);
            gridStyle.Set(ControlProperty.Opacity, Opacity);
            gridStyle.Set(ControlProperty.Opacity, 1, ControlState.Hover);

            grid.Style = gridStyle;

            Chart.AddControl(border);
            return canvas;
        }

        private void _zoomOutBtn_Click(ButtonClickEventArgs obj)
        {
            if (_currentIndex > 0)
            {
                _currentIndex--;
                UpdatePanel();
            }
        }

        private double Transform(double min, double max, double val)
        {
            return _panelCanvas.Height - (val - min) / (max - min) * _panelCanvas.Height;
        }

        private void _zoomInBtn_Click(ButtonClickEventArgs obj)
        {
            if (_currentIndex < _compatibleTimeFrames.Length - 1)
            {
                _currentIndex++;
                UpdatePanel();
            }
        }

        private uint GetMinutes(TimeFrame timeFrame)
        {
            uint result;

            if (TimeFrameMinutes.TryGetValue(timeFrame, out result))
                return result;

            return 0;
        }

        private IEnumerable<TimeFrame> GetCompatibleTimeFrames(int startIndex, uint parentSize)
        {
            for (int i = startIndex -1; i >=0; i--)
            {
                var timeFrame = TimeFrames[i];

                if (parentSize % TimeFrameMinutes[timeFrame] == 0)
                {
                    Print("Found: ", timeFrame);
                    yield return timeFrame;
                }
            }
        }
    }
}

devman
Joined on 22.10.2019
- Distribution: Free
- Language: C#
- Trading platform: cTrader Automate
- File name: Chart-In-Chart.algo
- Rating: 5
- Installs: 3068
- Modified: 13/10/2021 09:55

Note that publishing copyrighted material is strictly prohibited. If you believe there is copyrighted material in this section, please use the Copyright Infringement Notification form to submit a claim.
Comments
Log in to add a comment.
TR
is it also possible to see tick charts? could you explain how we could do it to also see tick charts??
EY
Devman. Great Indicator BTW. Suggestion. Can it have a function using the current candle if the mouse is in the margin rather than over the candle thats printing. Also if say using the 5min window on the 1 hour chart can i see the candles of the last 3 hrs.
EF
how i do to see daily minichart on 5min tf main chart??
This is a great indicator,also well coded and nice job. :)
This is a very nice Indicator, such a great idea!
+1 vote from me for the Tick Chart request too.