Topics
Replies
Scott
29 May 2013, 22:11
RE:
Hi support
still carn't get this to work, I see that I posted the wrong information in the first place.
what i'm trying to do is the same but the indicator is the fibbandsRT indicator doesnt want to show the 233 SMA from the fiblevelsRT Indicator if the 233sma is above band3 of fibbandsRT or bottom band3
the code below shows the name changes as above and builds but now none of the sma will not show
the two indicators are on the site /algos/indicators/show/267 fibbandsRT and fiblevelsRT
//#reference: C:\Users\scott\Documents\cAlgo\Sources\Indicators\fibbandsRT.algo
using System;
using cAlgo.API;
using cAlgo.API.Indicators;
namespace cAlgo.Indicators
{
[Indicator(IsOverlay = true)]
public class fiblevelsRT : Indicator
{
private fiblevelsRT fiblevelsRTIndicator;
private fibbandsRT fibbandsRTIndicator;
[Parameter]
public DataSeries Source { get; set; }
[Parameter("L1", DefaultValue = 21)]
public int Periods { get; set; }
[Parameter("L2", DefaultValue = 34)]
public int Periods2 { get; set; }
[Parameter("L3", DefaultValue = 55)]
public int Periods3 { get; set; }
[Parameter("L7", DefaultValue = 233)]
public int Periods7 { get; set; }
[Output("Level1", Color = Colors.Lime, Thickness = 5, LineStyle = LineStyle.DotsVeryRare)]
public IndicatorDataSeries Result { get; set; }
[Output("Level2", Color = Colors.Yellow, Thickness = 5, LineStyle = LineStyle.DotsVeryRare)]
public IndicatorDataSeries Result2 { get; set; }
[Output("Level3", Color = Colors.White, Thickness = 5, LineStyle = LineStyle.DotsVeryRare)]
public IndicatorDataSeries Result3 { get; set; }
[Output("Level7", Color = Colors.Red, Thickness = 5, LineStyle = LineStyle.DotsVeryRare)]
public IndicatorDataSeries Result7 { get; set; }
private SimpleMovingAverage _simpleMovingAverage1;
private SimpleMovingAverage _simpleMovingAverage2;
private SimpleMovingAverage _simpleMovingAverage3;
private SimpleMovingAverage _simpleMovingAverage7;
protected override void Initialize()
{
_simpleMovingAverage1 = Indicators.SimpleMovingAverage(Source, Periods);
_simpleMovingAverage2 = Indicators.SimpleMovingAverage(Source, Periods2);
_simpleMovingAverage3 = Indicators.SimpleMovingAverage(Source, Periods3);
_simpleMovingAverage7 = Indicators.SimpleMovingAverage(Source, Periods7);
}
public override void Calculate(int index)
{
if (!IsRealTime) return;
bool condition = _simpleMovingAverage7.Result[index] <= fibbandsRTIndicator.UpperBand3[index]
|| _simpleMovingAverage7.Result[index] <= fibbandsRTIndicator.LowerBand3[index];
for (int i = index - 10; i <= index; i++)
{
Result[i] = _simpleMovingAverage1.Result[index];
Result2[i] = _simpleMovingAverage2.Result[index];
Result3[i] = _simpleMovingAverage3.Result[index];
Result7[i] = _simpleMovingAverage7.Result[index];
}
for(int i = 0; i < index - 10; i++)
{
Result[i] = double.NaN;
Result2[i] = double.NaN;
Result3[i] = double.NaN;
Result7[i] = double.NaN;
}
for (int i = index - 10; i <= index; i++)
{
Result[i] = _simpleMovingAverage1.Result[index];
//...
Result7[i] = _simpleMovingAverage7.Result[index];
if (condition)
Result7[i] = _simpleMovingAverage7.Result[index];
}
int xPos = index + 1;
double yPos = _simpleMovingAverage1.Result[index];
var text = String.Format("{0}", Math.Round(yPos, Symbol.Digits));
ChartObjects.DrawText("obj1", text, xPos, yPos, VerticalAlignment.Center, HorizontalAlignment.Left,Colors.Lime);
yPos = _simpleMovingAverage2.Result[index];
text = String.Format("{0}", Math.Round(yPos, Symbol.Digits));
ChartObjects.DrawText("obj2", text, xPos, yPos, VerticalAlignment.Bottom, HorizontalAlignment.Left,Colors.Yellow);
yPos = _simpleMovingAverage3.Result[index];
text = String.Format("{0}", Math.Round(yPos, Symbol.Digits));
ChartObjects.DrawText("obj3", text, xPos, yPos, VerticalAlignment.Center, HorizontalAlignment.Left,Colors.White);
yPos = _simpleMovingAverage7.Result[index];
text = String.Format("{0}", Math.Round(yPos, Symbol.Digits));
ChartObjects.DrawText("obj7", text, xPos, yPos, VerticalAlignment.Top, HorizontalAlignment.Left, Colors.Red);
}
}
}
@Scott
Scott
26 May 2013, 23:11
RE:
You will have to reference the first indicator in the other (same as with the AverageTrueRange) and the SMA 233 will be set to a value if the condition your are describing is met.
// add the reference to FibGrid7Chart

// in the global scope before any methods
private FibGrid7Chart FibGrid7ChartIndicator;

// inside the for loop that displays the results in the caclulate method
//the 233 SMA to not show on the chart till its is equal to or less than the Upper Band 3 or Lower Band 3 of the Fibonacci Indicator
bool condition = _simpleMovingAverage7.Result[index] <= FibGrid7ChartIndicator.Upperband3[index] || _simpleMovingAverage7.Result[index] <= FibGrid7ChartIndicator.LowerBand3.[index]

if(condition)
     Result7[i] = _simpleMovingAverage7.Result[index];
could you show me where the code goes I've tried mutiple combonations, I've followed your instructions but I carn't seem to work out where I'm going wrong, thanks
@Scott
Scott
10 May 2013, 16:09
RE:
Hi All!
Is it possible to place two or more indicators in one indicator window? Now i look the situation when eash indicator takes own separate window on bottom of chart.
I've tried to work this one out in the past with no luck, you can however have more than 2 indicators overlayed on a chart
@Scott
Scott
10 May 2013, 16:08
RE: communicating robots
Is there any way to communicate 2 robot instances (not using files)?
You can use this http://www.scyware.com/
@Scott
Scott
09 May 2013, 23:44
RE: RE:
check this out http://help.spotware.com/calgo/videos?v=P_s6YHv3WXw
@Scott
Scott
09 May 2013, 23:34
RE:
I use the cTrader Desktop platform, very fast alows upto 25 charts to be open at once and they are detachable so you can place them over mutiple monitors, I only use 2.
As for saving templates yep works every time just download cAlgo and build the indicators in there and then they will be avalible on cTrader Desktop
Or if you just wanting to have a setup such as some simple moving averages over 10 charts layed out or detached and placed it will be automaticlly saved and when you restart the platform all the charts and any indicators you had setup before will be as they was when you last shut down.
You can also create templates to speed things up, say you wanted to put 3 simple moving averages on 10 charts, setup the first chart then save that setup as a template (give it a name) then just apply the template to the other 9 charts.
@Scott
Scott
09 May 2013, 23:14
RE:
So I spent like 30 minutes getting all my settings just right thinking that they would be saved. I closed the window, reopened and then all my settings were gone, only thing that remained were my favorites.
Did I do something wrong? Or can you really not save settings in ctrader?
Thanks
Same here I signed up for there cloud storage using my facebook and tried to save, that didn't work, so I signed up with email and tried to save and then that didnt work, then after login on a few times it came up with my saved setup only to have it not apear again the next time I login.... I'm very confused why this is.
@Scott
Scott
08 May 2013, 21:19
RE:
Is there a way to build an indicator that plots the broker's bid-ask spread?
Tks
Hi Lgon
This plots the Bid/Ask price, it will only show the history when in use, /algos/indicators/show/207
@Scott
Scott
03 May 2013, 20:04
RE:
http://www.scyware.com/ can be used for robots with multiple timeframes
@Scott
Scott
02 May 2013, 23:09
RE: RE: how
no probs, just a quick fix
happy to help.
I did think about using lables but at the moment the text size is fixed to either 14px or 16px and most, I would like to be able to show the bid/ask price at 24px but ctrader won't allow this for now
I've been tring to find a overlay magnifying software that would allow me to size it up in the mean while, but all the ones I've found so far require that the mouse pointer is in the area the window is magnifying.
@Scott
Scott
02 May 2013, 22:43
( Updated at: 21 Dec 2023, 09:20 )
how
Hi moneymax
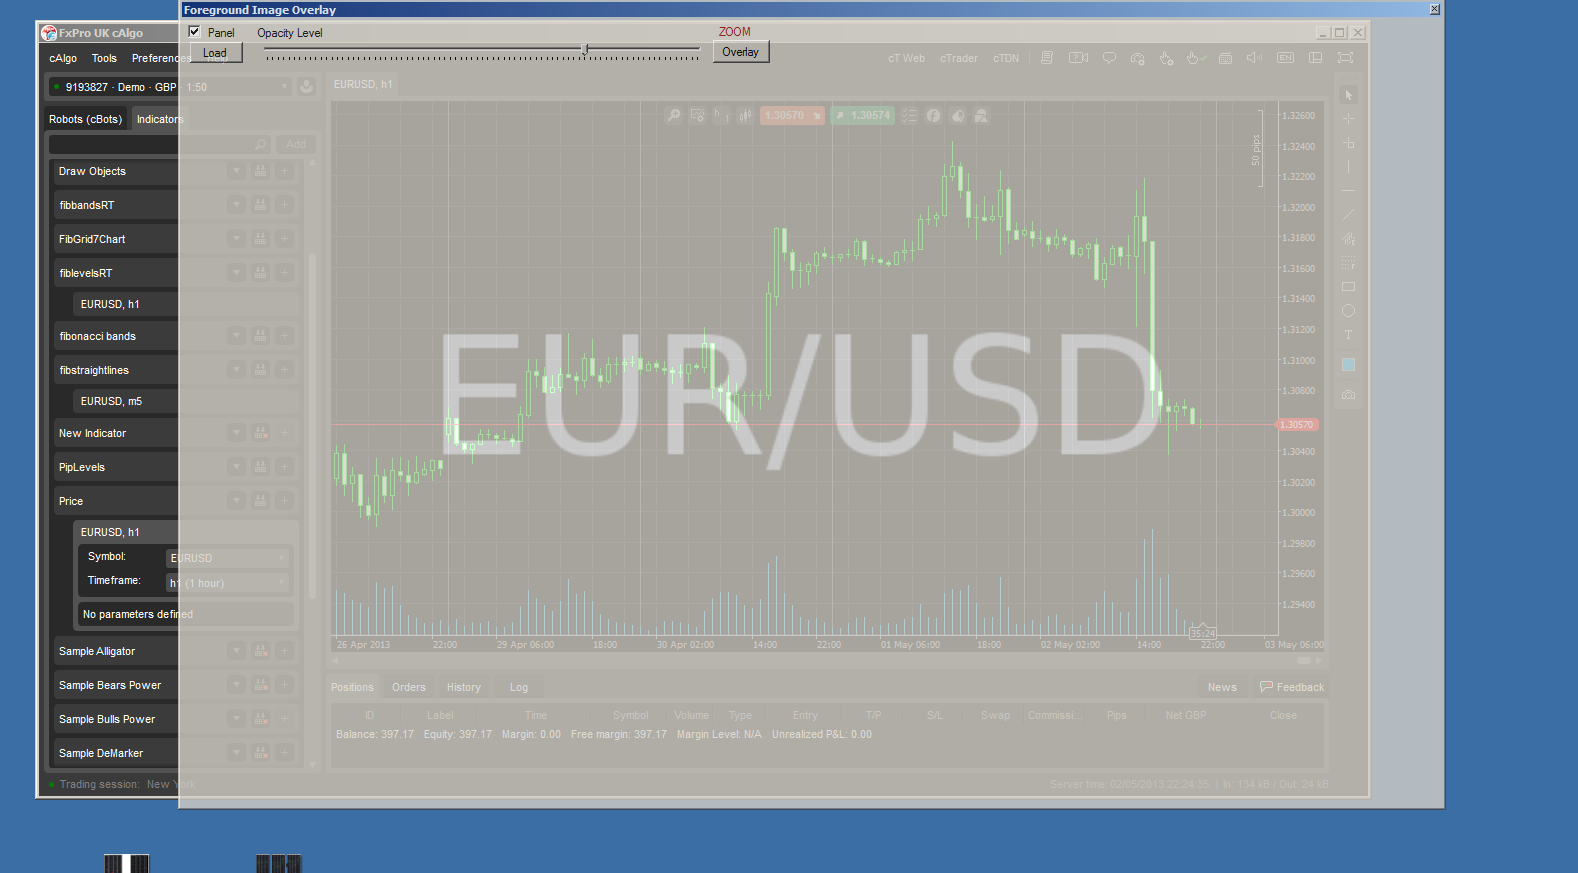
What I would do is open the overlay software load up the image, then size it up like below

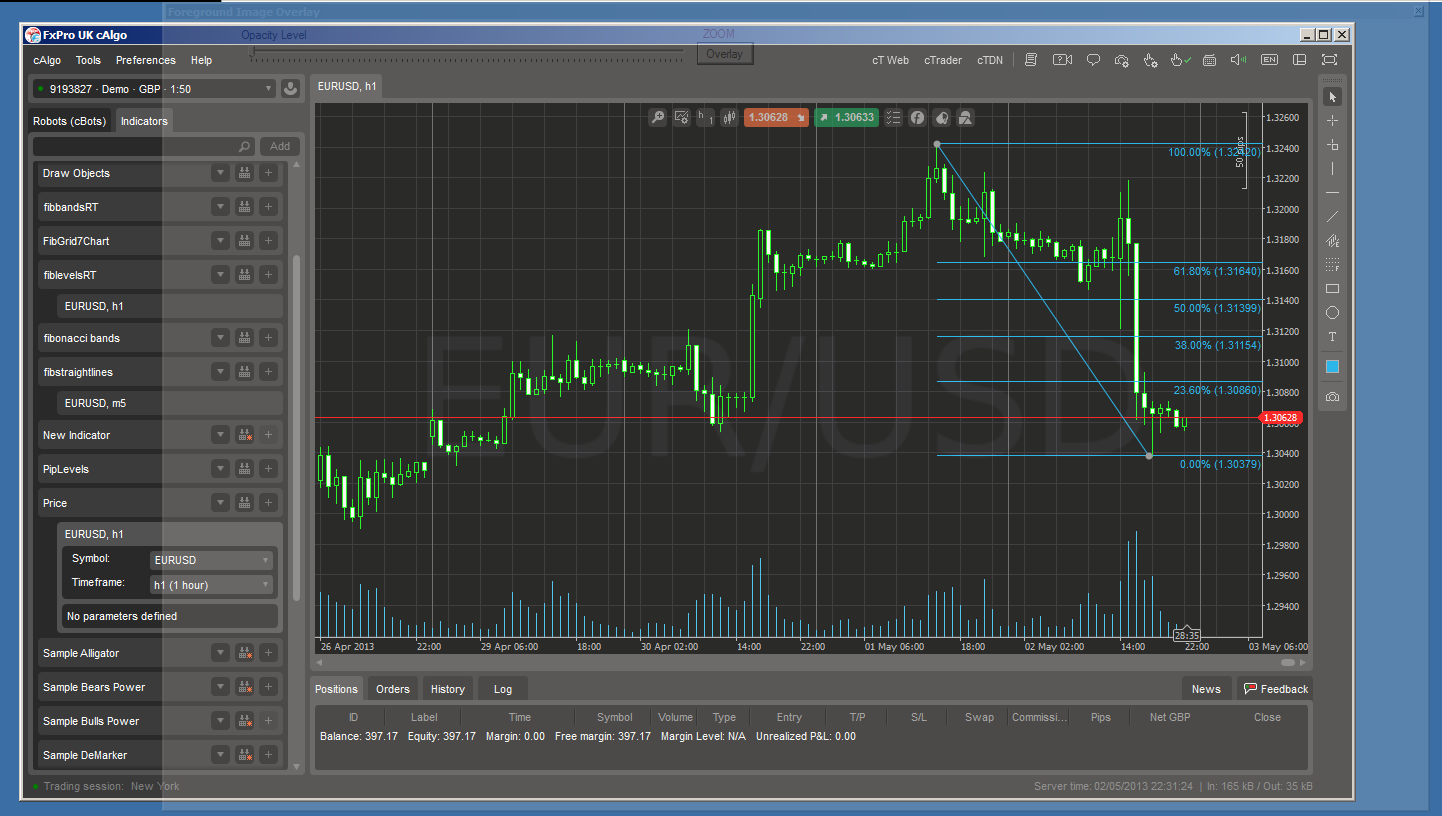
Then using opacity bar bring it down to its lowist setting, then click on overlay, and the result is below

You can then iteract with the chart, I put in a fib retracement as an example, you can open as many overlays as you want, so you can cover all 8 of your screens, to turn them of I us task manager and end process, don't know any other way but hey it works and thats the main thing.
I also run a web design business for a living, lol
@Scott
Scott
02 May 2013, 17:42
Pair name
Hi Moneymax
I came up with a solution to this by using this free software that allows you to create a transparent background overlay, that also allows you to interact with the charts under it http://www.digitalartistguild.com/misc/UtilityExplain/UtilityExplain.html
you can open multiple copies, I take it that you know how to create a transparent .png if this is not the case then download GIMP and you'll be able to create one from that (also free)
@Scott
Scott
30 May 2013, 19:18 ( Updated at: 21 Dec 2023, 09:20 )
RE:
Hi Support, It wouldn't build till I added 3 } at the bottom of the page and then it would build but the sma are not showing up on the chart, below is a screen shot and the code
I'm aware that I didn't put all the code in the download for the indicator as I thought that I would be able to have several downloads as a option as I published 3 indicators, I did put the code in the discription and made clear instuctions, I only did this as I had seen other indicators published this way, I will do a update as soon as I've got this problem solved
thanks for all you help its always appreciated
//#reference: C:\Users\scott\Documents\cAlgo\Sources\Indicators\fibbandsRT.algo
using System;
using cAlgo.API;
using cAlgo.API.Indicators;
namespace cAlgo.Indicators
{
[Indicator(IsOverlay = true)]
public class fiblevelsRT : Indicator
{
private fiblevelsRT fiblevelsRTIndicator;
private fibbandsRT fibbandsRTIndicator;
[Parameter]
public DataSeries Source { get; set; }
[Parameter("L1", DefaultValue = 21)]
public int Periods { get; set; }
[Parameter("L2", DefaultValue = 34)]
public int Periods2 { get; set; }
[Parameter("L3", DefaultValue = 55)]
public int Periods3 { get; set; }
[Parameter("L7", DefaultValue = 233)]
public int Periods7 { get; set; }
[Output("Level1", Color = Colors.Lime, Thickness = 5, LineStyle = LineStyle.DotsVeryRare)]
public IndicatorDataSeries Result { get; set; }
[Output("Level2", Color = Colors.Yellow, Thickness = 5, LineStyle = LineStyle.DotsVeryRare)]
public IndicatorDataSeries Result2 { get; set; }
[Output("Level3", Color = Colors.White, Thickness = 5, LineStyle = LineStyle.DotsVeryRare)]
public IndicatorDataSeries Result3 { get; set; }
[Output("Level7", Color = Colors.Red, Thickness = 5, LineStyle = LineStyle.DotsVeryRare)]
public IndicatorDataSeries Result7 { get; set; }
private SimpleMovingAverage _simpleMovingAverage1;
private SimpleMovingAverage _simpleMovingAverage2;
private SimpleMovingAverage _simpleMovingAverage3;
private SimpleMovingAverage _simpleMovingAverage7;
protected override void Initialize()
{
_simpleMovingAverage1 = Indicators.SimpleMovingAverage(Source, Periods);
_simpleMovingAverage2 = Indicators.SimpleMovingAverage(Source, Periods2);
_simpleMovingAverage3 = Indicators.SimpleMovingAverage(Source, Periods3);
_simpleMovingAverage7 = Indicators.SimpleMovingAverage(Source, Periods7);
}
public override void Calculate(int index)
{
if (!IsRealTime) return;
bool condition = _simpleMovingAverage7.Result[index] >= fibbandsRTIndicator.UpperBand3[index]
|| _simpleMovingAverage7.Result[index] <= fibbandsRTIndicator.LowerBand3[index];
for (int i = 0; i < index - 10; i++)
{
Result[i] = double.NaN;
Result2[i] = double.NaN;
Result3[i] = double.NaN;
Result7[i] = double.NaN;
}
for (int i = index - 10; i <= index; i++)
{
Result[i] = _simpleMovingAverage1.Result[index];
Result2[i] = _simpleMovingAverage2.Result[index];
Result3[i] = _simpleMovingAverage3.Result[index];
if (condition)
Result7[i] = _simpleMovingAverage7.Result[index];
}
int xPos = index + 1;
double yPos = _simpleMovingAverage1.Result[index];
var text = String.Format("{0}", Math.Round(yPos, Symbol.Digits));
ChartObjects.DrawText("obj1", text, xPos, yPos, VerticalAlignment.Top, HorizontalAlignment.Left,
Colors.Lime);
yPos = _simpleMovingAverage2.Result[index];
text = String.Format("{0}", Math.Round(yPos, Symbol.Digits));
ChartObjects.DrawText("obj2", text, xPos, yPos, VerticalAlignment.Top, HorizontalAlignment.Left,
Colors.Yellow);
yPos = _simpleMovingAverage3.Result[index];
text = String.Format("{0}", Math.Round(yPos, Symbol.Digits));
ChartObjects.DrawText("obj3", text, xPos, yPos, VerticalAlignment.Top, HorizontalAlignment.Left,
Colors.White);
if (condition)
{
yPos = _simpleMovingAverage7.Result[index];
text = String.Format("{0}", Math.Round(yPos, Symbol.Digits));
ChartObjects.DrawText("obj7", text, xPos, yPos, VerticalAlignment.Top, HorizontalAlignment.Left, Colors.Red);
}
}
}
}
@Scott