
Topics
Replies
Scott
19 Apr 2013, 20:55
RE: the fuction
So the main fuction is to set a distance based of the 2 nd upper and lower fibonacci lines, the other function is for none of the SMA or Fibonacci line to show unless they are equal to or within the range of the pip view set.
If this is not clear please ask me further questions, thanks Scott
@Scott
Scott
12 Apr 2013, 21:19
RE: the code for both indicators
//#reference: C:\Users\scott\Documents\cAlgo\Sources\Indicators\averageTrueRange.algo
using System;
using cAlgo.API;
using cAlgo.API.Indicators;
namespace cAlgo.Indicators
{
[Indicator(IsOverlay = true)]
public class FibGrid7Chart : Indicator
{
private averageTrueRange _averageTrueRange;
private ExponentialMovingAverage _exponentialMovingAverage;
[Parameter(DefaultValue = 55)]
public int PeriodEma { get; set; }
[Parameter(DefaultValue = 21)]
public int PeriodAtr { get; set; }
[Output("Upper Band 1", Color = Colors.Aqua)]
public IndicatorDataSeries UpperBand1 { get; set; }
[Output("Upper Band 2", Color = Colors.DeepSkyBlue)]
public IndicatorDataSeries UpperBand2 { get; set; }
[Output("Upper Band 3", Color = Colors.DodgerBlue)]
public IndicatorDataSeries UpperBand3 { get; set; }
[Output("Upper Band 4", Color = Colors.Aquamarine)]
public IndicatorDataSeries UpperBand4 { get; set; }
[Output("Lower Band 1", Color = Colors.Aqua)]
public IndicatorDataSeries LowerBand1 { get; set; }
[Output("Lower Band 2", Color = Colors.DeepSkyBlue)]
public IndicatorDataSeries LowerBand2 { get; set; }
[Output("Lower Band 3", Color = Colors.DodgerBlue)]
public IndicatorDataSeries LowerBand3 { get; set; }
[Output("Lower Band 4", Color = Colors.Aquamarine)]
public IndicatorDataSeries LowerBand4 { get; set; }
[Output("EMA", Color = Colors.Purple)]
public IndicatorDataSeries Ema { get; set; }
protected override void Initialize()
{
_averageTrueRange = Indicators.GetIndicator<averageTrueRange>(PeriodAtr);
_exponentialMovingAverage = Indicators.ExponentialMovingAverage(MarketSeries.Close, PeriodEma);
}
public override void Calculate(int index)
{
if (!IsRealTime) return;
for (int i = index - 10; i <= index; i++)
{
double ema = _exponentialMovingAverage.Result[index];
double atr = _averageTrueRange.atr[index];
UpperBand1[i] = ema + 1.62*atr;
UpperBand2[i] = ema + 2.62*atr;
UpperBand3[i] = ema + 4.23*atr;
UpperBand4[i] = ema + 1*atr;
LowerBand1[i] = ema - 1.62*atr;
LowerBand2[i] = ema - 2.62*atr;
LowerBand3[i] = ema - 4.23*atr;
LowerBand4[i] = ema - 1*atr;
Ema[i] = ema;
}
for (int i = 0; i < index - 10; i++)
{
UpperBand1[i] = double.NaN;
UpperBand2[i] = double.NaN;
UpperBand3[i] = double.NaN;
UpperBand4[i] = double.NaN;
LowerBand1[i] = double.NaN;
LowerBand2[i] = double.NaN;
LowerBand3[i] = double.NaN;
LowerBand4[i] = double.NaN;
Ema[i] = double.NaN;
}
int xPos = index + 1;
double yPos = UpperBand1[index];
string text = String.Format("{0}", Math.Round(yPos, Symbol.Digits));
ChartObjects.DrawText("obj1", text, xPos, yPos, VerticalAlignment.Top, HorizontalAlignment.Left, Colors.Aqua);
yPos = UpperBand2[index];
text = String.Format("{0}", Math.Round(yPos, Symbol.Digits));
ChartObjects.DrawText("obj2", text, xPos, yPos, VerticalAlignment.Top, HorizontalAlignment.Left,
Colors.DeepSkyBlue);
yPos = UpperBand3[index];
text = String.Format("{0}", Math.Round(yPos, Symbol.Digits));
ChartObjects.DrawText("obj3", text, xPos, yPos, VerticalAlignment.Top, HorizontalAlignment.Left,
Colors.DodgerBlue);
yPos = UpperBand4[index];
text = String.Format("{0}", Math.Round(yPos, Symbol.Digits));
ChartObjects.DrawText("obj4", text, xPos, yPos, VerticalAlignment.Top, HorizontalAlignment.Left, Colors.Aquamarine);
yPos = LowerBand1[index];
text = String.Format("{0}", Math.Round(yPos, Symbol.Digits));
ChartObjects.DrawText("obj5", text, xPos, yPos, VerticalAlignment.Top, HorizontalAlignment.Left, Colors.Aqua);
yPos = LowerBand2[index];
text = String.Format("{0}", Math.Round(yPos, Symbol.Digits));
ChartObjects.DrawText("obj6", text, xPos, yPos, VerticalAlignment.Top, HorizontalAlignment.Left,
Colors.DeepSkyBlue);
yPos = LowerBand3[index];
text = String.Format("{0}", Math.Round(yPos, Symbol.Digits));
ChartObjects.DrawText("obj7", text, xPos, yPos, VerticalAlignment.Top, HorizontalAlignment.Left,
Colors.DodgerBlue);
yPos = LowerBand4[index];
text = String.Format("{0}", Math.Round(yPos, Symbol.Digits));
ChartObjects.DrawText("obj8", text, xPos, yPos, VerticalAlignment.Top, HorizontalAlignment.Left, Colors.Aquamarine);
yPos = Ema[index];
text = String.Format("{0}", Math.Round(yPos, Symbol.Digits));
ChartObjects.DrawText("obj9", text, xPos, yPos, VerticalAlignment.Top, HorizontalAlignment.Left, Colors.Purple);
}
}
}
using System;
using cAlgo.API;
using cAlgo.API.Indicators;
namespace cAlgo.Indicators
{
[Indicator(IsOverlay = true)]
public class FibGrid7Chart : Indicator
{
[Parameter]
public DataSeries Source { get; set; }
[Parameter("L1", DefaultValue = 21)]
public int Periods { get; set; }
[Parameter("L2", DefaultValue = 34)]
public int Periods2 { get; set; }
[Parameter("L3", DefaultValue = 55)]
public int Periods3 { get; set; }
[Parameter("L7", DefaultValue = 233)]
public int Periods7 { get; set; }
[Output("Level1", Color = Colors.Lime, Thickness = 5, LineStyle = LineStyle.DotsVeryRare)]
public IndicatorDataSeries Result { get; set; }
[Output("Level2", Color = Colors.Yellow, Thickness = 5, LineStyle = LineStyle.DotsVeryRare)]
public IndicatorDataSeries Result2 { get; set; }
[Output("Level3", Color = Colors.White, Thickness = 5, LineStyle = LineStyle.DotsVeryRare)]
public IndicatorDataSeries Result3 { get; set; }
[Output("Level7", Color = Colors.Red, Thickness = 5, LineStyle = LineStyle.DotsVeryRare)]
public IndicatorDataSeries Result7 { get; set; }
private SimpleMovingAverage _simpleMovingAverage1;
private SimpleMovingAverage _simpleMovingAverage2;
private SimpleMovingAverage _simpleMovingAverage3;
private SimpleMovingAverage _simpleMovingAverage7;
protected override void Initialize()
{
_simpleMovingAverage1 = Indicators.SimpleMovingAverage(Source, Periods);
_simpleMovingAverage2 = Indicators.SimpleMovingAverage(Source, Periods2);
_simpleMovingAverage3 = Indicators.SimpleMovingAverage(Source, Periods3);
_simpleMovingAverage7 = Indicators.SimpleMovingAverage(Source, Periods7);
}
public override void Calculate(int index)
{
if (!IsRealTime) return;
for (int i = index - 10; i <= index; i++)
{
Result[i] = _simpleMovingAverage1.Result[index];
Result2[i] = _simpleMovingAverage2.Result[index];
Result3[i] = _simpleMovingAverage3.Result[index];
Result7[i] = _simpleMovingAverage7.Result[index];
}
for(int i = 0; i < index - 10; i++)
{
Result[i] = double.NaN;
Result2[i] = double.NaN;
Result3[i] = double.NaN;
Result7[i] = double.NaN;
}
int xPos = index + 1;
double yPos = _simpleMovingAverage1.Result[index];
var text = String.Format("{0}", Math.Round(yPos, Symbol.Digits));
ChartObjects.DrawText("obj1", text, xPos, yPos, VerticalAlignment.Center, HorizontalAlignment.Left,Colors.Lime);
yPos = _simpleMovingAverage2.Result[index];
text = String.Format("{0}", Math.Round(yPos, Symbol.Digits));
ChartObjects.DrawText("obj2", text, xPos, yPos, VerticalAlignment.Bottom, HorizontalAlignment.Left,Colors.Yellow);
yPos = _simpleMovingAverage3.Result[index];
text = String.Format("{0}", Math.Round(yPos, Symbol.Digits));
ChartObjects.DrawText("obj3", text, xPos, yPos, VerticalAlignment.Center, HorizontalAlignment.Left,Colors.White);
yPos = _simpleMovingAverage7.Result[index];
text = String.Format("{0}", Math.Round(yPos, Symbol.Digits));
ChartObjects.DrawText("obj7", text, xPos, yPos, VerticalAlignment.Top, HorizontalAlignment.Left, Colors.Red);
}
}
}
@Scott
Scott
11 Apr 2013, 15:02
RE:
Yes there are plans for implementing custom indicators on cTrader Web version.
Great, I've been having problems with the Desktop cTrader since monday, the level 2 prices keep on asking me to resubscribe due to slow connection, I have 56mb download so I know that wasn't true, I got in contact with my brooker and they acknowledged that there was a problem with there price feed and they was working on a fix.
Open question to anyone "Has anyone else experanced this problem since monday ???"
@Scott
Scott
08 Apr 2013, 23:47
( Updated at: 21 Dec 2023, 09:20 )
RE: Visual Improvements update
I've made a few changes but would still be intrested in the the above changes, the bid and ask price would benifit massively from being in a larger font, or detachable Level 2 boxes
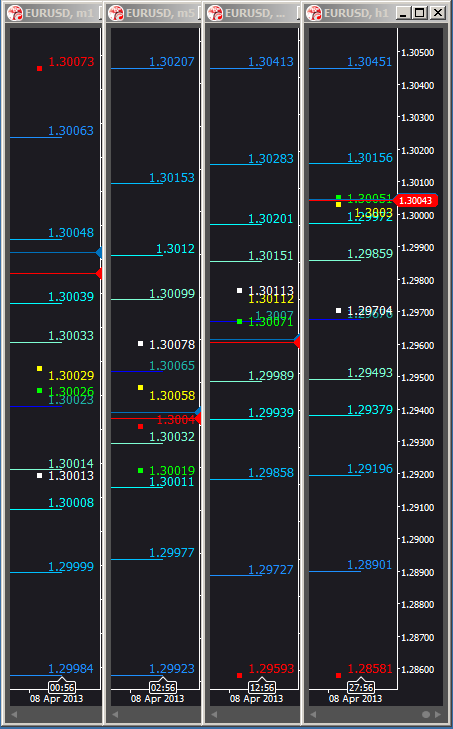
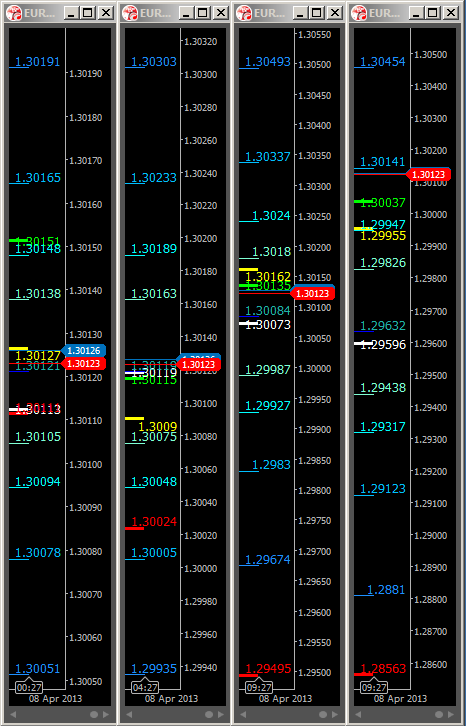
New style Fibonacci Indicator
@Scott
Scott
08 Apr 2013, 21:32
( Updated at: 21 Dec 2023, 09:20 )
Visual Improvements
Hi Support, One of the problems visually is crouding of the numbers, is there a way to have the real time SMA 21,34,55 and 233 show over the real time fibonacci bands for example highlight text/numbers background so that its black but only apply this to the SMA.
The SMA Lines would also have to override any fibonacci bands, and one last thing if possible if the prevous things can be done can the space between the fibonacci band levels be shaded between each other, this would also mean that the fib bands would need there price background highlighted yet still be overidden by SMA Levels
Thanks
@Scott
Scott
08 Apr 2013, 18:30
RE:
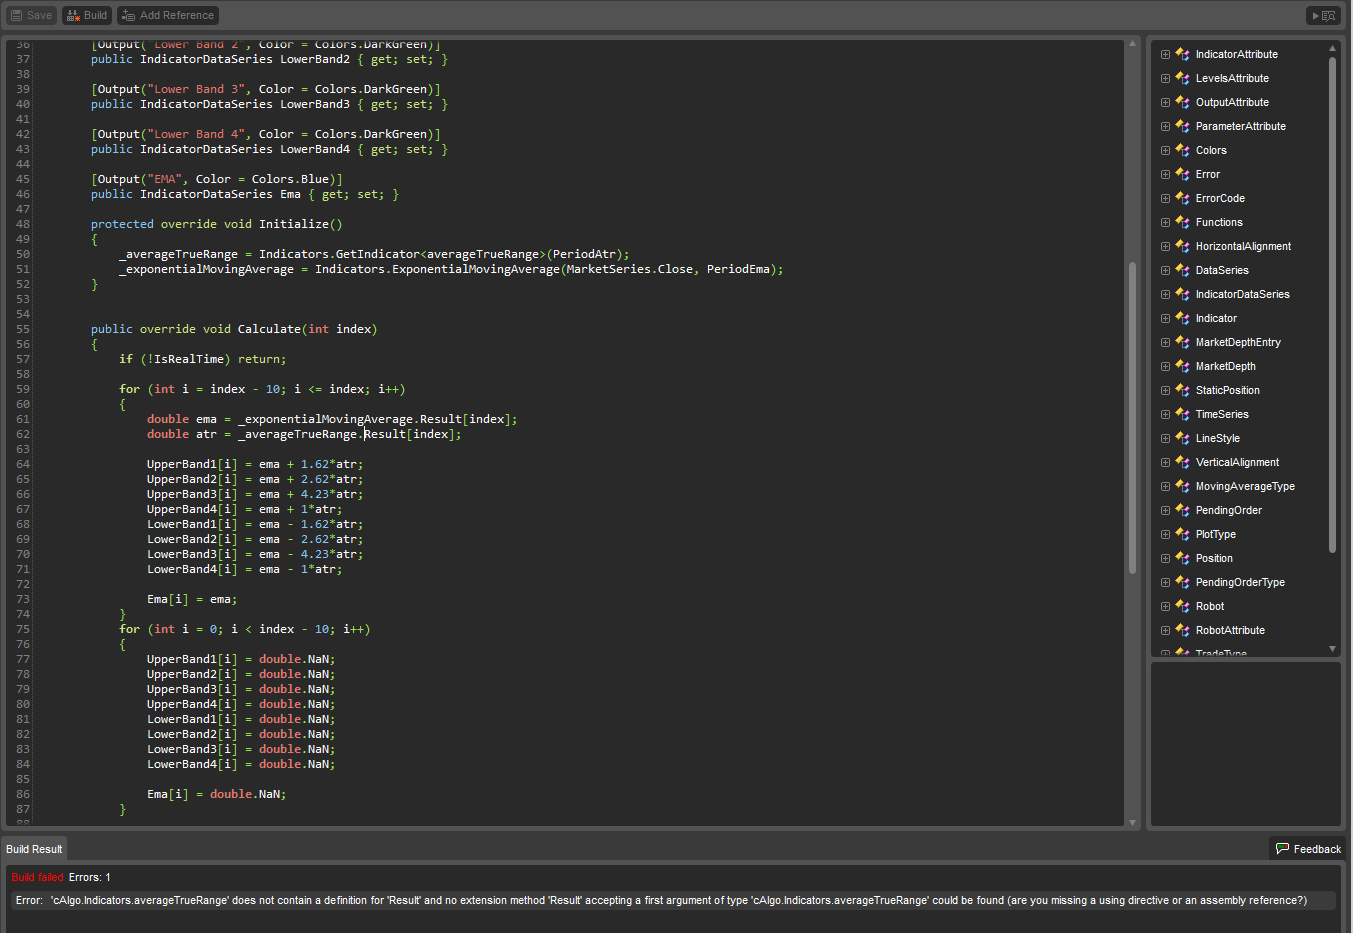
Depending on which is the AverageTrueRange indicator that you downloaded (you need to check that code) you may need to replace Result (in this indicator ) with either atr or ATR.
You need to check the name of the Output IndicatorDataSeries property.
i.e.
[Output("Average True Range", Color = Colors.Blue)]
public IndicatorDataSeries ATR { get; set; }
Or change the name of the AverageTrueRange indicator Output property to Result and rebuild it.
Thanks changing line 62 to averageTrueRange.atr worked
@Scott
Scott
08 Apr 2013, 17:44
( Updated at: 21 Dec 2023, 09:20 )
RE:
Is this what you need? If you need help understanding the code please let us know. We are here to help you learn cAlgo in order to build powerful indicators and robots.
//#reference: AverageTrueRange.algo

using System;
using cAlgo.API;
using cAlgo.API.Indicators;

namespace cAlgo.Indicators
{
    [Indicator(IsOverlay = true)]
    public class FibGrid7Chart : Indicator
    {
        private AverageTrueRange _averageTrueRange;
        private ExponentialMovingAverage _exponentialMovingAverage;

        [Parameter(DefaultValue = 55)]
        public int PeriodEma { get; set; }

        [Parameter(DefaultValue = 21)]
        public int PeriodAtr { get; set; }

        [Output("Upper Band 1", Color = Colors.DarkCyan)]
        public IndicatorDataSeries UpperBand1 { get; set; }

        [Output("Upper Band 2", Color = Colors.DarkCyan)]
        public IndicatorDataSeries UpperBand2 { get; set; }

        [Output("Upper Band 3", Color = Colors.DarkCyan)]
        public IndicatorDataSeries UpperBand3 { get; set; }

        [Output("Upper Band 4", Color = Colors.DarkCyan)]
        public IndicatorDataSeries UpperBand4 { get; set; }

        [Output("Lower Band 1", Color = Colors.DarkGreen)]
        public IndicatorDataSeries LowerBand1 { get; set; }

        [Output("Lower Band 2", Color = Colors.DarkGreen)]
        public IndicatorDataSeries LowerBand2 { get; set; }

        [Output("Lower Band 3", Color = Colors.DarkGreen)]
        public IndicatorDataSeries LowerBand3 { get; set; }

        [Output("Lower Band 4", Color = Colors.DarkGreen)]
        public IndicatorDataSeries LowerBand4 { get; set; }

        [Output("EMA", Color = Colors.Blue)]
        public IndicatorDataSeries Ema { get; set; }

        protected override void Initialize()
        {
            _averageTrueRange = Indicators.GetIndicator<AverageTrueRange>(PeriodAtr);
            _exponentialMovingAverage = Indicators.ExponentialMovingAverage(MarketSeries.Close, PeriodEma);
        }


        public override void Calculate(int index)
        {
            if (!IsRealTime) return;

            for (int i = index - 10; i <= index; i++)
            {
                double ema = _exponentialMovingAverage.Result[index];
                double atr = _averageTrueRange.Result[index];

                UpperBand1[i] = ema + 1.62*atr;
                UpperBand2[i] = ema + 2.62*atr;
                UpperBand3[i] = ema + 4.23*atr;
                UpperBand4[i] = ema + 1*atr;
                LowerBand1[i] = ema - 1.62*atr;
                LowerBand2[i] = ema - 2.62*atr;
                LowerBand3[i] = ema - 4.23*atr;
                LowerBand4[i] = ema - 1*atr;

                Ema[i] = ema;
            }
            for (int i = 0; i < index - 10; i++)
            {
                UpperBand1[i] = double.NaN;
                UpperBand2[i] = double.NaN;
                UpperBand3[i] = double.NaN;
                UpperBand4[i] = double.NaN;
                LowerBand1[i] = double.NaN;
                LowerBand2[i] = double.NaN;
                LowerBand3[i] = double.NaN;
                LowerBand4[i] = double.NaN;

                Ema[i] = double.NaN;
            }

            int xPos = index + 1;
            double yPos = UpperBand1[index];
            string text = String.Format("{0}", Math.Round(yPos, Symbol.Digits));
            ChartObjects.DrawText("obj1", text, xPos, yPos, VerticalAlignment.Top, HorizontalAlignment.Left, Colors.Lime);

            yPos = UpperBand2[index];
            text = String.Format("{0}", Math.Round(yPos, Symbol.Digits));
            ChartObjects.DrawText("obj2", text, xPos, yPos, VerticalAlignment.Top, HorizontalAlignment.Left,
                                  Colors.Yellow);

            yPos = UpperBand3[index];
            text = String.Format("{0}", Math.Round(yPos, Symbol.Digits));
            ChartObjects.DrawText("obj3", text, xPos, yPos, VerticalAlignment.Top, HorizontalAlignment.Left,
                                  Colors.White);

            yPos = UpperBand4[index];
            text = String.Format("{0}", Math.Round(yPos, Symbol.Digits));
            ChartObjects.DrawText("obj4", text, xPos, yPos, VerticalAlignment.Top, HorizontalAlignment.Left, Colors.Red);

            yPos = LowerBand1[index];
            text = String.Format("{0}", Math.Round(yPos, Symbol.Digits));
            ChartObjects.DrawText("obj5", text, xPos, yPos, VerticalAlignment.Top, HorizontalAlignment.Left, Colors.Lime);
            yPos = LowerBand2[index];
            text = String.Format("{0}", Math.Round(yPos, Symbol.Digits));
            ChartObjects.DrawText("obj6", text, xPos, yPos, VerticalAlignment.Top, HorizontalAlignment.Left,
                                  Colors.Yellow);
            yPos = LowerBand3[index];
            text = String.Format("{0}", Math.Round(yPos, Symbol.Digits));
            ChartObjects.DrawText("obj7", text, xPos, yPos, VerticalAlignment.Top, HorizontalAlignment.Left,
                                  Colors.White);
            yPos = LowerBand4[index];
            text = String.Format("{0}", Math.Round(yPos, Symbol.Digits));
            ChartObjects.DrawText("obj8", text, xPos, yPos, VerticalAlignment.Top, HorizontalAlignment.Left, Colors.Red);

            yPos = Ema[index];
            text = String.Format("{0}", Math.Round(yPos, Symbol.Digits));
            ChartObjects.DrawText("obj9", text, xPos, yPos, VerticalAlignment.Top, HorizontalAlignment.Left, Colors.Blue);
        }
    }
}
Consider uploading this as well as the previous indicator to the Indicators section as a courtesy to the rest of the developers community.
Hi Support thanks for getting this done for me so quick, but there is a problem with it building on line 62 screen shot below, I have also altered on lines 12+50 AverageTrueRange to averageTruRange (I did this with the fibonacci bands and it worked) I don't know if its missing some code, the SMA Indicator is constructed slightly differently. I will also upload all 3 of the indicators you have done for me. Thanks
@Scott
Scott
31 Mar 2013, 16:44
RE:
Hello,
I realy like the Ctrader platform, the web base platform is running realy fast on my browser but I have an issue with the download platform (demo account). It runs a bit slow compare to the web base one, it seems that every actions respond with a small delay, the menus don't respond quickly when mouse is over it.
It seems to repond fast when I'm not connected for example on the weekends
My PC specification is :
- Operating System: windows 7 Home Premium
- Processor : Intel(R) Core(TM) i7-2670QM CPU@2.20GHz 2.20 GHz
- Memory Ram : 6.00 GB (5.78 usable)
- System type : 64-bit
- I don't think I get any virus problem (running anti spyware in safemode)
- I have a lot of free Ram and CPU running the ctrader
- All my drivers seem to be update according to microsoft
I install and reinstall the ctrader but the issue persists
My internet speed is around 7 mbps
I realy like the platform but I don't know how to make it run normaly on PC.
Can someone please give me a clue to how to solve this issue?
Thank you in advance.
I've had same problems, I only use the downloaded version of cTrader, also I lose price feed and have to re-subscribe (its say's that the bandwidth connection is slow, I have 62mb) This issue usally occurs when there are price spikes
A lot of the times when I want to enter a trade the buttons dont respond, and some times I have to click a few times to close a possition.
However the platform has been inproving.
PC Desktop 2.8GHz 4GB Ram 1GB Graphics Card, Windows 7 64bit
I think the problem my be my broker, but I fail to see what they gain from this.
@Scott
Scott
01 Mar 2013, 22:14
RE:
Let us know if the code below serves the purpose:
public override void Calculate(int index)
{
    if (!IsRealTime) return;

    for (int i = index - 10; i <= index; i++)
    {
        Result[i] = _simpleMovingAverage1.Result[index];
        Result2[i] = _simpleMovingAverage2.Result[index];
        Result3[i] = _simpleMovingAverage3.Result[index];
        Result4[i] = _simpleMovingAverage4.Result[index];
        Result5[i] = _simpleMovingAverage5.Result[index];
        Result6[i] = _simpleMovingAverage6.Result[index];
        Result7[i] = _simpleMovingAverage7.Result[index];
    }
    for(int i = 0; i < index - 10; i++)
    {
        Result[i] = double.NaN;
        Result2[i] = double.NaN;
        Result3[i] = double.NaN;
        Result4[i] = double.NaN;
        Result5[i] = double.NaN;
        Result6[i] = double.NaN;
        Result7[i] = double.NaN;
    }
    int xPos = index + 6;
    double yPos = _simpleMovingAverage1.Result[index];
    var text = String.Format("{0}", Math.Round(yPos, Symbol.Digits));
    ChartObjects.DrawText("obj1", text, xPos, yPos, VerticalAlignment.Center, HorizontalAlignment.Left,Colors.Lime);

    yPos = _simpleMovingAverage2.Result[index];
    text = String.Format("{0}", Math.Round(yPos, Symbol.Digits));
    ChartObjects.DrawText("obj2", text, xPos, yPos, VerticalAlignment.Bottom, HorizontalAlignment.Left,Colors.Yellow);

    yPos = _simpleMovingAverage3.Result[index];
    text = String.Format("{0}", Math.Round(yPos, Symbol.Digits));
    ChartObjects.DrawText("obj3", text, xPos, yPos, VerticalAlignment.Center, HorizontalAlignment.Left,Colors.White);

    yPos = _simpleMovingAverage4.Result[index];
    text = String.Format("{0}", Math.Round(yPos, Symbol.Digits));
    ChartObjects.DrawText("obj4", text, xPos, yPos, VerticalAlignment.Top, HorizontalAlignment.Left, Colors.Aqua);

    yPos = _simpleMovingAverage5.Result[index];
    text = String.Format("{0}", Math.Round(yPos, Symbol.Digits));
    ChartObjects.DrawText("obj5", text, xPos, yPos, VerticalAlignment.Top, HorizontalAlignment.Left, Colors.Blue);

    yPos = _simpleMovingAverage6.Result[index];
    text = String.Format("{0}", Math.Round(yPos, Symbol.Digits));
    ChartObjects.DrawText("obj6", text, xPos, yPos, VerticalAlignment.Top, HorizontalAlignment.Left,Colors.Orange);

    yPos = _simpleMovingAverage7.Result[index];
    text = String.Format("{0}", Math.Round(yPos, Symbol.Digits));
    ChartObjects.DrawText("obj7", text, xPos, yPos, VerticalAlignment.Top, HorizontalAlignment.Left, Colors.Red);
}
Multi-time frames will be supported in the future.
Thank You Support
Works just like I wanted.
@Scott
Scott
26 Feb 2013, 22:13
RE:
Multi time frames are not currently supported. Furthermore, Moving Averages are not straight lines, therefore we need to understand what formula/logic you want to use to output straight lines.
A straight line is described by two points on the graph. Which points would those be if the moving average is used, the last two values for instance? If the lines are horizontal then one point. Would that be the last value?Regards,
Hi the line would be recalculated for every move so the history of the sma would be wiped out and only the the current price for the sma would be shown ( a bit like fibonacci piviot point indicator ) only dynamic.
I use 4 chart and size them up so I can visulize these values like the example above, I read on the site that you maybe adding mutiple time frames could you confirm that this is on the way?
Also is the a way to have the price over a sma show at the end of the indicator, using lables?
My other idicator that I use is still down I canged it to a chart overlay and it worked but then monday it stop working again, just so you know that fix doesn't seem to be working, I know that you are fixing it with the next releace.
Thanks
@Scott
Scott
25 Feb 2013, 23:24
RE:
Do you mean horizontal lines that pass through the last index value of the sma?
horizontal lines like the example above, I use the SMA as support and restance, 1m 5m 15m 1hr I using the (money map/ tiger lanes / fxgauge / combogrid) system they use 7 levels 21sma 34sma 55sma 75sma 100ma 144sma 233sma (well they use ema but I like using sma instead so I don't get faked out)
so I used the solution to make a sma line caculate as a straight line making it easier to see. When you have added the ability to view mutiple time frames in a single chart I'll be able to replecate this trading tool much better but for now this will do, I have also added the fiboncci bands to chart, so would be wanting to show them as horizontal lines as well.
Heres a link to information about tiger lanes if you scroll down the page you can see what I'm tring to achive http://www.forex-tsd.com/suggestions-trading-systems/1335-dynamic-fibonacci-grid-fx-money-map-21.html
Thanks
@Scott
Scott
22 Feb 2013, 22:59
( Updated at: 21 Dec 2023, 09:20 )
RE:
Hello Scott, could you please post a screenshot of the desired output for the SMA?
Regards
Hi Support, I'm looking for the SMA output to be like the 1m to the right, straight lines
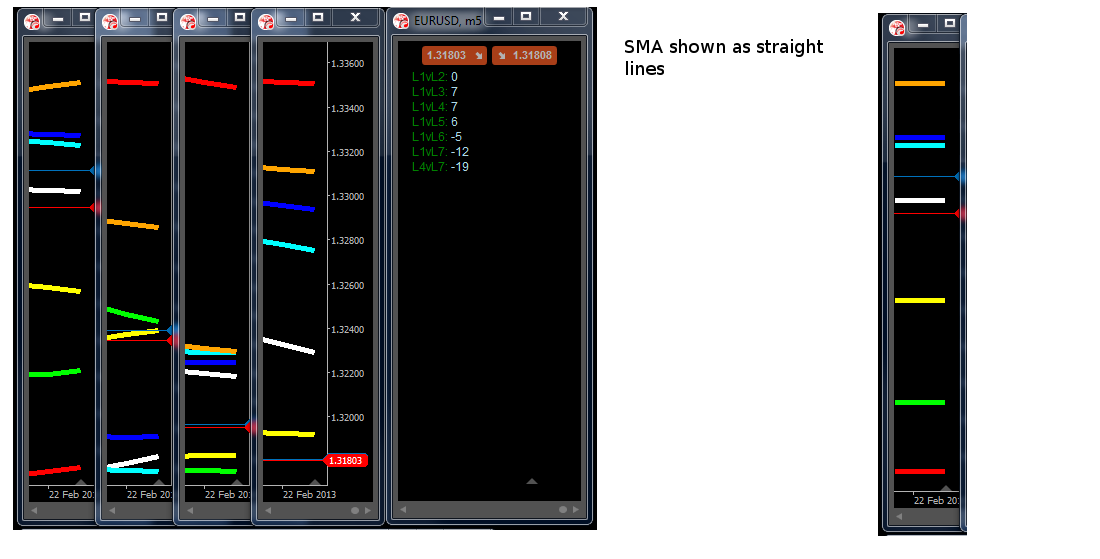
I tried modifying my code so the output looked like this but all the lines went as one.
@Scott
Scott
22 Feb 2013, 21:58
( Updated at: 21 Dec 2023, 09:20 )
RE:
Hi Scott,
We apologize for the inconvenience that this is causing. Please try to use cAlgo for the time being. The next release is soon. We will look at your code even though I suspect it the same issue.
Regards,
Hi Support
Got it working by having it as a overlay on the chart, however there seams to be a problem with USDJPY its not showing the last 3 calculations see below
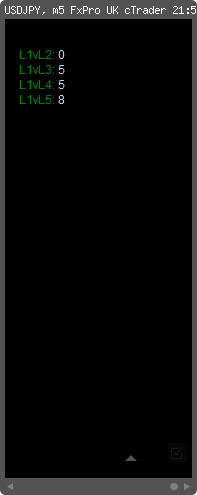
Thanks
@Scott
Scott
21 Feb 2013, 19:16
RE:
Thank you for the suggestion. If you need a horizontal line it is easily implemented by either using the Levels attribute for indicators or setting a constant value to an Outpout Indicator Result, e.g.
        [Output("Main")]
        public IndicatorDataSeries Result { get; set; }

        public override void Calculate(int index)
        {
            Result[index] = 1;
        }
I would like to also have my SMA line displayed as horizontal lines, I have tried to amend my indicator but it just show a line at the bottom of the screen, could you show me how please
My indicator code
using System;
using cAlgo.API;
using cAlgo.API.Indicators;
namespace cAlgo.Indicators
{
[Indicator(IsOverlay = true)]
public class FibGrid7indi : Indicator
{
[Parameter]
public DataSeries Source { get; set; }
[Parameter("L1", DefaultValue = 21)]
public int Periods { get; set; }
[Parameter("L2", DefaultValue = 34)]
public int Periods2 { get; set; }
[Parameter("L3", DefaultValue = 55)]
public int Periods3 { get; set; }
[Parameter("L4", DefaultValue = 75)]
public int Periods4 { get; set; }
[Parameter("L5", DefaultValue = 100)]
public int Periods5 { get; set; }
[Parameter("L6", DefaultValue = 144)]
public int Periods6 { get; set; }
[Parameter("L7", DefaultValue = 233)]
public int Periods7 { get; set; }
[Output("Level1", Color = Colors.Lime, Thickness = 5)]
public IndicatorDataSeries Result { get; set; }
[Output("Level2", Color = Colors.Yellow, Thickness = 5)]
public IndicatorDataSeries Result2 { get; set; }
[Output("Level3", Color = Colors.White, Thickness = 5)]
public IndicatorDataSeries Result3 { get; set; }
[Output("Level4", Color = Colors.Aqua, Thickness = 5)]
public IndicatorDataSeries Result4 { get; set; }
[Output("Level5", Color = Colors.Blue, Thickness = 5)]
public IndicatorDataSeries Result5 { get; set; }
[Output("Level6", Color = Colors.Orange, Thickness = 5)]
public IndicatorDataSeries Result6 { get; set; }
[Output("Level7", Color = Colors.Red, Thickness = 5)]
public IndicatorDataSeries Result7 { get; set; }
private SimpleMovingAverage _simpleMovingAverage1;
private SimpleMovingAverage _simpleMovingAverage2;
private SimpleMovingAverage _simpleMovingAverage3;
private SimpleMovingAverage _simpleMovingAverage4;
private SimpleMovingAverage _simpleMovingAverage5;
private SimpleMovingAverage _simpleMovingAverage6;
private SimpleMovingAverage _simpleMovingAverage7;
protected override void Initialize()
{
_simpleMovingAverage1 = Indicators.SimpleMovingAverage(Source, Periods);
_simpleMovingAverage2 = Indicators.SimpleMovingAverage(Source, Periods2);
_simpleMovingAverage3 = Indicators.SimpleMovingAverage(Source, Periods3);
_simpleMovingAverage4 = Indicators.SimpleMovingAverage(Source, Periods4);
_simpleMovingAverage5 = Indicators.SimpleMovingAverage(Source, Periods5);
_simpleMovingAverage6 = Indicators.SimpleMovingAverage(Source, Periods6);
_simpleMovingAverage7 = Indicators.SimpleMovingAverage(Source, Periods7);
}
public override void Calculate(int index)
{
Result[index] = _simpleMovingAverage1.Result[index];
Result2[index] = _simpleMovingAverage2.Result[index];
Result3[index] = _simpleMovingAverage3.Result[index];
Result4[index] = _simpleMovingAverage4.Result[index];
Result5[index] = _simpleMovingAverage5.Result[index];
Result6[index] = _simpleMovingAverage6.Result[index];
Result7[index] = _simpleMovingAverage7.Result[index];
}
}
}
@Scott
Scott
21 Feb 2013, 17:20
RE:
We have identified an issue with cTrader and are currently working on a solution which should be available in the next release. cAlgo is working properly though.
Regards,
How long till the next relase? Is there no fix for now?, below is the code for my indicator Pip Levels
using System;
using cAlgo.API;
using cAlgo.API.Indicators;
using cAlgo.Indicators;
namespace cAlgo.Indicators
{
[Indicator(IsOverlay = false)]
public class PipLevels : Indicator
{
//-----------------------------------------------------------------
[Parameter]
public DataSeries Source { get; set; }
[Parameter(DefaultValue = 21)]
public int PeriodMA1 { get; set; }
[Parameter(DefaultValue = 34)]
public int PeriodMA2 { get; set; }
[Parameter(DefaultValue = 21)]
public int PeriodMA3 { get; set; }
[Parameter(DefaultValue = 55)]
public int PeriodMA4 { get; set; }
[Parameter(DefaultValue = 21)]
public int PeriodMA5 { get; set; }
[Parameter(DefaultValue = 75)]
public int PeriodMA6 { get; set; }
[Parameter(DefaultValue = 21)]
public int PeriodMA7 { get; set; }
[Parameter(DefaultValue = 100)]
public int PeriodMA8 { get; set; }
[Parameter(DefaultValue = 21)]
public int PeriodMA9 { get; set; }
[Parameter(DefaultValue = 144)]
public int PeriodMA10 { get; set; }
[Parameter(DefaultValue = 21)]
public int PeriodMA11 { get; set; }
[Parameter(DefaultValue = 233)]
public int PeriodMA12 { get; set; }
[Parameter(DefaultValue = 75)]
public int PeriodMA13 { get; set; }
[Parameter(DefaultValue = 233)]
public int PeriodMA14 { get; set; }
//-----------------------------------------------------------------
private Position position;
private SimpleMovingAverage sma1;
private SimpleMovingAverage sma2;
private SimpleMovingAverage sma3;
private SimpleMovingAverage sma4;
private SimpleMovingAverage sma5;
private SimpleMovingAverage sma6;
private SimpleMovingAverage sma7;
private SimpleMovingAverage sma8;
private SimpleMovingAverage sma9;
private SimpleMovingAverage sma10;
private SimpleMovingAverage sma11;
private SimpleMovingAverage sma12;
private SimpleMovingAverage sma13;
private SimpleMovingAverage sma14;
private double L1vL2;
private double L1vL3;
private double L1vL4;
private double L1vL5;
private double L1vL6;
private double L1vL7;
private double L4vL7;
//-----------------------------------------------------------------
protected override void Initialize()
{
sma1 = Indicators.SimpleMovingAverage(Source,PeriodMA1);
sma2 = Indicators.SimpleMovingAverage(Source,PeriodMA2);
sma3 = Indicators.SimpleMovingAverage(Source,PeriodMA3);
sma4 = Indicators.SimpleMovingAverage(Source,PeriodMA4);
sma5 = Indicators.SimpleMovingAverage(Source,PeriodMA5);
sma6 = Indicators.SimpleMovingAverage(Source,PeriodMA6);
sma7 = Indicators.SimpleMovingAverage(Source,PeriodMA7);
sma8 = Indicators.SimpleMovingAverage(Source,PeriodMA8);
sma9 = Indicators.SimpleMovingAverage(Source,PeriodMA9);
sma10 = Indicators.SimpleMovingAverage(Source,PeriodMA10);
sma11 = Indicators.SimpleMovingAverage(Source,PeriodMA11);
sma12 = Indicators.SimpleMovingAverage(Source,PeriodMA12);
sma13 = Indicators.SimpleMovingAverage(Source,PeriodMA13);
sma14 = Indicators.SimpleMovingAverage(Source,PeriodMA14);
}
//-----------------------------------------------------------------
public override void Calculate(int index)
{
string L1vL2 = " " + Math.Round((sma1.Result[index] - sma2.Result[index]) / Symbol.PipSize,0);
string L1vL3 = "\n " + Math.Round((sma3.Result[index] - sma4.Result[index]) / Symbol.PipSize,0);
string L1vL4 = "\n\n " + Math.Round((sma5.Result[index] - sma6.Result[index]) / Symbol.PipSize,0);
string L1vL5 = "\n\n\n " + Math.Round((sma7.Result[index] - sma8.Result[index]) / Symbol.PipSize,0);
string L1vL6 = " " + Math.Round((sma9.Result[index] - sma10.Result[index]) / Symbol.PipSize,0);
string L1vL7 = "\n " + Math.Round((sma11.Result[index] - sma12.Result[index]) / Symbol.PipSize,0);
string L4vL7 = "\n\n " + Math.Round((sma13.Result[index] - sma14.Result[index]) / Symbol.PipSize,0);
ChartObjects.DrawText("Labels",
"L1vL2:" + "\n"
+ "L1vL3:" + "\n"
+ "L1vL4:" + "\n"
+ "L1vL5:" + "\n"
, StaticPosition.TopLeft, Colors.Green);
ChartObjects.DrawText("Labels2",
"L1vL6:" + "\n"
+ "L1vL7:" + "\n"
+ "L4vL7:" + "\n"
, StaticPosition.TopCenter, Colors.Green);
ChartObjects.DrawText("L1vL2", L1vL2, StaticPosition.TopLeft, Colors.LightBlue);
ChartObjects.DrawText("L1vL3", L1vL3, StaticPosition.TopLeft, Colors.LightBlue);
ChartObjects.DrawText("L1vL4", L1vL4, StaticPosition.TopLeft, Colors.LightBlue);
ChartObjects.DrawText("L1vL5", L1vL5, StaticPosition.TopLeft, Colors.LightBlue);
ChartObjects.DrawText("L1vL6", L1vL6, StaticPosition.TopCenter, Colors.LightBlue);
ChartObjects.DrawText("L1vL7", L1vL7, StaticPosition.TopCenter, Colors.LightBlue);
ChartObjects.DrawText("L4vL7", L4vL7, StaticPosition.TopCenter, Colors.LightBlue);
}
}
}
Really like the new platform being able to execute all my open possitions at once is going to add to my profit, it all ready has good work.
@Scott
Scott
21 Feb 2013, 14:30
( Updated at: 19 Mar 2025, 08:57 )
RE:
Thank you. You need to send us an email to support@ctrader.com and let us know which cAlgo you are using (from Top Menu -> Help -> About cAlgo)
Hi I'm using Ver: 1.0.24 cAlgo, I not using the indicators as a robot just trading with them in cTrader, the indicators are not working in both though.
@Scott
Scott
21 Apr 2013, 22:33
RE:
I would also like to be able to do this for the fractional pip
yPos = _simpleMovingAverage2.Result[index];
text = String.Format("{0}", Math.Round(yPos, Symbol.Digits));
ChartObjects.DrawText("obj2", text, xPos, yPos, VerticalAlignment.Bottom, HorizontalAlignment.Left,Colors.Yellow);
@Scott