Topics
Replies
intraflay
07 Mar 2022, 16:21
( Updated at: 21 Dec 2023, 09:22 )
RE:
bugazzza said:
I'm getting error when I'm trying to do a chartshot.
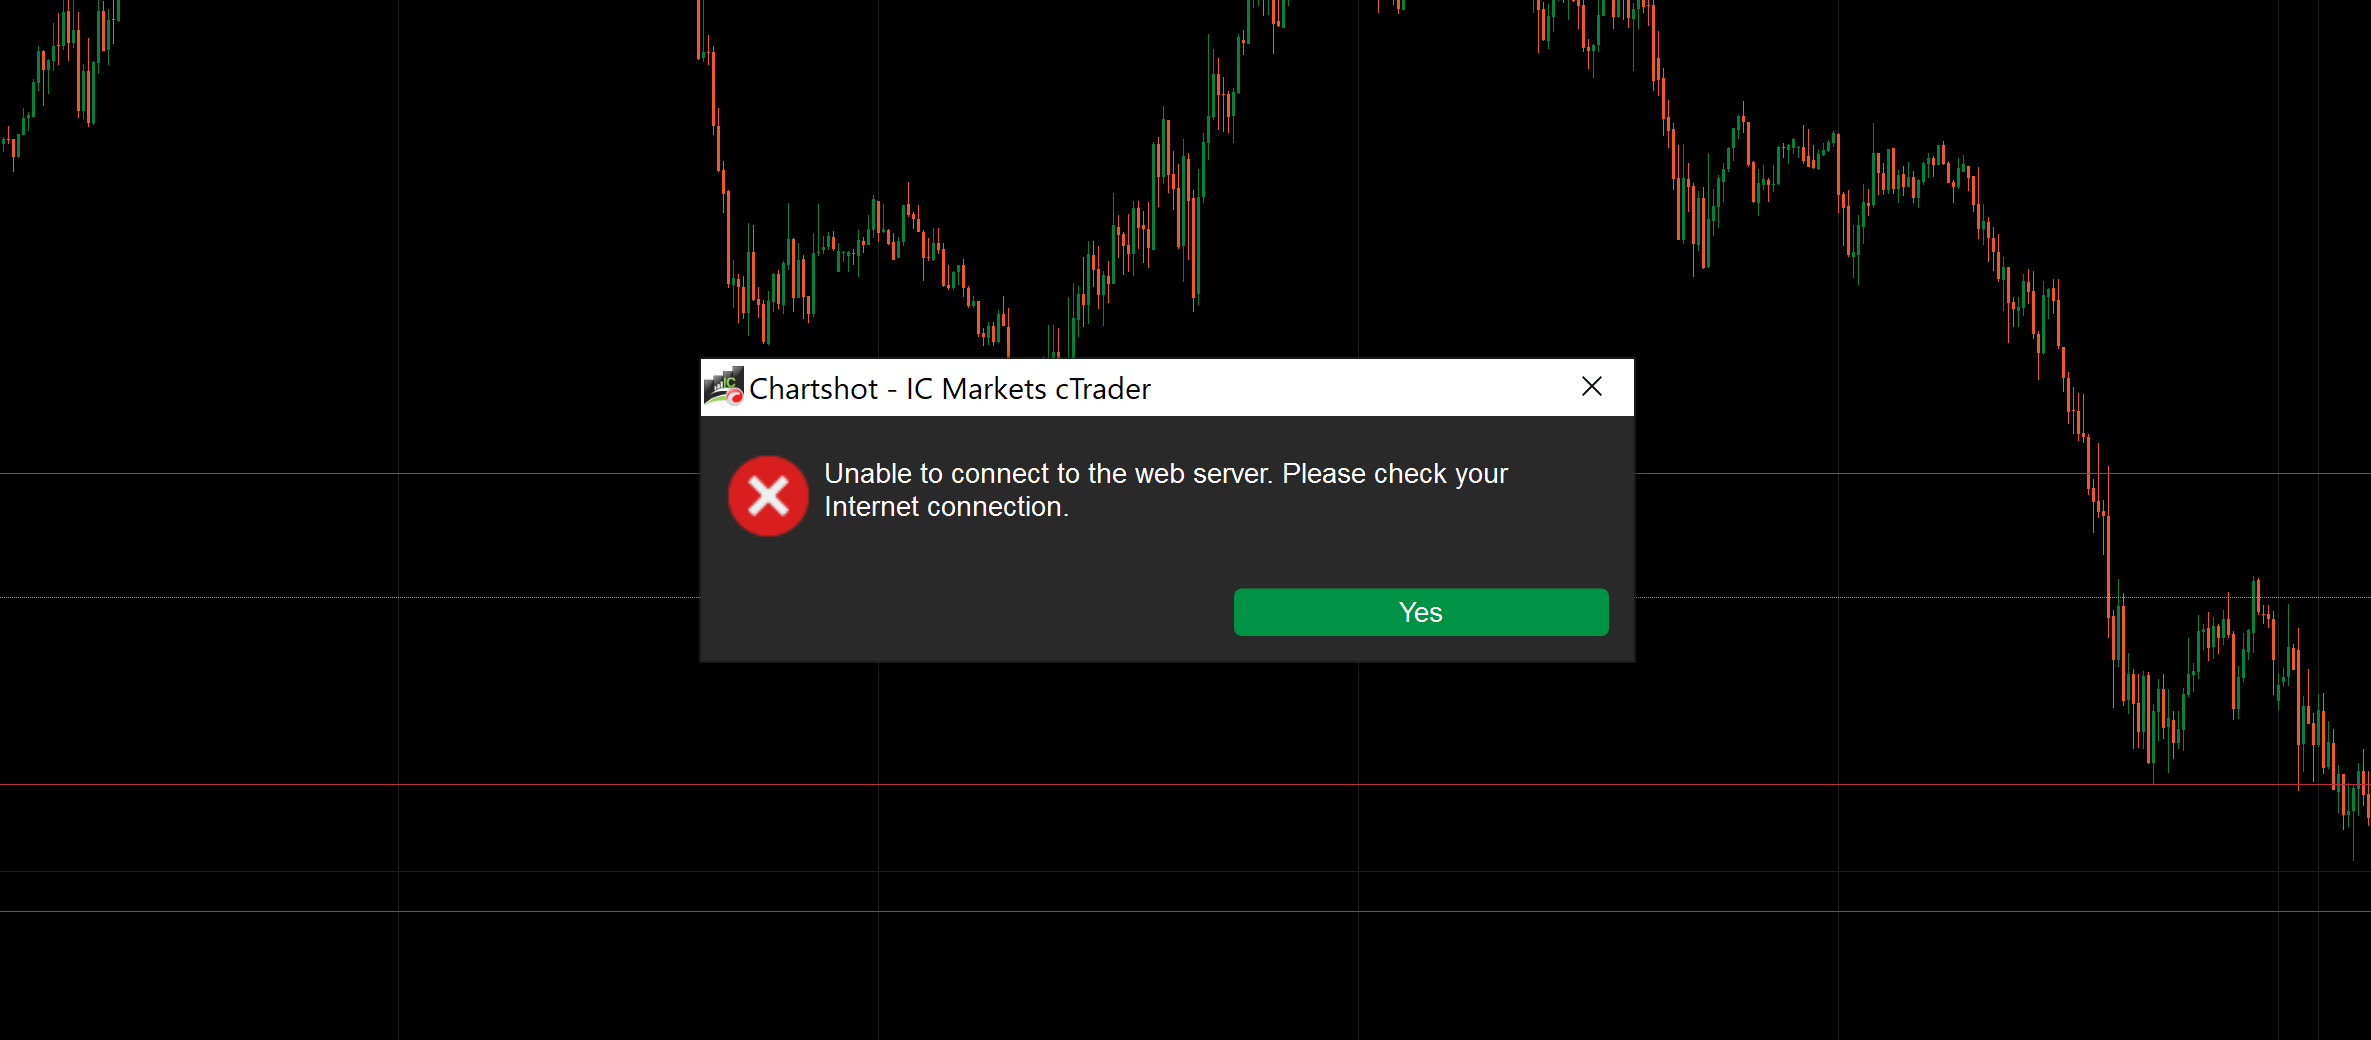
Same here, just came on to post about it too. Internet fine, can enter and exit positions fine too. Also worth noting that it doesn't even save the chart shots locally....
@intraflay
intraflay
18 Feb 2022, 03:07
RE:
PanagiotisCharalampous said:
Hi darekbok0,
There is a known issue with iOS notifications. It will be fixed soon.
Best Regards,
Panagiotis
Any idea when? It’s been like it for weeks now ????
Thanks
@intraflay
intraflay
08 Feb 2022, 15:18
Giving this a bump as getting so frustrating and missing out on opportunities because of this. Also another post has been created since requesting the same thing.
Is this something that can be looked at please? Even if we can set quick trade settings linked to a template would be okay! Any which way, how, I don't care. But to only have one setting covering so many different products just does not work!
Please! Thank you
@intraflay
intraflay
19 Jul 2021, 14:58
( Updated at: 19 Jul 2021, 15:23 )
RE: RE: RE: RE: RE: RE: RE: RE: RE:
andres.gomez1013 said:
Ok ok ok, thnaks, next comment pls....
Yes please, I’d like to see someone else comment and confirm that you have no idea what you’re talking about. You’re so rude it’s unbelievable! I’ve been trading since 2001. You’re wrong. And maybe, just maybe if you let your ridiculous ego go for a second and took others’ experience and advice on board, you’d learn. But with your attitude, you’ll never make it. Ego and the markets don’t mix. Adiós, twat.
@intraflay
intraflay
19 Jul 2021, 14:50
( Updated at: 19 Jul 2021, 15:23 )
RE: RE: RE: RE: RE: RE: RE:
andres.gomez1013 said:
How frustaded you could be to send hate in a trading forum? well... i guess that we have the best example here with this guy. if your life is not so well and maybe you lose a lot of money in this world sorry for you mate, but stop writing here your opinion is not what im looking for and i feel that is not relevant. bye
I wasn’t sending hate, I was trying to HELP YOU. For nothing! And it is VERY relevant! As I said…. Lack of knowledge is your issue. But you just couldn’t accept that. Learn about pips. Learn about the bid / ask and what price triggers certain orders. And good luck with your trading. You need it.
@intraflay
intraflay
19 Jul 2021, 14:37
( Updated at: 19 Jul 2021, 15:23 )
RE: RE: RE: RE: RE:
andres.gomez1013 said:
Lak of knowledge you said, look the graphic is H1 the price was in 1.08209 and the spread opens the order in 1.08405 and you said that is 10pips? LOL you are the person that have lack of knowledge, get out of here if you are not going to comment something useful and more when you dont know anything about .it
1.08209 - 1.08405 is 19.6 pips mate. 19.6 pips! Not “200” like you said in the beginning. And I said 10 pips because in your last reply, you said 100 pips.
And if you knew what you were doing, you’d 1) know that, and 2) wouldn’t be on here asking embarrassing questions saying “the spread is damage”
It’s you that’s damaged. Not the spread. Saying “price didn’t get to there” hahahaha. As I said… lack of knowledge on the bid / ask!
But anyway.. I gave my time to help and did offer something useful. You’re just too ignorant to consider the fact that the problem is down to your lack of knowledge. I was very respectful when I said the issue was down to you to try to help you and stop you from losing more money. But seeing as you want to be a rude idiot, crack on as you are!! “200 pips” L O L
@intraflay
intraflay
19 Jul 2021, 14:09
( Updated at: 19 Jul 2021, 15:23 )
RE: RE: RE:
andres.gomez1013 said:
I placed an order overnight but i didnt expected this kind of issue, do you know if CTRADER have a support that can chekc this issue and return money or at least review what happened? We are talking about a spread of more than 100 pips that not fare at all and need to be fix.
That’s not 100 pips, that’s 10 pips mate. And during news events / at certain low volume times, the spread could easily widen to that. But u need to speak with your broker. Nothing to do with cTrader. But to be honest, with respect, it’s happened down to a lack of knowledge from yourself and how spreads work and how the bid / ask trigger orders rather than an issue with your broker or the cTrader software.
@intraflay
intraflay
15 Jul 2021, 16:27
RE:
intraflay said:
As per the title - can not open cTrader (downloaded through IC Markets) today whatsoever.
I have never had this issue in the last 18 months. I have uninstalled and reinstalled it, but still no joy. I have also done a full virus check of my system.
There was a windows 10 update I installed last night, which I will list the details of below.
Any idea what is going on here please? Super frustrating!
FYI I do have an MetaTrader account with IC Market also, which I can open and is running absolutely fine - so it's definitely a cTrader related issue as opposed to an issue solely with IC Markets.
WINDOWS UPDATE DETAILS:
Please help! Thanks
An update on this for the tech dept…. It was the above windows 10 update which was causing the problem. On uninstalling the update, it opens and works as it should.
Maybe something to be aware of!
@intraflay
intraflay
15 Jul 2021, 15:53
( Updated at: 21 Dec 2023, 09:22 )
RE:
andres.gomez1013 said:
Anyone else is seeing this on the orders?
Basically i put a buy limit order on EURCHF with entry price at 1.08443 the price was at 1.08209 more than 200pips down of my order, but for some reason the spread was damage for a minute and the line touch my entry point but the price dont show, making a worng order and losing money without the price touching my target, i need to review this thing becaus ethis happen to me before and its really annonying to see how you lose money for an error in the app, i need help to review this ASAP. here is the evidence.
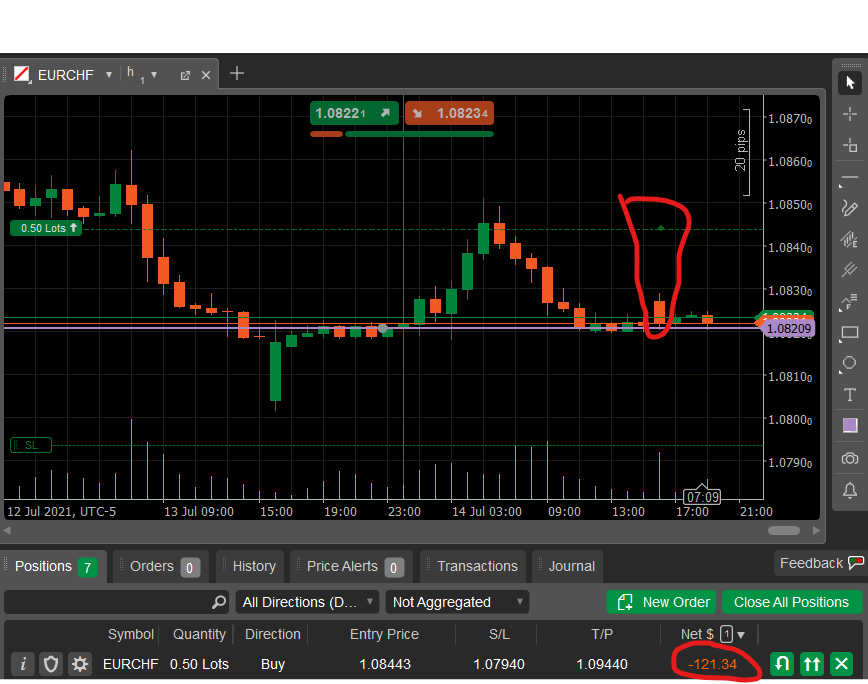
Have never had this issue. You leaving those orders there either 1) in times of extreme volatility? ie big news events, or 2) overnight when the spreads widen ???
@intraflay
intraflay
22 Mar 2021, 12:09
RE:
PanagiotisCharalampous said:
Hi intraflay,
Okay, thanks - does this not constitute a great demand for it?? It is pretty clear there are a lot of people who dislike it.
I counted five people in this thread and around 20 votes on the Telegram group. It much less than the people that actually wanted this change.
But if not, where and when should us unhappy users voice the desire for a choice to be implemented?
Post a suggestion and get some votes.
Best Regards,
Panagiotis
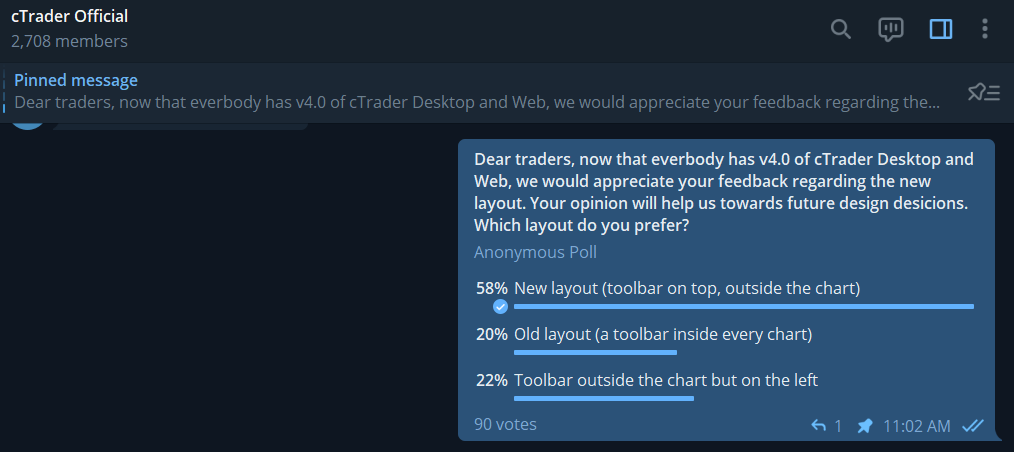
Okay thanks - I am in the telegram group too, 90 votes, 52 like 4.0, the remaining 38 either want it as before inside the chart, or on the left hand side outside of the chart (which would also satisfy those who "wanted it as before") Inside, outside, don't really care - it's them being on the left that matters to those who are unhappy I think! So, I make that at least 43 who would like them on the left again :D Not being awkward, just saying! haha :)
@intraflay
intraflay
22 Mar 2021, 11:40
( Updated at: 23 Jan 2024, 13:14 )
RE:
PanagiotisCharalampous said:
Hi intraflay,
This change was requested [here] and has gathered 158 votes. Having multiple layout options could be considered if the feature has a similar demand. Adding options only complicates the software maintenance process, so we only consider them if they are justified by user demand.
Best Regards,
Panagiotis
Okay, thanks - does this not constitute a great demand for it?? It is pretty clear there are a lot of people who dislike it. But if not, where and when should us unhappy users voice the desire for a choice to be implemented?
It's such a shame - It's been a week with it and it just does not work well at all (for those who had a big enough monitor in the first place anyway). As I say, I've had to zoom to 110% to stop me clicking on the wrong things so often and to make the tabbed charts actually display the timeframe open correctly without having the bottom half of the numbers chopped off. It's pretty bad! And by zooming in like this, I've lost chart space haha.
Ah well - said my piece, think it was a very bad move. It's clearly not going to get changed back is it. I'll just have to try to get used to it or move back to MT5/TradingView combo, which would be a pity because I like(d) cTrader a lot.
Thanks for your time anyway.
@intraflay
intraflay
22 Mar 2021, 11:19
( Updated at: 21 Dec 2023, 09:22 )
RE:
PanagiotisCharalampous said:
Hi ctraderftmo+115,
So now users of CTrader have to 'off site' to telegram, and sign up to another unwanted app to vote for an unwanted change? What is this forum for?
Telegram is a much more appropriate tool to quantify such a feedback and this is the reason we are holding polls there. This change was requested by traders and based on the Telegram poll 58% of users that voted, endorse this change. Out of the 2708 members of the Telegram group only 18 have explicitly stated that they prefer the previous version.
Best Regards,
Panagiotis
My above reply posted twice for some reason, so just deleted this text body.
@intraflay
intraflay
22 Mar 2021, 11:18
( Updated at: 21 Dec 2023, 09:22 )
RE:
PanagiotisCharalampous said:
Hi ctraderftmo+115,
So now users of CTrader have to 'off site' to telegram, and sign up to another unwanted app to vote for an unwanted change? What is this forum for?
Telegram is a much more appropriate tool to quantify such a feedback and this is the reason we are holding polls there. This change was requested by traders and based on the Telegram poll 58% of users that voted, endorse this change. Out of the 2708 members of the Telegram group only 18 have explicitly stated that they prefer the previous version.
Best Regards,
Panagiotis
I’m guessing the telegram community (which I did not even know existed until you posted the poll link) is also where the people who requested the changes from in the first place, so those results don’t surprise me. On here, both in answer to this thread I created and from looking around at separate individuals posts, everyone seems to clearly be of the opinion that they do not like the new version.
Is having the two options on there in future out of the question? I don’t see why it should be so difficult?? We have driverless cars and can put a man on the moon, but two layout templates?.. phwoarrrrrrrr. I’m playing around a bit and being silly, but you get my point? It’s got to be simple to do, surely. People should have the choice. Make everyone happy, why not!?
Cannot stand this layout. Have had to zoom the view in to 110% which is ugly as hell just to help prevent all the miss-clicks, which ironically has reduced my chart space, lol. And that’s on a 49” ultra wide monitor. And no offence to these people, but even on my 23” monitor the space saved on the charts is hardly mind blowing. Maybe those voting for this ugly, clunky, horrible-to-work-with layout just need to buy a bigger monitor! Probably mostly demo traders trading from a 13” laptop.
Moving things around without giving the user the option to put them back to where they were (back to where they were used to them being) was a terrible idea, I’m sorry. Panagiotis, please, the question has been asked a lot - do you know if it MAY be possible for a future update for the developers to add the option for us who do not like this to use the old layout? Or
is it 100% out of the question? Thanks
@intraflay
intraflay
18 Mar 2021, 20:17
RE:
robcov0 said:
Along with the upgrades included in Ctrader 4 there are several down grades.
If the tool bar is continually being moved around from 1 version to another, at least make it customizable by the user.
Being able to pick and choose which buttons to have and where on the screen we want it located would be a sensible addition.
In addition, not having a clear display of which workspace is current without having to hover over a button to identify runs risk of unwanted changes being made in incorrect work spaces.
The vacant space at the top of the screen between account details and the new tool bar location could possibly house the right hand tool bar, giving that extra little bit of chart space on the right.
Especially as the chart time denominations show a max of 10 options plus the 3 dots for expanding the selections. This prevents the tool bar from encroaching on the unused space in which the second tool bar could be placed.
It's also disappointing to see that a broader selection of, or variable Tick chart denominations has been omitted once again.
Exactly everything I said a couple of days ago - along with a lot of other people now by the looks of it. Might cast a vote haha
@intraflay
intraflay
18 Mar 2021, 20:16
RE:
eddyfursy said:
This morning i woke up to the new ctrader 4.0 update and once done, i was devastated! My mind now has to readjust to your new dispositions. If i want to change a timeframe now i have to look up instead of up left in the chart window and please imagine i have 10 differents charts in my layout and want to change each of their timeframes. Couldn't be a way of changing a group of charts timeframe at once without having to do the 1 by 1 torture? Please help make our lives easy.
Yep... said the same, as have a lot of others by the looks of it!
@intraflay
intraflay
17 Mar 2021, 11:59
RE:
smoothgeek2016 said:
Please can you fix the "apply as default settings?" it does not work. For example, if I use a lighter shade for a rectangle object and check the "apply as default for rectangle". The setting apply to all objects and it is highly frustrating.
Alternatively, you can add the object toolbar feature on the desktop version for easy modification of objects.
Please look into this. It is disturbing to manually change the colour of an object everytime.
Tell me about it. Been like it forever, mentioned a million times. Don't know why the default box is even there - it doesn't work! 4.0, still the same. Mental.
@intraflay
intraflay
17 Mar 2021, 11:10
( Updated at: 17 Mar 2021, 11:19 )
RE:
PanagiotisCharalampous said:
Hi intraflay,
Thanks for your feedback. Moving the buttons outside the chart was a request of many traders in order to create more space for the charts. It was a very popular request.
Best Regards,
Panagiotis
But now, although some space may have been gained horizontally, that same space has been lost on the vertical axis! Obviously different people trade in different ways, and on different setups in terms of monitor(s) size etc.. But like the above comment made by Marcel, it was so much cleaner and clearer before, and really worked better in that way in my opinion. I'm sure a lot of traders working from tiny screens trading part time may find it helpful having it at the top, but for those of us with large monitors who are sat in front of them for hours a day - especially those who flick between different time frames very regularly, it really doesn't work well with them at the top at all.
Is it not possible to have two "template styles"?? Just as you have a dark and light version? A "Classic" layout and "New 4.0" layout for example?
I appreciate there may have been many requests to move them to the top, but what about the traders who liked them where they were? You have to consider the fact too that people would be likely to request to MOVE them if they thought it would work better with them there, but you would not get requests to KEEP them where they were from all of those who were perfectly happy with their placement on the side. Know what I mean? People often request change - but don't praise or ask for a particular feature to never be changed.
Personally, I also trade with the side menu collapsed for the most part, which means there is space to have the time periods in that huge empty space between the "analyze" and "partner" boxes.
Really gutted about this change. It looks so clunky and messy, and the chart period boxes also seem much smaller and require more care and attention when clicking them. Already a few mis-clicks have meant me switching to a different tabbed chart when trying to change timeframe on the current chart, as they're right underneath, grr.
Could that be an option? - To have a classic template option put in for us?
@intraflay
intraflay
04 Mar 2021, 14:05
( Updated at: 21 Dec 2023, 09:22 )
RE:
PanagiotisCharalampous said:
Hi intraflay,
I tried this and looks fine to me
Can you try scrolling back the chart so that all the h1 data is loaded? Let me know if this fixes the issue
Best Regards,
Panagiotis
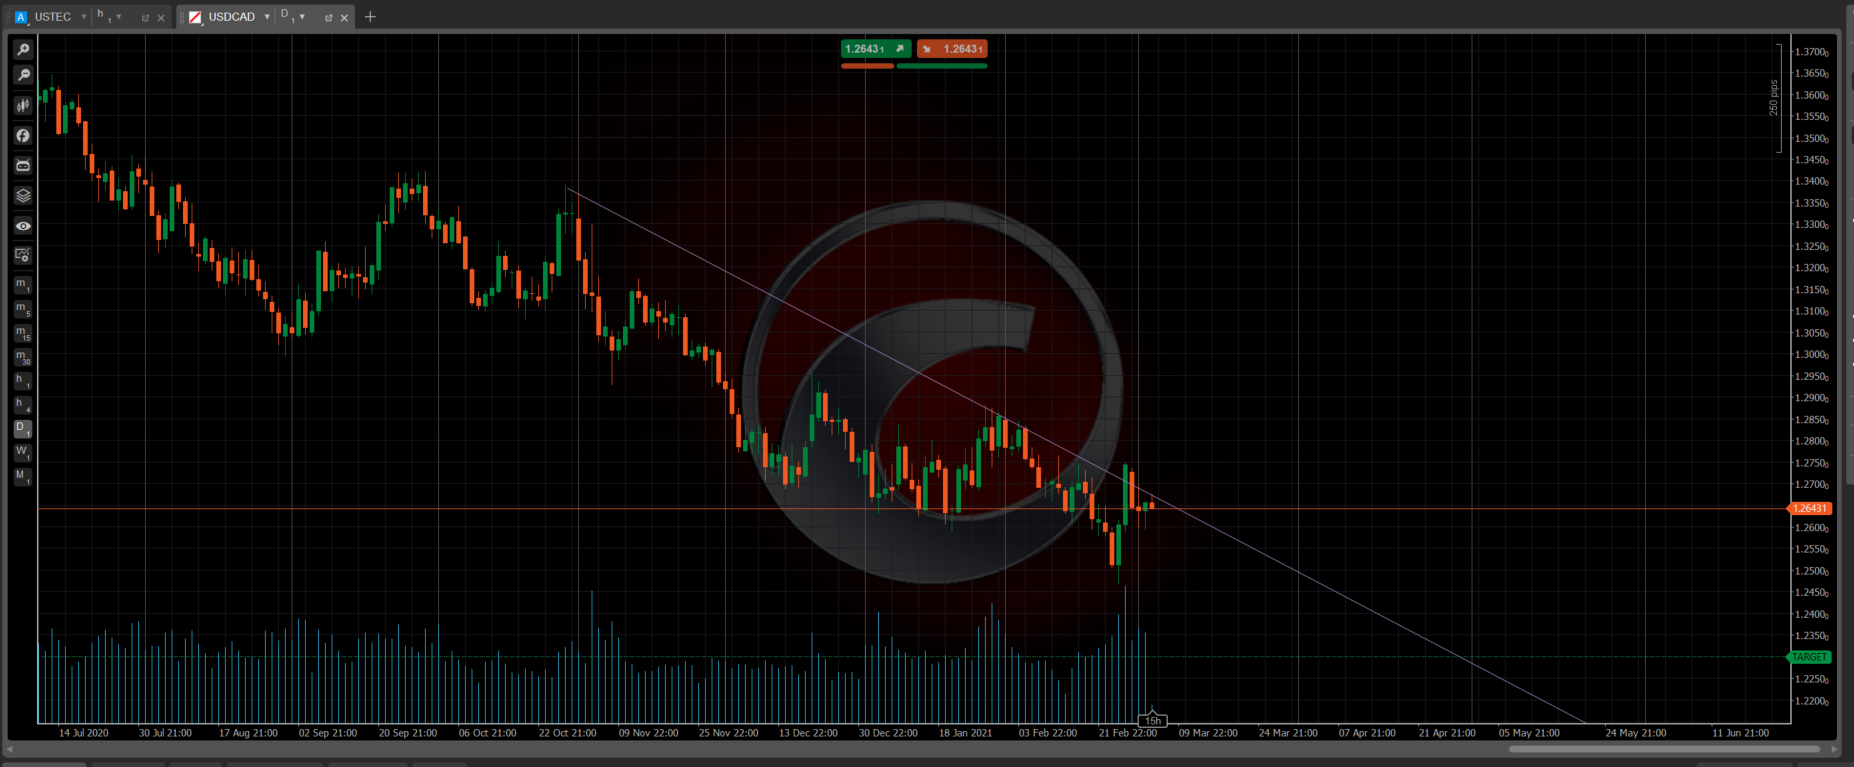
Hi - thanks for looking into it. But unfortunately, no! I have scrolled back as far as 2014 on the hourly and still, it does the same thing. Have opened a new chart and tried from fresh but still, same problem. Also tried it on 2 other pairs and have the same issue. I have also drawn the same trend line in terms of length etc, but on the hourly chart.. and then when I switch to the daily timeframe, that same trend line is way above the price points which I had drawn it based upon.
@intraflay
intraflay
03 Mar 2021, 17:15
( Updated at: 21 Dec 2023, 09:22 )
RE: RE:
intraflay said:
PanagiotisCharalampous said:
Hi intraflay,
Could you share some screenshots of what you are looking at? Make sure we can see the broker, symbol and timeframe.
Best Regards,
Panagiotis
Sure - have just taken two chart shots on the platform. Broker is IC Markets

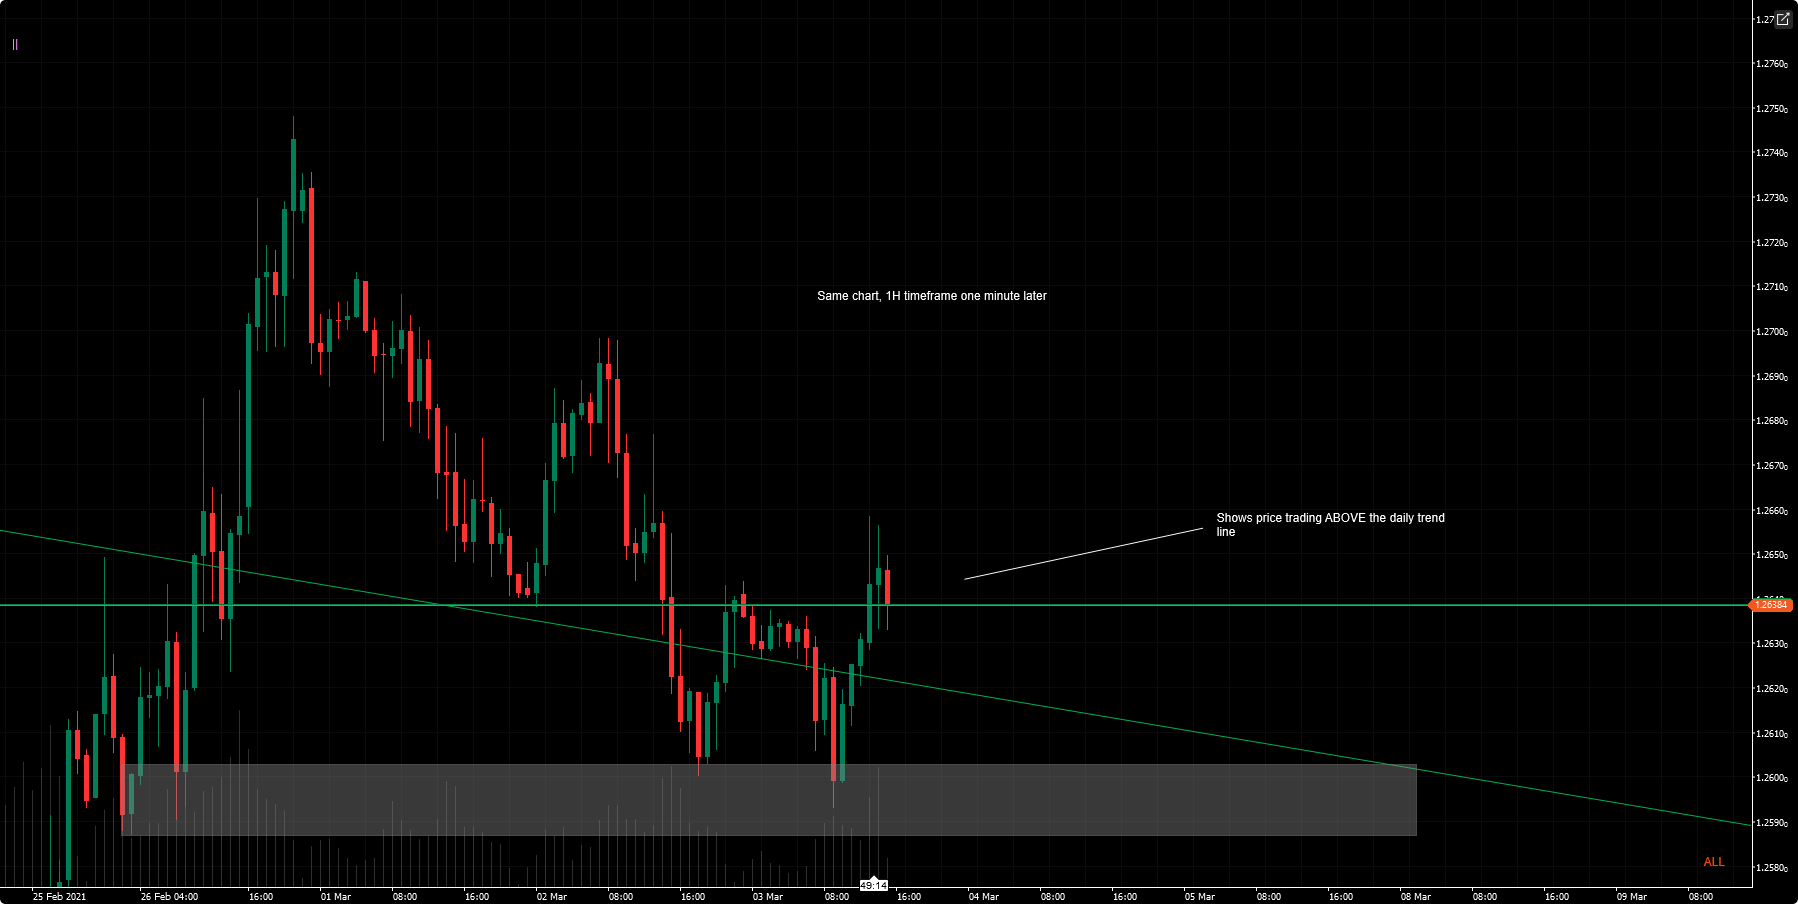
Oh and this is USDCAD as described in my first post... but FYI it does the same thing no matter what the symbol is.
@intraflay
intraflay
05 Oct 2022, 17:07
RE:
Thanks for the reply! Really? Could this not be implemented? Would be a very nice feature to have and save a lot of faffing around.
PanagiotisCharalampous said:
@intraflay