Two indicators in one window

Two indicators in one window
10 May 2013, 14:58
Hi All!
Is it possible to place two or more indicators in one indicator window? Now i look the situation when eash indicator takes own separate window on bottom of chart.
Replies
cAlgo_Fanatic
13 May 2013, 10:06
You may create a custom indicator that references the two indicators and plots their results. e.g.
    [Indicator(IsOverlay = false, ScalePrecision = 5)]
    public class twoIndicators : Indicator
    {
    	StandardDeviation standDev;
    	HistoricalVolatility histVolatility;


        [Output("StandardDeviation")]
        public IndicatorDataSeries Result { get; set; }

        [Output("HistoricalVolatility")]
        public IndicatorDataSeries Result2 { get; set; }

        protected override void Initialize()
        {
            // Initialize and create nested indicators
            standDev = Indicators.StandardDeviation(MarketSeries.Close, 14, MovingAverageType.Simple);
            histVolatility = Indicators.HistoricalVolatility(MarketSeries.Close, 20, 262);
        }

        public override void Calculate(int index)
        {
            // Calculate value at specified index
             Result[index] = standDev.Result[index];
             Result2[index] = histVolatility.Result[index];

        }
@cAlgo_Fanatic
jeffmichaels
19 Feb 2014, 13:30
Hello,
Im looking at switching to cTrader but to my surprise this is not possible. I have a system with 3 stochastics in one window and 5 ADX in another.
If someone could point me in the right direction how to call 2 ADX in 1 window i can probably do the rest myself. Im not really a programmer but i could get tweaks done in MQL.
using System;
using cAlgo.API;
using cAlgo.API.Indicators;

namespace cAlgo.Indicators
{
    [Indicator(IsOverlay = false)]
    public class ADXR : Indicator
    {
        [Parameter(DefaultValue = 14)]
        public int interval { get; set; }

        [Output("ADXR", Color = Colors.Turquoise)]
        public IndicatorDataSeries adxr { get; set; }

        [Output("DiMinus", Color = Colors.Red)]
        public IndicatorDataSeries diminus { get; set; }

        [Output("DiPlus", Color = Colors.Blue)]
        public IndicatorDataSeries diplus { get; set; }

        private DirectionalMovementSystem adx;
        protected override void Initialize()
        {
            adx = Indicators.DirectionalMovementSystem(interval);
        }

        public override void Calculate(int index)
        {
            adxr[index] = (adx.ADX[index] + adx.ADX[index - interval]) / 2;
            diminus[index] = adx.DIMinus[index];
            diplus[index] = adx.DIPlus[index];
        }
    }
}
Im looking to have a 7,21,42,89, and 144 ADX in one window, preferably wthout DI+ & DI- being visible.
@jeffmichaels
Spotware
19 Feb 2014, 17:39
Please look at the following example:
using System;
using cAlgo.API;
using cAlgo.API.Internals;
using cAlgo.API.Indicators;

namespace cAlgo.Indicators
{
    [Indicator(IsOverlay = false, TimeZone = TimeZones.UTC)]
    public class AdxR : Indicator
    {
        [Output("adx 7", Color = Colors.Blue)]
        public IndicatorDataSeries Adx7 { get; set; }

        [Output("adx 21", Color = Colors.Yellow)]
        public IndicatorDataSeries Adx21 { get; set; }

        [Output("adx 42", Color = Colors.Red)]
        public IndicatorDataSeries Adx42 { get; set; }

        private DirectionalMovementSystem _dms7;
        private DirectionalMovementSystem _dms21;
        private DirectionalMovementSystem _dms42;

        protected override void Initialize()
        {
            _dms7 = Indicators.DirectionalMovementSystem(7);
            _dms21 = Indicators.DirectionalMovementSystem(21);
            _dms42 = Indicators.DirectionalMovementSystem(42);
        }

        public override void Calculate(int index)
        {
            Adx7[index] = _dms7.ADX[index];
            Adx21[index] = _dms21.ADX[index];
            Adx42[index] = _dms42.ADX[index];
        }
    }
}
There are 3 ADX lines in the same panel.
@Spotware
jeffmichaels
21 Feb 2014, 14:39
So i managed to build on your code and now have the 5 ADX in 1 window.
Trying to do the same myself now for 3 stochastics in 1 window, but to no avail. Im not a coder, im fine tweaking stuff but cant seem to get this done.
Any help would be appreciated. I like the lightness of ctrader but i need my MT4 system if i want to switch
using System;
using cAlgo.API;
using cAlgo.API.Internals;
using cAlgo.API.Indicators;

namespace cAlgo.Indicators
{
    [Indicator(IsOverlay = false, TimeZone = TimeZones.UTC)]
    public class AdxR : Indicator
    {
        [Output("Slow", Color = Colors.Yellow)]
        public IndicatorDataSeries _stochasticslow { get; set; }

        [Output("Medium", Color = Colors.Red)]
        public IndicatorDataSeries _stochasticmedium { get; set; }

        [Output("Fast", Color = Colors.Blue)]
        public IndicatorDataSeries _stochasticfast { get; set; }

        private StochasticOscillator _stochasticslow;
        private StochasticOscillator _stochasticmedium;
        private StochasticOscillator _stochasticsfast;


        protected override void OnStart
        {
               _stochasticslow = Indicators.StochasticOscillator(100, 10, 10, SMA);
               _stochasticmedium = Indicators.StochasticOscillator(21, 10, 10, SMA);
               _stochasticsfast = Indicators.StochasticOscillator(8, 3, 3, SMA);

        }

        public override void Calculate(int index)
        {
            Slow[index] = _stochasticslow[index];
            Medium[index] = _stochasticmedium[index];
            Fast[index] = _stochasticfast[index];

        }
    }
}
@jeffmichaels

jeffmichaels
05 Mar 2014, 10:27
Could you please explain me about the stochastics too ?
@jeffmichaels
Forex19
05 Mar 2014, 11:00
( Updated at: 21 Dec 2023, 09:20 )
RE:
Spotware said:
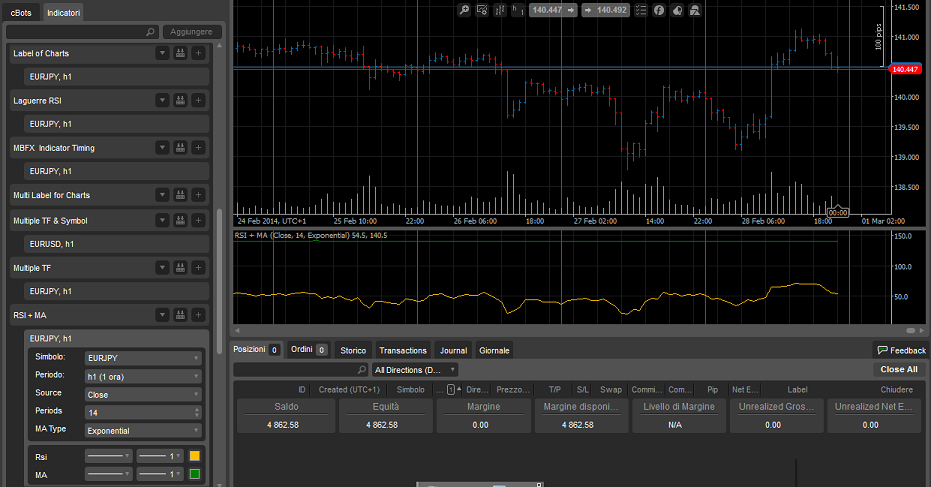
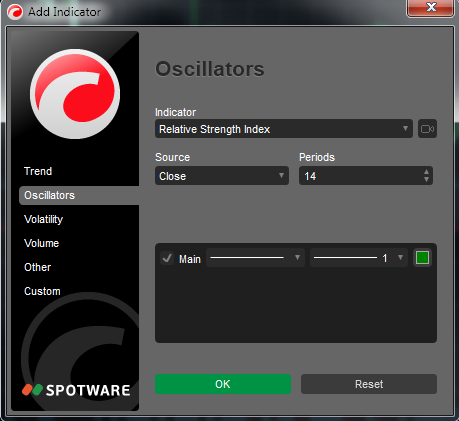
First of all, add RSI to the chart:
.........
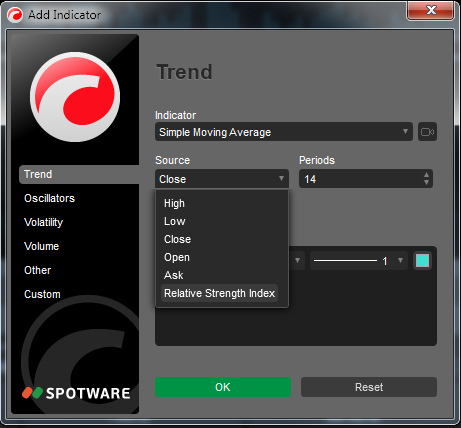
Second of all, add Moving Average with source "Relative Strength Index":
.........
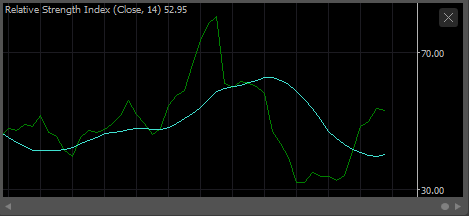
As a result you will see moving average built over RSI:
It works. thanks
Can you tell me which formula is used to normalize the SMA chart, on the scale of 0 -100 RSI chart?
@Forex19
jeffmichaels
05 Mar 2014, 11:01
RE: RE:
Spotware said:
jeffmichaels said:
Could you please explain me about the stochastics too ?
What do you want to do with stochastics?
from my last post :
So i managed to build on your code and now have the 5 ADX in 1 window.
Trying to do the same myself now for 3 stochastics in 1 window, but to no avail. Im not a coder, im fine tweaking stuff but cant seem to get this done.
Any help would be appreciated. I like the lightness of ctrader but i need my MT4 system if i want to switch
1

2

3

4

5

6

7

8

9

10

11

12

13

14

15

16

17

18

19

20

21

22

23

24

25

26

27

28

29

30

31

32

33

34

35

36

37

38

39

40

41

using System;

using cAlgo.API;

using cAlgo.API.Internals;

using cAlgo.API.Indicators;


namespace cAlgo.Indicators

{

    [Indicator(IsOverlay = false, TimeZone = TimeZones.UTC)]

    public class AdxR : Indicator

    {

        [Output("Slow", Color = Colors.Yellow)]

        public IndicatorDataSeries _stochasticslow { get; set; }


        [Output("Medium", Color = Colors.Red)]

        public IndicatorDataSeries _stochasticmedium { get; set; }


        [Output("Fast", Color = Colors.Blue)]

        public IndicatorDataSeries _stochasticfast { get; set; }


        private StochasticOscillator _stochasticslow;

        private StochasticOscillator _stochasticmedium;

        private StochasticOscillator _stochasticsfast;


        protected override void OnStart

        {

               _stochasticslow = Indicators.StochasticOscillator(100, 10, 10, SMA);

               _stochasticmedium = Indicators.StochasticOscillator(21, 10, 10, SMA);

               _stochasticsfast = Indicators.StochasticOscillator(8, 3, 3, SMA);


        }


        public override void Calculate(int index)

        {

            Slow[index] = _stochasticslow[index];

            Medium[index] = _stochasticmedium[index];

            Fast[index] = _stochasticfast[index];


        }

    }

}
@jeffmichaels
Spotware
05 Mar 2014, 11:39
( Updated at: 21 Dec 2023, 09:20 )
RE: RE:
Forex19 said:
Spotware said:
First of all, add RSI to the chart:
.........
Second of all, add Moving Average with source "Relative Strength Index":
.........
As a result you will see moving average built over RSI:
It works. thanks
Can you tell me which formula is used to normalize the SMA chart, on the scale of 0 -100 RSI chart?
In that example SMA is not normalized. SMA is build over RSI data series. That means that SMA[i] = (RSI[i] + RSI[i - 1] + ... RSI[i - period + 1]) / period
@Spotware
Spotware
05 Mar 2014, 11:43
jeffmichaels, please contact one of our Partners or post a job in Jobs section. We can not tweak all indicators for you.
@Spotware
Forex19
05 Mar 2014, 15:45
( Updated at: 21 Dec 2023, 09:20 )
RE: RE: RE:
Spotware said:
Forex19 said:
Spotware said:
First of all, add RSI to the chart:
.........
Second of all, add Moving Average with source "Relative Strength Index":
.........
As a result you will see moving average built over RSI:
It works. thanks
Can you tell me which formula is used to normalize the SMA chart, on the scale of 0 -100 RSI chart?
In that example SMA is not normalized. SMA is build over RSI data series. That means that SMA[i] = (RSI[i] + RSI[i - 1] + ... RSI[i - period + 1]) / period
@Forex19
Forex19
05 Mar 2014, 15:47
( Updated at: 21 Dec 2023, 09:20 )
RE: RE: RE:
Spotware said:
Forex19 said:
Spotware said:
First of all, add RSI to the chart:
.........
Second of all, add Moving Average with source "Relative Strength Index":
.........
As a result you will see moving average built over RSI:
It works. thanks
Can you tell me which formula is used to normalize the SMA chart, on the scale of 0 -100 RSI chart?
In that example SMA is not normalized. SMA is build over RSI data series. That means that SMA[i] = (RSI[i] + RSI[i - 1] + ... RSI[i - period + 1]) / period
I don't understand the calculation to build SMA over RSI data series.
You can actually see me please?
Suppose, at this time, to have a RSI (14) = 65 and you want to build over the SMA (20) = 140.350 (for the currency Euro / Yan).
What is the calculation?
Thank you.
@Forex19
Forex19
05 Mar 2014, 16:17
RE:
Spotware said:
It seems like calculating SMA over RSI doesn't suit your needs. If you want to display SMA and RSI into the same panel you need to write a custom indicator. In this case you will need to normalize somehow values of SMA to fit RSI scale.
The calculating SMA over RSI is good but I would like to have this so you can use it in other ways and not only on chart.
Starting from the exact calculation would be easier to write a custom indicator.
Can you help me, please?
@Forex19
Timmi
16 May 2014, 20:40
RE:
Spotware said:
In order to normalize values of indicator you need to know about visible min and max of another indicator. cAlgo API doesn't expose such information at the moment.
Currently drawing two indicators with independent scales into one panel is not possible.
what if you bring both onto a common scale?
using formulas to bring them to a common denominator?
@Timmi
Spotware
19 May 2014, 09:17
RE: RE:
Timmi said:
Spotware said:
In order to normalize values of indicator you need to know about visible min and max of another indicator. cAlgo API doesn't expose such information at the moment.
Currently drawing two indicators with independent scales into one panel is not possible.
what if you bring both onto a common scale?
using formulas to bring them to a common denominator?
You can try to do that. If you have any example please share it with the community.
@Spotware
khorshidi07
23 May 2014, 13:55
stochastic & MFI in one Window
Hello.
could anybody setup stochastic & MFI indicators in one Window?!
Thanks a lot...
@khorshidi07
Timmi
24 May 2014, 20:35
RE: RE: RE:
Spotware said:
Timmi said:
Spotware said:
In order to normalize values of indicator you need to know about visible min and max of another indicator. cAlgo API doesn't expose such information at the moment.
Currently drawing two indicators with independent scales into one panel is not possible.
what if you bring both onto a common scale?
using formulas to bring them to a common denominator?
You can try to do that. If you have any example please share it with the community.
This stuff is all way over my head. I am not a developer or a programmer.
What I am trying to say, is this:
oscillators that use a scale from 0-100, for example, have an indicator that has source data which is in the HLC-Vol-Time data - because there is no other data to work on- it's all you get. So if you are able to transform that datafeed, to build an oscillator that goes from between 0-100 (just for example - but it can be any range), then you can also take any other data, and bring it to such a range. If it goes from 1-1000, divide the values by 10. Or a square root, or square something, or whatever - I don't kow the formulas behind any existing oscillators and indicators, so I am not the person to ask this question. I just find it funny that we are told that something is NOT possible because they don't share a common scale. That makes no sense at all - why stop at "scale" and just say no? We just have to rebuild the same indicators and oscillators to share a common scale/range, that is all - and your condition has been met.
We are TRADERS, NOT programmers, who would like to use cTrader for one or another characteristic that we like. You aren't making it easy for us... it's much easier to just throw up our arms, say I give up, and go back to MT and continue doing what we want to be doing: TRADING.
@Timmi
Timmi
31 May 2014, 03:54
RE:
Spotware said:
We plan to support adding two indicators to one indicator panel in the future.
wow! THANK YOU!
Please do not limit it to two! If you must max it out, allow up to 4 or 5. Let me explain why:
for example, in MT, I have Accelerator oscillator in the background, Stochastic over it, plus CCI and another line oscillator - all in their own contrasting colors of course, so you can distinguish them out at a glance.
two is a great improvement... half a dozen is great flexibility. the thing is, if you have the chance, don't limit things - that way, you won't have people asking you to add more. let's do it right the first time.
@Timmi
halvardu
28 Jun 2015, 01:15
RE:
jeffmichaels said:
So i managed to build on your code and now have the 5 ADX in 1 window.
Trying to do the same myself now for 3 stochastics in 1 window, but to no avail. Im not a coder, im fine tweaking stuff but cant seem to get this done.
Any help would be appreciated. I like the lightness of ctrader but i need my MT4 system if i want to switch
using System;
using cAlgo.API;
using cAlgo.API.Internals;
using cAlgo.API.Indicators;

namespace cAlgo.Indicators
{
    [Indicator(IsOverlay = false, TimeZone = TimeZones.UTC)]
    public class AdxR : Indicator
    {
        [Output("Slow", Color = Colors.Yellow)]
        public IndicatorDataSeries _stochasticslow { get; set; }

        [Output("Medium", Color = Colors.Red)]
        public IndicatorDataSeries _stochasticmedium { get; set; }

        [Output("Fast", Color = Colors.Blue)]
        public IndicatorDataSeries _stochasticfast { get; set; }

        private StochasticOscillator _stochasticslow;
        private StochasticOscillator _stochasticmedium;
        private StochasticOscillator _stochasticsfast;


        protected override void OnStart
        {
               _stochasticslow = Indicators.StochasticOscillator(100, 10, 10, SMA);
               _stochasticmedium = Indicators.StochasticOscillator(21, 10, 10, SMA);
               _stochasticsfast = Indicators.StochasticOscillator(8, 3, 3, SMA);

        }

        public override void Calculate(int index)
        {
            Slow[index] = _stochasticslow[index];
            Medium[index] = _stochasticmedium[index];
            Fast[index] = _stochasticfast[index];

        }
    }
}
Here is a working version, if someone wants it?
using System;
using cAlgo.API;
using cAlgo.API.Internals;
using cAlgo.API.Indicators;
namespace cAlgo.Indicators
{
[Indicator(IsOverlay = false, TimeZone = TimeZones.UTC)]
public class Stochastic3 : Indicator
{
[Output("Slow", Color = Colors.Yellow)]
public IndicatorDataSeries Slow { get; set; }
[Output("Medium", Color = Colors.Red)]
public IndicatorDataSeries Medium { get; set; }
[Output("Fast", Color = Colors.Blue)]
public IndicatorDataSeries Fast { get; set; }
private StochasticOscillator _stochasticslow;
private StochasticOscillator _stochasticmedium;
private StochasticOscillator _stochasticsfast;
protected override void Initialize()
{
_stochasticslow = Indicators.StochasticOscillator(100, 10, 10, MovingAverageType.Simple);
_stochasticmedium = Indicators.StochasticOscillator(21, 10, 10, MovingAverageType.Simple);
_stochasticsfast = Indicators.StochasticOscillator(8, 3, 3, MovingAverageType.Simple);
}
public override void Calculate(int index)
{
Slow[index] = _stochasticslow.PercentK[index];
Medium[index] = _stochasticmedium.PercentK[index];
Fast[index] = _stochasticsfast.PercentK[index];
}
}
}
@halvardu
Timmi
29 Jun 2015, 22:39
RE: RE:
Timmi said:
Spotware said:
We plan to support adding two indicators to one indicator panel in the future.
wow! THANK YOU!
Please do not limit it to two! If you must max it out, allow up to 4 or 5. Let me explain why:
for example, in MT, I have Accelerator oscillator in the background, Stochastic over it, plus CCI and another line oscillator - all in their own contrasting colors of course, so you can distinguish them out at a glance.
two is a great improvement... half a dozen is great flexibility. the thing is, if you have the chance, don't limit things - that way, you won't have people asking you to add more. let's do it right the first time.
Correction:
the indicators that I like to have, depending on if I'm swing trading or scalping are:
Accelerator Oscillator and Stochastic, as well as another one such as CCI or Rainbow or RSI, all overlaid in the same window.
Ultimate Oscillator and Stochastic, plus CCI or RSI.
I am really not a C programmer... I wish I had the knowledge to just do this on my own instead of having to rely on cTrader team for this.
If anyone is interested in doing this, please post. Thank you.
@Timmi
Timmi
17 Nov 2015, 22:23
RE:
Let me EDIT my post:
Still no news on this huh?
You would rather have #ctraderusers all be working on creating their own variants, instead of just one of the spotware employees doing it for all?
What I mean here, is for each combination, like having a stochastic with an overlapping RSI (or rainbow), it will take a spotware person a few minutes, or it will take 1 million users, collectively, 15million minutes (that is 350,000 man-hours) to to it all for themselves. How do you justify that? You are annoying a whole lot of people with that. We don't want to program - we have already taken time out of trading, to reluctantly come here... now we learn that things don't get fixed - we'll have to do programming too now.
@Timmi
birlatrimayacontact
05 Aug 2023, 09:31
How it is possible
how can we do that exactly , can you please ellaborate it
@birlatrimayacontact
PanagiotisChar
07 Aug 2023, 11:40
( Updated at: 21 Dec 2023, 09:23 )
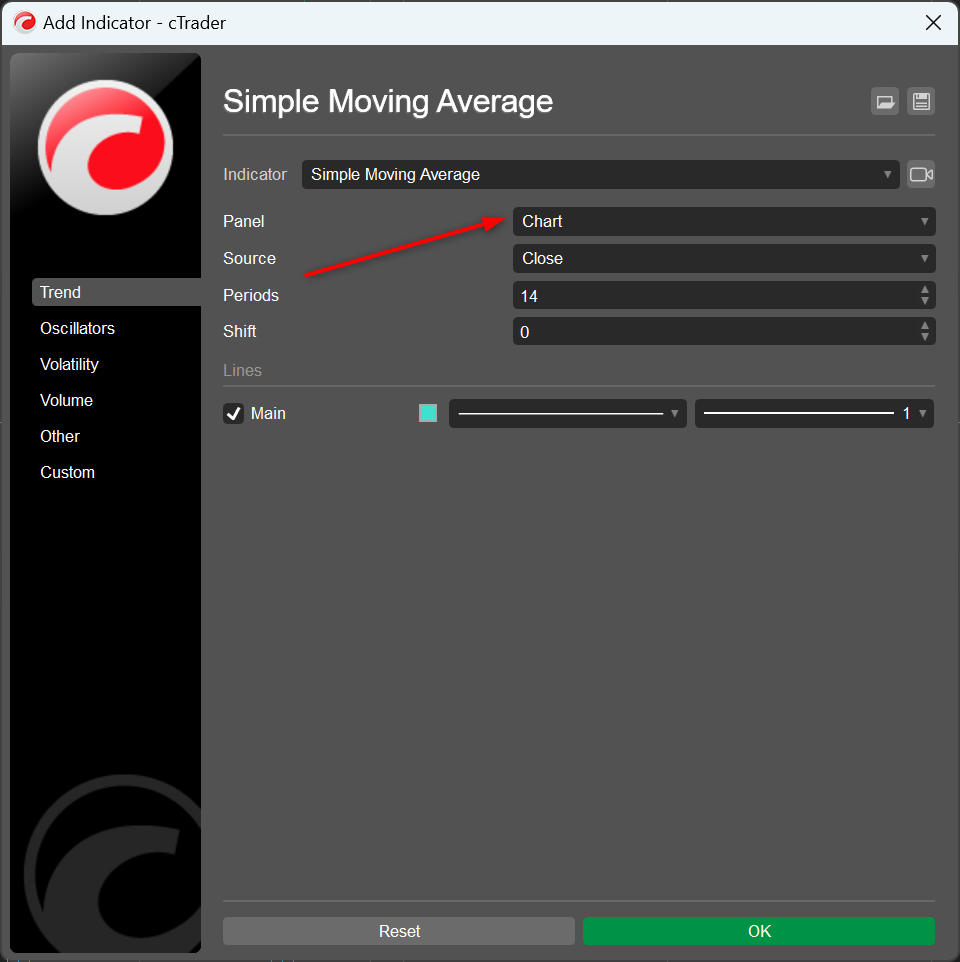
RE: How it is possible
birlatrimayacontact said:
how can we do that exactly , can you please ellaborate it
You can choose where the indicator will be displayed here
Need help? Join us on Telegram
@PanagiotisChar
Scott
10 May 2013, 16:09
RE:
I've tried to work this one out in the past with no luck, you can however have more than 2 indicators overlayed on a chart
@Scott