Description
Chart Analysis
I am sharing this indicator with you because the underlying idea seems interesting. Goal: You will find the missing improvements for this indicator to fully exploit its potential ! =)
This indicator analyzes the highs and lows of the chart similar to the zigzag. It provides the following information:
- The average pips generated by the zigzag (highs and lows) across the entire chart.
- The latest maximum pips generated in the trend.
- The maximum pips generated by a trend across the entire chart.
- The minimum pips generated by a trend across the entire chart.
- The difference in pips between the latest high and the current price.
- The difference in pips between the latest low and the current price.
Exemple to use :
- When the Green line is at 0 = Lower Low || When the Green touche the gray line = Higher High.
- When the Red line is at 0 = Higher High. || When the Redtouche the gray line = Lower Low.
- When either the Green/Red line is above and touches the Blue line, the minimum pips generated by all trends on the chart have been reached.
- When either the Green/Red line is above and touches the Yellow line, the average pips generated by all trends on the chart have been reached
The purpose of this indicator is to understand trend behavior, both at their minimum and maximum, as well as their average.
This indicator is in the beta testing phase. If you have ideas for improvement or if you would like to join a team to create robots with trading approaches that enhance security, please contact me on Telegram : https://t.me/nimi012 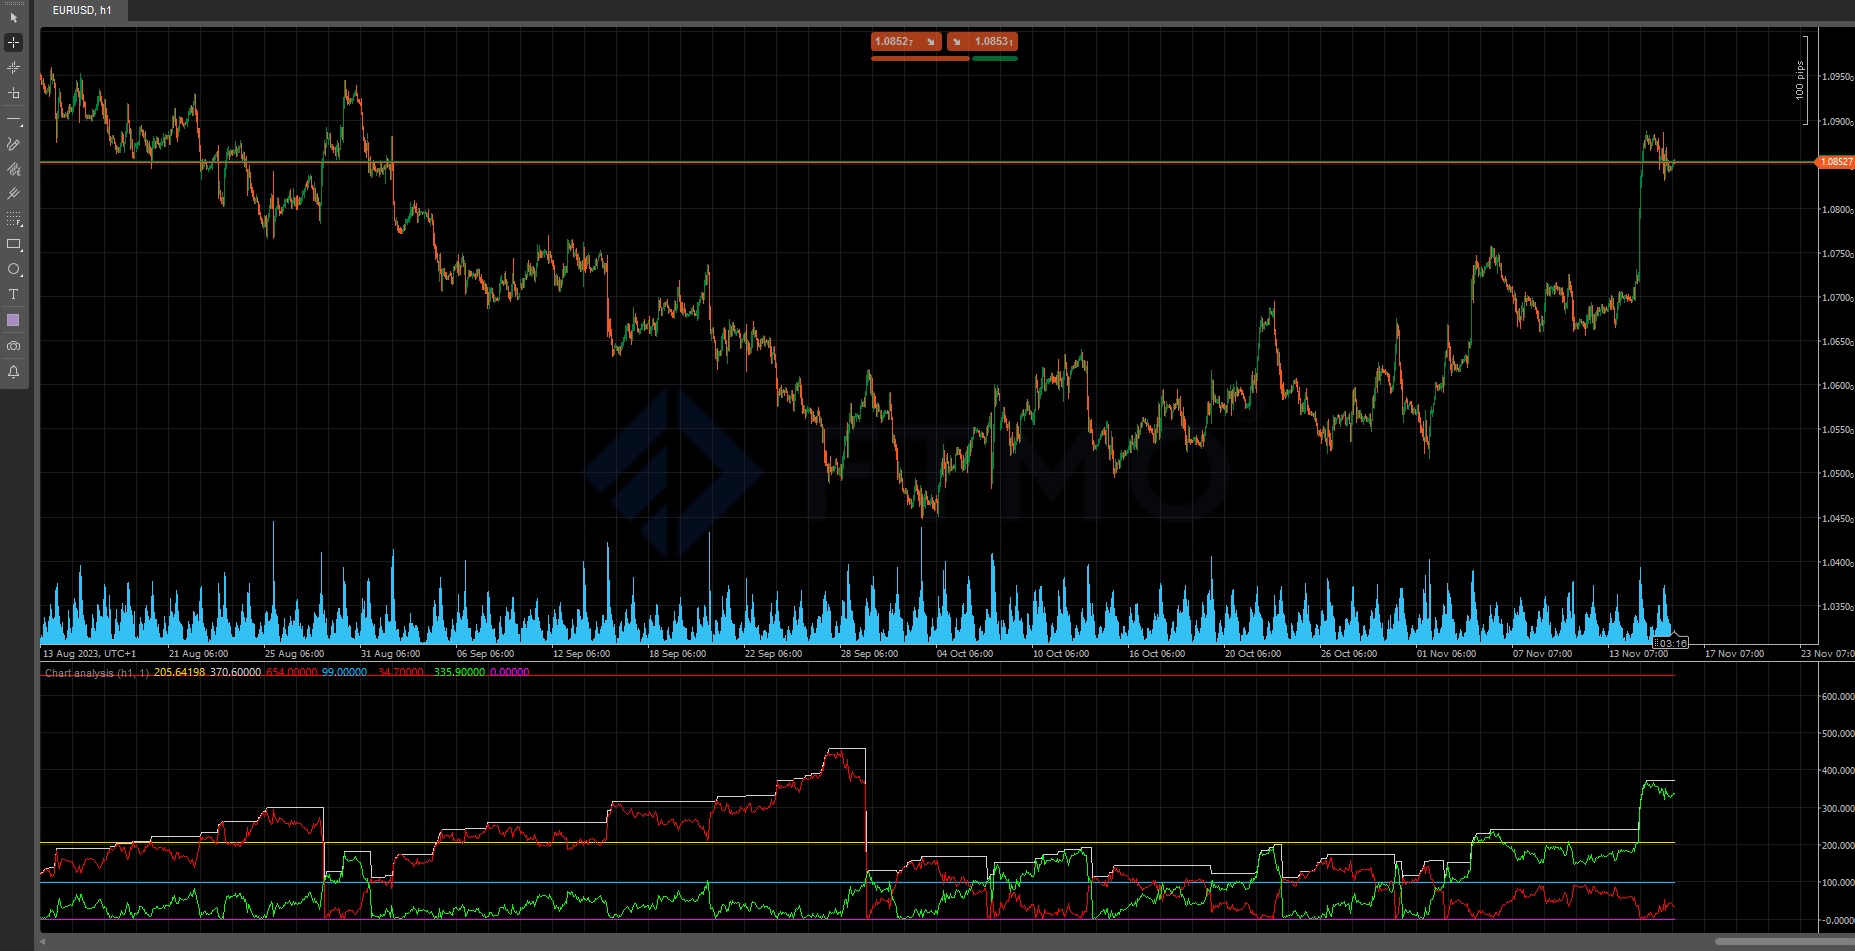
using System;
using cAlgo.API;
using cAlgo.API.Internals;
using cAlgo.API.Indicators;
using System.Collections.Generic;
using System.Linq;
using Microsoft;

namespace cAlgo.Indicators
{
    [Indicator(IsOverlay = false, AutoRescale = false, AccessRights = AccessRights.None)]
    public class ChartAnalysis : Indicator
    {

        [Parameter("Time Frame 1", DefaultValue = "Hour1", Group = "TimeFrame")]
        public TimeFrame SelectedTimeFrame1 { get; set; }
        [Parameter("Deviation Percent", DefaultValue = 1, MinValue = 0.01)]
        public double deviationPercent { get; set; }

        [Output("Result of moyenne", LineColor = "Gold", Thickness = 1, PlotType = PlotType.Line)]
        public IndicatorDataSeries Resultofmoyenne { get; set; }
        [Output("Last Pips Maked", LineColor = "LightGray", Thickness = 1, PlotType = PlotType.Line)]
        public IndicatorDataSeries LastPipsMaked { get; set; }
        [Output("Max Pips Maked", LineColor = "Red", Thickness = 1, PlotType = PlotType.Line)]
        public IndicatorDataSeries MaxPipsMaked { get; set; }
        [Output("Min Pips Maked", LineColor = "DeepSkyBlue", Thickness = 1, PlotType = PlotType.Line)]
        public IndicatorDataSeries MinPipsMaked { get; set; }
        [Output("Last High to Price", LineColor = "Red", Thickness = 1, PlotType = PlotType.Line)]
        public IndicatorDataSeries LastHighToPrice { get; set; }
        [Output("Last Down to Price", LineColor = "Lime", Thickness = 1, PlotType = PlotType.Line)]
        public IndicatorDataSeries LastDownToPrice { get; set; }
        [Output("Level 0", LineColor = "Magenta", Thickness = 1, PlotType = PlotType.Line)]
        public IndicatorDataSeries Level0 { get; set; }


        public enum Direction
        {
            Up,
            Down
        }

        private Direction direction = Direction.Up;
        private double Extremum_Price = 0.0;
        private double Extremum_Price_Up = 0.0;
        private double Extremum_Price_Down = 0.0;
        private int Extremum_Index = 0;
        private double lastHigh, lastDown;

        private Dictionary<int, double> historique = new Dictionary<int, double>();
        private List<double> resPipsAtr = new List<double>();

        private MovingAverage ma;

        private IndicatorDataSeries Price_Up, atrZigZag, DataLastUp, DataLastDown, MaHighRes, MaDownRes, Value;

        private Bars barsTF;
        private bool isCurrentTimeFrame1;

        protected override void Initialize()
        {
            isCurrentTimeFrame1 = SelectedTimeFrame1 == TimeFrame;
            barsTF = MarketData.GetBars(SelectedTimeFrame1);

            while (barsTF.OpenTimes[0] > Bars.OpenTimes[0])
                barsTF.LoadMoreHistory();

            Value = CreateDataSeries();

            Price_Up = CreateDataSeries();
            atrZigZag = CreateDataSeries();

            DataLastUp = CreateDataSeries();
            DataLastDown = CreateDataSeries();

            MaHighRes = CreateDataSeries();
            MaDownRes = CreateDataSeries();

            ma = Indicators.MovingAverage(Price_Up, 1, MovingAverageType.Simple);
            lastHigh = 0.0;
            lastDown = 0.0;
        }
        public struct Result
        {
            public int? Index;
            public double? Value;
        }
        public Result Last_Extremum()
        {
            for (int index = Value.Count - 1; index >= 0; index--)
                if (!Value[index].Equals(Double.NaN))
                    return new Result
                    {
                        Index = index,
                        Value = Value[index]
                    };

            return new Result
            {
                Index = null,
                Value = null
            };
        }
        public double Extremum_Price_UP()
        {
            return Extremum_Price_Up;
        }
        public double Extremum_Price_DOWN()
        {
            return Extremum_Price_Down;
        }
        private void Move_Extremum(int index, double price)
        {

            Value[Extremum_Index] = Double.NaN;
            Set_Extremum(index, price);
        }
        private void Set_Extremum(int index, double price)
        {
            Extremum_Price_Up = direction == Direction.Up ? price : Extremum_Price_Up;
            Extremum_Price_Down = direction == Direction.Down ? price : Extremum_Price_Down;
            Extremum_Index = index;
            Extremum_Price = price;
            Value[Extremum_Index] = Extremum_Price;
        }
        public override void Calculate(int index)
        {

            Level0[index] = 0;
            int indexTF = isCurrentTimeFrame1 ? index : barsTF.OpenTimes.GetIndexByTime(Bars.OpenTimes[index]);

            double low = barsTF.LowPrices[indexTF];
            double high = barsTF.HighPrices[indexTF];

            if (Extremum_Price == 0.0)
            {
                Extremum_Price = high;
                Extremum_Price_Up = high;
                Extremum_Price_Down = low;
            }
            if (Bars.ClosePrices.Count < 2)
                return;

            if (direction == Direction.Down)
            {
                if (low <= Extremum_Price)
                {
                    Move_Extremum(indexTF, low);
                }
                else if (high >= Extremum_Price * (1.0 + deviationPercent * 0.01))
                {
                    Set_Extremum(indexTF, high);
                    direction = Direction.Up;
                }
            }
            else
            {
                if (high >= Extremum_Price)
                {
                    Move_Extremum(indexTF, high);
                }
                else if (low <= Extremum_Price * (1.0 - deviationPercent * 0.01))
                {
                    Set_Extremum(indexTF, low);
                    direction = Direction.Down;
                }
            }
            if (!historique.ContainsKey((int)Last_Extremum().Index))
            {
                historique.Add((int)Last_Extremum().Index, (double)Last_Extremum().Value);
            }
            if (historique.ContainsKey((int)Last_Extremum().Index))
            {
                historique[(int)Last_Extremum().Index] = (double)Last_Extremum().Value;
                Price_Up[index] = (double)Last_Extremum().Value;
            }
            if (Price_Up[index] != double.NaN)
            {
                atrZigZag[index] = ma.Result.Last(0);

                if (atrZigZag[index] > atrZigZag[index - 1])
                {
                    MaHighRes[index] = ma.Result.Last(0);
                    MaDownRes[index] = 0;
                }
                if (atrZigZag[index] < atrZigZag[index - 1])
                {
                    MaHighRes[index] = 0;
                    MaDownRes[index] = ma.Result.Last(0);
                }
                if (atrZigZag[index] == atrZigZag[index - 1])
                {
                    MaHighRes[index] = MaHighRes[index - 1];
                    MaDownRes[index] = MaDownRes[index - 1];
                }
                if (MaHighRes[index - 1] != 0 && MaHighRes[index] == 0)
                {
                    DataLastUp[index] = MaHighRes[index - 1];
                }
                if (MaDownRes[index - 1] != 0 && MaDownRes[index] == 0)
                {
                    DataLastDown[index] = MaDownRes[index - 1];
                }
            }
            var totalPipsPrisEnCompte = 0.0;
            var PipsPrisEnCompte = 0.0;
            var totalValeurPrisEnCompte = 0;

            for (int i = 0; i < Bars.Count; i++)
            {
                PipsPrisEnCompte = ((DataLastUp.Last(0) / Symbol.PipSize) - (DataLastDown.Last(0) / Symbol.PipSize));

                totalPipsPrisEnCompte += PipsPrisEnCompte;
                totalValeurPrisEnCompte = i;
            }
            var pipsMaked = (DataLastUp.Last(0) / Symbol.PipSize) - (DataLastDown.Last(0) / Symbol.PipSize);
            if (!resPipsAtr.Contains(pipsMaked))
            {
                resPipsAtr.Add(pipsMaked);
            }
            var totalCount = resPipsAtr.Count();
            var totalPipsPrisEnCompte2 = 0.0;
            var PipsPrisEnCompte2 = 0.0;

            if (MaHighRes[index] != 0)
                lastHigh = MaHighRes[index]; //  Indicateur Infos 1 ->  ||     lastHigh - bars.closePrices.last(0)

            if (MaDownRes[index] != 0)
                lastDown = MaDownRes[index];

            LastPipsMaked[index] = (lastHigh - lastDown) / Symbol.PipSize; //  Indicateur Infos 2 ->    ||      lastDown - bars.closePrices.last(0)

            for (int i = totalCount - 1; i > 0; i--)
            {
                PipsPrisEnCompte2 = resPipsAtr[i];
                totalPipsPrisEnCompte2 += PipsPrisEnCompte2;
            }

            List<double> range = resPipsAtr.GetRange(1, resPipsAtr.Count() - 1);

            MaxPipsMaked[index] = Math.Max(range.Max(), LastPipsMaked[index]); //  Indicateur Infos 3 ->  ||     Maximum depuis le debut
            MinPipsMaked[index] = Math.Min(range.Min(), LastPipsMaked[index]); //  Indicateur Infos 4 ->  ||      Minimum depuis le debut
            Resultofmoyenne[index] = (totalPipsPrisEnCompte2 + LastPipsMaked[index]) / (totalCount);

            LastHighToPrice[index] = (lastHigh - Bars.ClosePrices[index]) / Symbol.PipSize;
            LastDownToPrice[index] = (Bars.ClosePrices[index] - lastDown) / Symbol.PipSize;
        }
    }
}
YesOrNot
Joined on 10.10.2022 Blocked
- Distribution: Free
- Language: C#
- Trading platform: cTrader Automate
- File name: Chart analysis.algo
- Rating: 5
- Installs: 789
- Modified: 16/11/2023 01:00
