Description
Search for Dev Team to make big Cbot, contact me at : https://t.me/nimi012 (direct messaging)
This indicator, called RCS INDEX RSI, operates by calculating the Relative Strength Index (RSI) for two sets of financial symbols. These two sets come from watchlists on the cAlgo trading platform. The indicator combines the RSI information from these two sets to generate indices and buy/sell signals. Here is a summary of its main functionality:
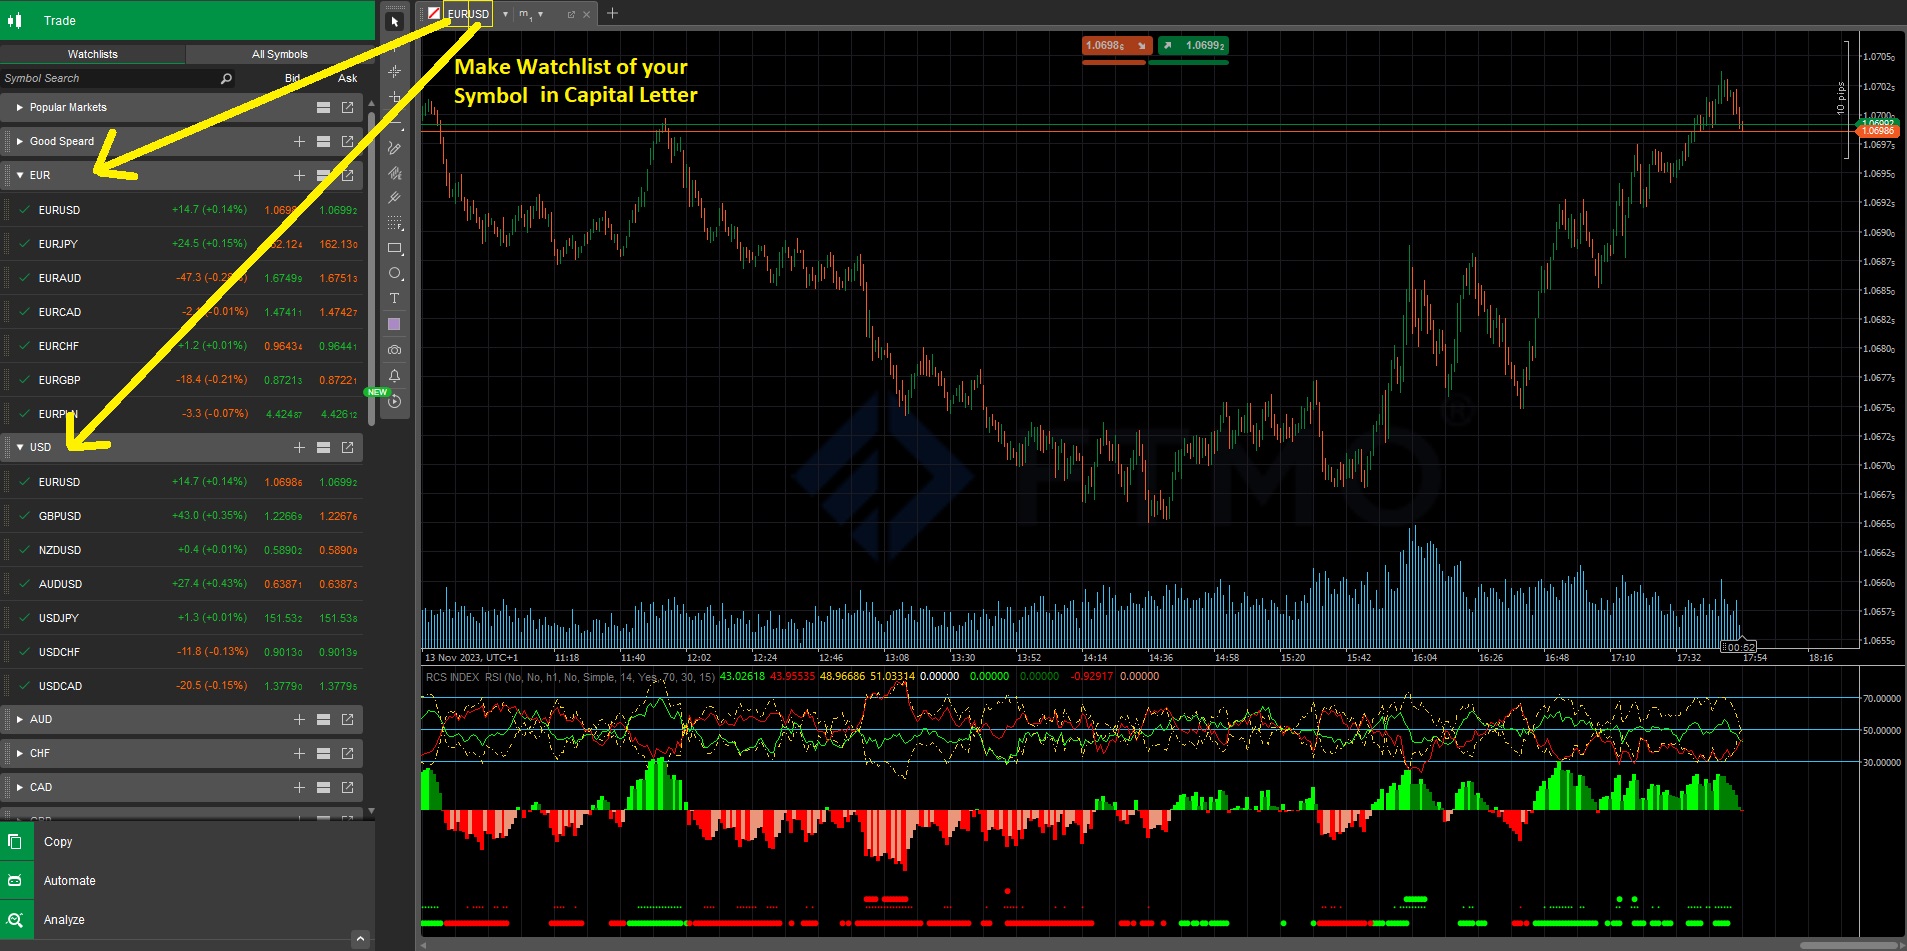
For the RCS INDEX RSI to function, you need to create two watchlists in cTrader with the names of the symbols to be analyzed, and incorporate the different symbols of the currency you want to analyze into the watchlist.
example : EURUSD
- > watchlist 1 name = EUR (Refer to the photo)
- > watchlist 1 name = USD (Refer to the photo)
Two Watchlists: The indicator loads two sets of financial symbols from cAlgo's watchlists.
RSI Calculation: For each symbol in the two sets, the indicator calculates the RSI using a defined period.
Information Combination: The calculated RSIs for the two sets are combined to form overall indices, reflecting the relative strength between the two groups of symbols.
MTF Smoothing (Optional): The results can be smoothed using a moving average.
Signal Generation: Buy/sell signals are generated based on specific conditions, such as exceeding predefined RSI levels (70, 50, 30), and significant differences between the two sets of symbols.
Graphical Display: The results, including combined indices, buy/sell signals, and optionally an histogram, are displayed graphically on the trading chart.
In summary, this indicator aims to provide information on the relative strength between two sets of symbols using the RSI, which can assist traders in making informed decisions about buying or selling opportunities in the financial market.
using System;
using System.Linq;
using System.Threading;
using cAlgo.API;
using cAlgo.API.Indicators;
using cAlgo.API.Internals;
using cAlgo.Indicators;
using System.Collections.Generic;
using System.IO;
using System.Text;

namespace cAlgo
{
    [Levels(70, 50, 30)]
    [Indicator(IsOverlay = false, TimeZone = TimeZones.UTC, AccessRights = AccessRights.None)]
    public class RCSINDEXRSI : Indicator
    {

        [Parameter("Other TimeFrame Index ?", DefaultValue = false, Group = "TimeFrame Setting")]
        public bool OtherTfIndex { get; set; }
        [Parameter("Other TimeFrame Symbol ?", DefaultValue = false, Group = "TimeFrame Setting")]
        public bool OtherTfSymbol { get; set; }
        [Parameter("TimeFrame", DefaultValue = "Hour1", Group = "TimeFrame Setting")]
        public TimeFrame Tf { get; set; }

        [Parameter("Smooth High Tf Result ?", DefaultValue = false, Group = "Smooth TimeFrame Setting")]
        public bool SmoothTf { get; set; }
        [Parameter("Smooth Ma Type", DefaultValue = MovingAverageType.Simple, Group = "Smooth TimeFrame Setting")]
        public MovingAverageType SmootingType { get; set; }

        [Parameter("Period", DefaultValue = 14, Group = "RSI Setting")]
        public int Periods { get; set; }

        [Parameter("Smooth High Tf Result ?", DefaultValue = true, Group = "Smooth TimeFrame Setting")]
        public bool ShowHisto { get; set; }

        [Parameter("OverBuy", DefaultValue = 70, Group = "Over(Buy/Sell) Signal")]
        public double OverBuy { get; set; }
        [Parameter("OverSell", DefaultValue = 30, Group = "Over(Buy/Sell) Signal")]
        public double OverSell { get; set; }
        [Parameter("Ecart Symbol", DefaultValue = 15, Group = "Over(Buy/Sell) Signal")]
        public double EcartSymbol { get; set; }

        // Output
        [Output("Symb n° 1", LineColor = "Lime", PlotType = PlotType.Line, LineStyle = LineStyle.Solid, Thickness = 1)]
        public IndicatorDataSeries SymbN1 { get; set; }
        [Output("Symb n° 2", LineColor = "Red", PlotType = PlotType.Line, LineStyle = LineStyle.Solid, Thickness = 1)]
        public IndicatorDataSeries SymbN2 { get; set; }
        [Output("Result Rsi Symbol", LineColor = "Gold", PlotType = PlotType.Line, LineStyle = LineStyle.LinesDots, Thickness = 1)]
        public IndicatorDataSeries Result { get; set; }
        [Output("Inverse Result Rsi Symbol", LineColor = "Gold", PlotType = PlotType.Line, LineStyle = LineStyle.LinesDots, Thickness = 1)]
        public IndicatorDataSeries InverseResult { get; set; }

        [Output("White", PlotType = PlotType.Histogram, LineColor = "White", Thickness = 4)]
        public IndicatorDataSeries White { get; set; }
        [Output("Up Bullish", PlotType = PlotType.Histogram, LineColor = "Lime", Thickness = 4)]
        public IndicatorDataSeries StrongBullish { get; set; }
        [Output("Down Bullish", PlotType = PlotType.Histogram, LineColor = "Green", Thickness = 4)]
        public IndicatorDataSeries WeakBullish { get; set; }
        [Output("Down Bearish", PlotType = PlotType.Histogram, LineColor = "Red", Thickness = 4)]
        public IndicatorDataSeries StrongBearish { get; set; }
        [Output("Up Bearish", PlotType = PlotType.Histogram, LineColor = "DarkSalmon", Thickness = 4)]
        public IndicatorDataSeries WeakBearish { get; set; }


        [Output("Symbol 1 OverBuy", LineColor = "Lime", PlotType = PlotType.Points, LineStyle = LineStyle.Solid, Thickness = 5)]
        public IndicatorDataSeries Signal1 { get; set; }
        [Output("Symbol 1 OverSell", LineColor = "Red", PlotType = PlotType.Points, LineStyle = LineStyle.Solid, Thickness = 5)]
        public IndicatorDataSeries Signal2 { get; set; }

        [Output("Symbol 2 OverBuy", LineColor = "Red", PlotType = PlotType.Points, LineStyle = LineStyle.Solid, Thickness = 5)]
        public IndicatorDataSeries Signal3 { get; set; }
        [Output("Symbol 2 OverSell", LineColor = "Lime", PlotType = PlotType.Points, LineStyle = LineStyle.Solid, Thickness = 5)]
        public IndicatorDataSeries Signal4 { get; set; }

        [Output("Big Up Trend", LineColor = "Lime", PlotType = PlotType.Points, LineStyle = LineStyle.Solid, Thickness = 1)]
        public IndicatorDataSeries Signal5 { get; set; }
        [Output("Big Down Trend", LineColor = "Red", PlotType = PlotType.Points, LineStyle = LineStyle.Solid, Thickness = 1)]
        public IndicatorDataSeries Signal6 { get; set; }

        [Output("Up Trend", LineColor = "Lime", PlotType = PlotType.Points, LineStyle = LineStyle.Solid, Thickness = 5)]
        public IndicatorDataSeries Signal7 { get; set; }
        [Output("Down Trend", LineColor = "Red", PlotType = PlotType.Points, LineStyle = LineStyle.Solid, Thickness = 5)]
        public IndicatorDataSeries Signal8 { get; set; }

        // Index 1 & 2
        private RelativeStrengthIndex[] rsiIndex1, rsiIndex2;
        private Symbol[] TradeList, TradeList2;
        private Bars[] bars1, bars2;
        private IndicatorDataSeries[] ResPaireWatchlist1, ResPaireWatchlist2;
        private int[] indexBars1, indexBars2;

        // Result Paire
        private RelativeStrengthIndex rsiPaire;
        private Bars barsPaire;
        private int indexPaire;

        // Smoothing High TF
        private MovingAverage smoothIndex1, smoothIndex2, smoothPair;
        private IndicatorDataSeries ResIndexCurrency1, ResIndexCurrency2, ResRsiPaire;

        protected override void Initialize()
        {
            //Load Watchlist 1 for Index
            foreach (Watchlist w in Watchlists)
            {
                if (w.Name == Bars.ToString().Substring(0, 3))
                    TradeList = Symbols.GetSymbols(w.SymbolNames.ToArray());
            }

            //Load Watchlist 2 for Index
            foreach (Watchlist x in Watchlists)
            {
                if (x.Name == Bars.ToString().Substring(3, 3))
                    TradeList2 = Symbols.GetSymbols(x.SymbolNames.ToArray());
            }

            //Create Indicators for Watchlist 1
            rsiIndex1 = new RelativeStrengthIndex[TradeList.Length];
            bars1 = new Bars[TradeList.Length];
            indexBars1 = new int[TradeList.Length];
            ResPaireWatchlist1 = new IndicatorDataSeries[TradeList.Length];

            //Create Indicators for Watchlist 2
            rsiIndex2 = new RelativeStrengthIndex[TradeList2.Length];
            bars2 = new Bars[TradeList2.Length];
            indexBars2 = new int[TradeList2.Length];
            ResPaireWatchlist2 = new IndicatorDataSeries[TradeList2.Length];
            Print();
            Print("Watchlist 1 : [ {0} ] = {1} symbols   ||   Watchlist 2 : [ {2} ] = {3} symbols", Bars.ToString().Substring(0, 3), TradeList.Length, Bars.ToString().Substring(3, 3), TradeList2.Length);
            Print();

            //Initialize Indicators for Watchlist 1
            int i = 0;
            foreach (var symbol in TradeList)
            {
                Print("Watchlist : [ {0} ] => {1} symbols = {2}", Bars.ToString().Substring(0, 3), (i + 1), symbol.Name);
                //Load bars of watchlist 1
                bars1[i] = MarketData.GetBars(OtherTfIndex ? Tf : TimeFrame, symbol.Name);
                while (bars1[i].OpenTimes[0] > Bars.OpenTimes[0])
                    bars1[i].LoadMoreHistory();

                //Load Futurs DataSerie watchlist 1 (calculation in Calculate(int index))
                ResPaireWatchlist1[i] = CreateDataSeries();

                //Load Indicators watchlist 1
                rsiIndex1[i] = Indicators.RelativeStrengthIndex(bars1[i].ClosePrices, Periods);
                i++;
            }

            //Initialize Indicators for Watchlist 2
            Print();

            int j = 0;
            foreach (var symbol2 in TradeList2)
            {
                Print("Watchlist : [ {0} ] => {1} symbols = {2}", Bars.ToString().Substring(3, 3), (j + 1), symbol2.Name);
                //Load bars of watchlist 2
                bars2[j] = MarketData.GetBars(OtherTfIndex ? Tf : TimeFrame, symbol2.Name);
                while (bars2[j].OpenTimes[0] > Bars.OpenTimes[0])
                    bars2[j].LoadMoreHistory();

                //Load Futurs DataSerie watchlist 2 (calculation in Calculate(int index))
                ResPaireWatchlist2[j] = CreateDataSeries();

                //Load Indicators watchlist 2
                rsiIndex2[j] = Indicators.RelativeStrengthIndex(bars2[j].ClosePrices, Periods);
                j++;
            }
            //Initialize Indicators for Paires
            barsPaire = MarketData.GetBars(OtherTfSymbol ? Tf : TimeFrame, SymbolName);
            while (barsPaire.OpenTimes[0] > Bars.OpenTimes[0])
                barsPaire.LoadMoreHistory();
            rsiPaire = Indicators.RelativeStrengthIndex(barsPaire.ClosePrices, Periods);
            Print();
            //Initialize Smooth For High TimeFrame
            var smooth = 0;
            if (OtherTfSymbol)
            {
                for (int k = 0; k < 1500; k++)
                {
                    if (barsPaire.OpenTimes.Last(2) <= Bars.OpenTimes.Last(k) && barsPaire.OpenTimes.Last(1) > Bars.OpenTimes.Last(k))
                        smooth++;
                }
            }
            else
            {
                for (int k = 0; k < 1500; k++)
                {
                    if (bars1[0].OpenTimes.Last(2) <= Bars.OpenTimes.Last(k) && bars1[0].OpenTimes.Last(1) > Bars.OpenTimes.Last(k))
                        smooth++;
                }
            }

            ResIndexCurrency1 = CreateDataSeries();
            ResIndexCurrency2 = CreateDataSeries();
            ResRsiPaire = CreateDataSeries();

            //Smooth Ma High TimeFrame
            smoothIndex1 = Indicators.MovingAverage(ResIndexCurrency1, smooth == 0 ? 1 : 0, SmootingType);
            smoothIndex2 = Indicators.MovingAverage(ResIndexCurrency2, smooth == 0 ? 1 : 0, SmootingType);
            smoothPair = Indicators.MovingAverage(ResRsiPaire, smooth == 0 ? 1 : 0, SmootingType);
        }
        public override void Calculate(int index)
        {
            if (index < Periods)
                return;

            //Calculation of Index Currency Watchlist 1
            var countIndex1 = 0.0;
            for (int i = 0; i < TradeList.Length; i++)
            {
                //Get Index For Bars
                indexBars1[i] = bars1[i].OpenTimes.GetIndexByTime(Bars.OpenTimes[index]);
                //Calculation of Rsi Watchlist 1
                ResPaireWatchlist1[i][index] = rsiIndex1[i].Result[indexBars1[i]] - 50;

                // Calculation of Index and revers paire (ex: USDCAD / EURUSD == USDCAD / USDEUR)
                if (bars1[i].ToString().Substring(0, 3) == Bars.ToString().Substring(0, 3))
                    countIndex1 += ResPaireWatchlist1[i][index];

                else if (bars1[i].ToString().Substring(3, 3) == Bars.ToString().Substring(0, 3))
                    countIndex1 -= ResPaireWatchlist1[i][index];
            }
            ResIndexCurrency1[index] = (countIndex1 / TradeList.Length) + 50;
            SymbN1[index] = SmoothTf && OtherTfIndex ? smoothIndex1.Result.Last(0) : ResIndexCurrency1[index];

            //Calculation of Index Currency Watchlist 2
            var countIndex2 = 0.0;
            for (int j = 0; j < TradeList2.Length; j++)
            {
                //Get Index For Bars
                indexBars2[j] = bars2[j].OpenTimes.GetIndexByTime(Bars.OpenTimes[index]);
                //Calculation of Rsi
                ResPaireWatchlist2[j][index] = rsiIndex2[j].Result[indexBars2[j]] - 50;

                // Inverse Calculation For inverse paire (ex: USDCAD / EURUSD == USDCAD / USDEUR)
                if (bars2[j].ToString().Substring(0, 3) == Bars.ToString().Substring(3, 3))
                    countIndex2 += ResPaireWatchlist2[j][index];

                else if (bars2[j].ToString().Substring(3, 3) == Bars.ToString().Substring(3, 3))
                    countIndex2 -= ResPaireWatchlist2[j][index];
            }
            ResIndexCurrency2[index] = (countIndex2 / TradeList2.Length) + 50;
            SymbN2[index] = SmoothTf && OtherTfIndex ? smoothIndex2.Result.Last(0) : ResIndexCurrency2[index];

            //Calculation of Result Paire
            //Get Index For Bars
            indexPaire = barsPaire.OpenTimes.GetIndexByTime(Bars.OpenTimes[index]);

            ResRsiPaire[index] = rsiPaire.Result[indexPaire];
            Result[index] = SmoothTf && OtherTfSymbol ? smoothPair.Result.Last(0) : ResRsiPaire[index];
            InverseResult[index] = (-(ResRsiPaire[index] - 50)) + 50;

            //Matrice signal
            //over(Buy/Sell)
            Signal1[index] = SymbN1[index] > OverBuy ? -50 : double.NaN;
            Signal2[index] = SymbN1[index] < OverSell ? -50 : double.NaN;

            Signal3[index] = SymbN2[index] > OverBuy ? -55 : double.NaN;
            Signal4[index] = SymbN2[index] < OverSell ? -55 : double.NaN;

            //Difference of index
            Signal5[index] = SymbN1[index] - SymbN2[index] > EcartSymbol ? -60 : double.NaN;
            Signal6[index] = SymbN1[index] - SymbN2[index] < -EcartSymbol ? -60 : double.NaN;


            //Under/over level 50 rsi
            Signal7[index] = SymbN1[index] > 50 && SymbN2[index] < 50 ? -70 : double.NaN;
            Signal8[index] = SymbN1[index] < 50 && SymbN2[index] > 50 ? -70 : double.NaN;

            //Histogram
            double HistogramValue = SymbN1[index] - SymbN2[index];
            double prevHistogramValue = SymbN1[index - 1] - SymbN2[index - 1];
            if (ShowHisto)
            {
                if (HistogramValue > 0)
                {
                    if (prevHistogramValue >= HistogramValue)
                    {
                        WeakBullish[index] = HistogramValue;
                        StrongBullish[index] = 0;
                        WeakBearish[index] = 0;
                        StrongBearish[index] = 0;
                        White[index] = 0;
                    }
                    else
                    {
                        StrongBullish[index] = HistogramValue;
                        WeakBullish[index] = 0;
                        WeakBearish[index] = 0;
                        StrongBearish[index] = 0;
                        White[index] = 0;
                    }
                }
                else if (HistogramValue < -0)
                {
                    if (HistogramValue <= prevHistogramValue)
                    {
                        StrongBearish[index] = HistogramValue;
                        WeakBearish[index] = 0;
                        StrongBullish[index] = 0;
                        WeakBullish[index] = 0;
                        White[index] = 0;
                    }
                    else
                    {
                        WeakBearish[index] = HistogramValue;
                        StrongBearish[index] = 0;
                        StrongBullish[index] = 0;
                        WeakBullish[index] = 0;
                        White[index] = 0;
                    }
                }
                else
                {
                    if (HistogramValue <= prevHistogramValue)
                    {
                        White[index] = HistogramValue;
                        WeakBearish[index] = 0;
                        WeakBearish[index] = 0;
                        StrongBullish[index] = 0;
                        WeakBullish[index] = 0;
                    }
                    else
                    {
                        WeakBearish[index] = 0;
                        White[index] = HistogramValue;
                        StrongBearish[index] = 0;
                        StrongBullish[index] = 0;
                        WeakBullish[index] = 0;
                    }
                }
            }
        }
    }
}
YesOrNot
Joined on 10.10.2022 Blocked
- Distribution: Free
- Language: C#
- Trading platform: cTrader Automate
- File name: RCS INDEX RSI.algo
- Rating: 0
- Installs: 324
