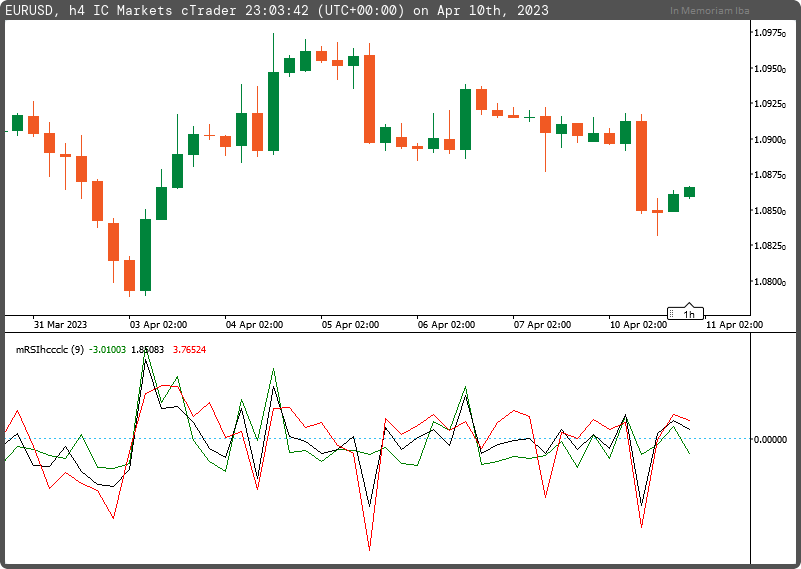
Description
The Relative Strength Index (RSI) is a popular momentum indicator used in technical analysis to measure the strength of an asset's price action. It is typically used to identify potential buying or selling opportunities in the market.
This unique indicator utilizes different sets of input data to calculate three RSI components simultaneously.
The three RSI indicator components are generated from three data sets: high minus close[1], close minus close[1], and low minus close[1]. In other words, these data sets are calculated using the current day's high, close, and low price values in comparison with yesterday's close price value. These data sets are essential for generating three different RSI values.
By using this unique RSI indicator code, traders can have a more comprehensive understanding of the strength of an asset's price action. By simultaneously monitoring the three different RSI values, traders can identify potential buying or selling opportunities based on their individual trading strategies.
In simple terms, when all three indicator components are above zero, the market sentiment is very bullish, and when all three indicator components are below zero, the market sentiment is very bearish.

using System;
using cAlgo.API;
using cAlgo.API.Indicators;
using cAlgo.API.Internals;

namespace cAlgo
{
    [Levels(0)]
    [Indicator(IsOverlay = false, AccessRights = AccessRights.None, AutoRescale = true)]
    public class mRSIhccclc : Indicator
    {
        [Parameter("Period RSI (9)", DefaultValue = 9)]
        public int inpPeriodRSI { get; set; }

        [Output("RSI HC", LineColor = "Green", PlotType = PlotType.Line, LineStyle = LineStyle.Solid, Thickness = 1)]
        public IndicatorDataSeries outRSIhc { get; set; }
        [Output("RSI CC", LineColor = "Black", PlotType = PlotType.Line, LineStyle = LineStyle.Solid, Thickness = 1)]
        public IndicatorDataSeries outRSIcc { get; set; }
        [Output("RSI LC", LineColor = "Red", PlotType = PlotType.Line, LineStyle = LineStyle.Solid, Thickness = 1)]
        public IndicatorDataSeries outRSIlc { get; set; }

        private IndicatorDataSeries _hc, _cc, _lc;
        private RelativeStrengthIndex _rsihc, _rsicc, _rsilc;


        protected override void Initialize()
        {
            _hc = CreateDataSeries();
            _cc = CreateDataSeries();
            _lc = CreateDataSeries();
            _rsihc = Indicators.RelativeStrengthIndex(_hc, inpPeriodRSI);
            _rsicc = Indicators.RelativeStrengthIndex(_cc, inpPeriodRSI);
            _rsilc = Indicators.RelativeStrengthIndex(_lc, inpPeriodRSI);
        }

        public override void Calculate(int i)
        {
            _hc[i] = i>1 ? Bars.HighPrices[i] - Bars.ClosePrices[i-1] : Bars.HighPrices[i] - Bars.ClosePrices[i];
            _cc[i] = i>1 ? Bars.ClosePrices[i] - Bars.ClosePrices[i-1] : Bars.ClosePrices[i] - Bars.TypicalPrices[i];
            _lc[i] = i>1 ? Bars.LowPrices[i] - Bars.ClosePrices[i-1] : Bars.LowPrices[i] - Bars.ClosePrices[i];

            outRSIhc[i] = _rsihc.Result[i] - 50.0;
            outRSIcc[i] = _rsicc.Result[i] - 50.0;
            outRSIlc[i] = _rsilc.Result[i] - 50.0;
        }
    }
}
mfejza
Joined on 25.01.2022
- Distribution: Free
- Language: C#
- Trading platform: cTrader Automate
- File name: mRSIhccclc.algo
- Rating: 5
- Installs: 624
