Description
The Directional Movement Index (DMI) is an indicator developed by J. Welles Wilder in 1978 that identifies the direction in which the price of an asset is moving. The indicator does this by comparing prior highs and lows and drawing two lines: a positive directional movement line (+DI) and a negative directional movement line (-DI). An optional third line, called the average directional index (ADX), can also be used to gauge the strength of the uptrend or downtrend.
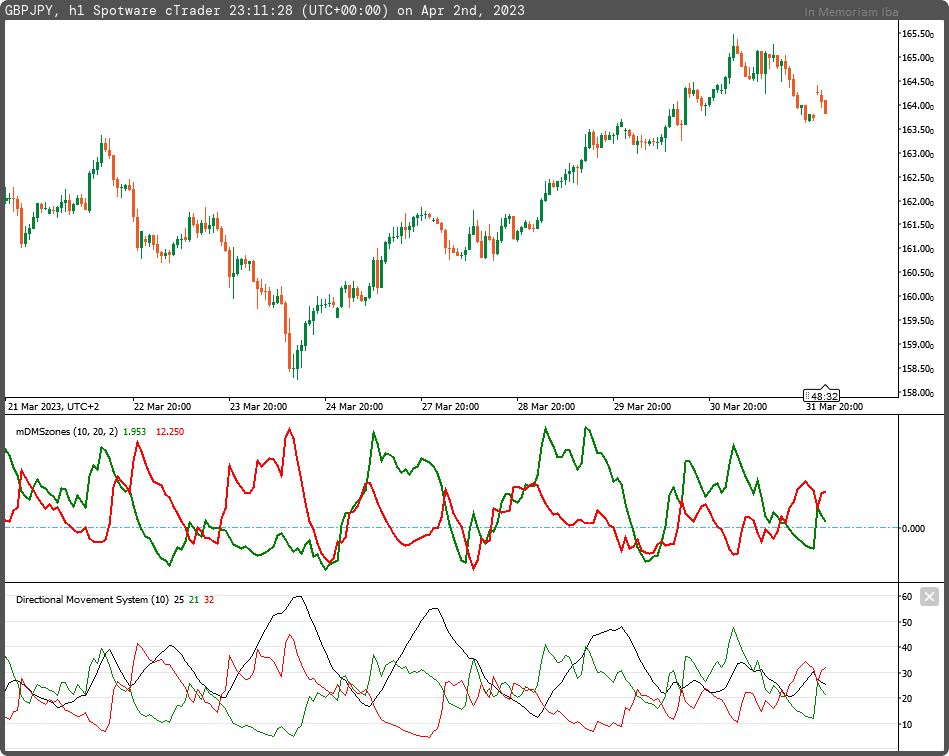
When +DI is above -DI, there is more upward pressure than downward pressure on the price. Conversely, if -DI is above +DI, then there is more downward pressure on the price. This indicator may help traders assess the trend direction. Crossovers between the lines are also sometimes used as trade signals to buy or sell.
This version of DMI describes the pressure of buyers and sellers more efficiently, capturing the trading zones of strong buyers and weak sellers and vice versa, as compared to a lower standard deviation value.
Strong buyers and weak sellers are described when the indicator's green component (DI+) is above zero, and the red component (DI-) is below zero.
Strong sellers and weak buyers are described when the indicator's red component (DI-) is above zero, and the green component (DI+) is below zero.
using System;
using cAlgo.API;
using cAlgo.API.Internals;
using cAlgo.API.Indicators;
using cAlgo.Indicators;

namespace cAlgo
{
    [Levels(0)]
    [Indicator(IsOverlay = false, TimeZone = TimeZones.UTC, AccessRights = AccessRights.None)]
    public class mDMSzones : Indicator
    {
        [Parameter("DMS Period (10)", DefaultValue = 10)]
        public int inpPeriod { get; set; }
        [Parameter("Bands Period (20)", DefaultValue = 20)]
        public int inpBandsPeriod { get; set; }
        [Parameter("Bands Deviation (2.0)", DefaultValue = 2.0)]
        public double inpBandsStdDev { get; set; }

        [Output("DMS Bulls", LineColor = "Green", PlotType = PlotType.Line, LineStyle = LineStyle.Solid, Thickness = 2)]
        public IndicatorDataSeries outDMSbulls { get; set; }
        [Output("DMS Bears", LineColor = "Red", PlotType = PlotType.Line, LineStyle = LineStyle.Solid, Thickness = 2)]
        public IndicatorDataSeries outDMSbears { get; set; }

        private DirectionalMovementSystem _dms;
        private BollingerBands _bb;


        protected override void Initialize()
        {
            _dms = Indicators.DirectionalMovementSystem(inpPeriod);
            _bb = Indicators.BollingerBands(_dms.ADX, inpBandsPeriod, inpBandsStdDev, MovingAverageType.Simple);
        }

        public override void Calculate(int i)
        {
            outDMSbulls[i] = _dms.DIPlus[i] - _bb.Bottom[i];
            outDMSbears[i] = _dms.DIMinus[i] - _bb.Bottom[i];
        }
    }
}
mfejza
Joined on 25.01.2022
- Distribution: Free
- Language: C#
- Trading platform: cTrader Automate
- File name: mDMSzones.algo
- Rating: 5
- Installs: 594
