RJM1
24 Feb 2024, 05:56
( Updated at: 24 Feb 2024, 05:58 )
Hello,
Maybe this will help you, press ctrl, click and drag your mouse to select the area you want. The indicator will then choose the highest high and lowest low in your selection area and produce a Fib Retracement. If you want to reset, press ctrl and click and you will see the option to Reset Fib. Because it is an indicator, it's a visual overlay and you will not be able to click the Fib as you normally would after drawing it, and it will vanish if you change timeframes.
I added 500 candles back and forward, hopefully this will assist you.
—> Copy the script below into a new indicator, then load the indicator like any other.
using System; using cAlgo.API; using cAlgo.API.Internals; using cAlgo.API.Indicators; using cAlgo.Indicators; using System.Collections.Generic; using System.Linq;
namespace cAlgo { [Indicator(IsOverlay = true, TimeZone = TimeZones.UTC, AccessRights = AccessRights.None)] public class AutoDrawings : Indicator { [Parameter("Drawings Color", DefaultValue = "Black")] public string DrawingsColor { get; set; }
// Extend lines far to the left and right int extendToLeftBarIndex = 0; int extendToRightBarIndex = Bars.ClosePrices.Count + 500;
bool isLowToHigh = point1.Price < point2.Price;
foreach (var lev in DefaultFiboLevels) { double dev; if (isLowToHigh) { dev = point1.Price + (1 - lev / 100) * distance; } else { dev = point2.Price + lev / 100 * distance; }
var lineName = name + lev + "%"; var textName = name + lev + "% text";
// Adjust the drawing to extend left and right var line = Chart.DrawTrendLine(lineName, extendToLeftBarIndex, dev, extendToRightBarIndex, dev, DrawingsColor); line.LineStyle = LineStyle.Dots;
// Optionally, adjust label positions if needed Chart.DrawText(textName, lev + "%", point2.BarIndex + 10, dev, DrawingsColor);
private ChartRectangle CreateDragRectangle(DateTime time) { var rect = Chart.DrawRectangle("DragRectangle", time, Chart.TopY, time, Chart.BottomY, SelectionleColor); rect.IsFilled = true; return rect; }
public override void Calculate(int index) { } }
class ChartPoint { public ChartPoint(int barIndex, double price) { BarIndex = barIndex; Price = price; }
public int BarIndex { get; private set; } public double Price { get; private set; } }
class ChartPoints { public ChartPoints(ChartPoint point1, ChartPoint point2) { Point1 = point1; Point2 = point2; }
public ChartPoint Point1 { get; private set; } public ChartPoint Point2 { get; private set; } } }
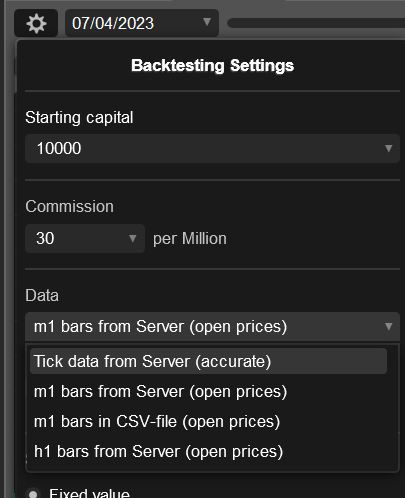
So sorry mate its very very simple, my limit order target pips for my bot is 1 pip and when I run the bot live I usually get around 1 pip successful trade results. However I also get more losing trades in terms of amounts than winners so the bots lose. But on backtest I never get the 1 pip target but usually get 4 pips of more and get a lot more winners than losers!
The target pips for my limit orders is only 1 pip and on live the winning orders are around the 1 pip amount. But on the backtesting the limit orders take much more than that. This might be caused by there being a lot less data on backtesting than on live?
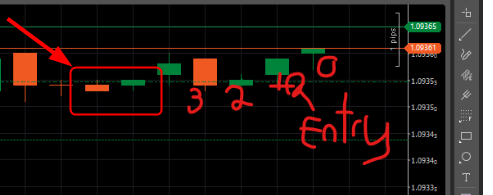
As far as I can see, the trade was taken three bars ago. Therefore these are the bars you should be looking at
I have been changing the code and testing it in the back tester and as far as I can tell for some reason the trades are entered late after the pattern has appeared and I'm not understanding why . Even just using this code : // returns true if bullish pullback private bool IsBullishPullBack() {
} And nothing else when looking to open trades it still enters the trades late
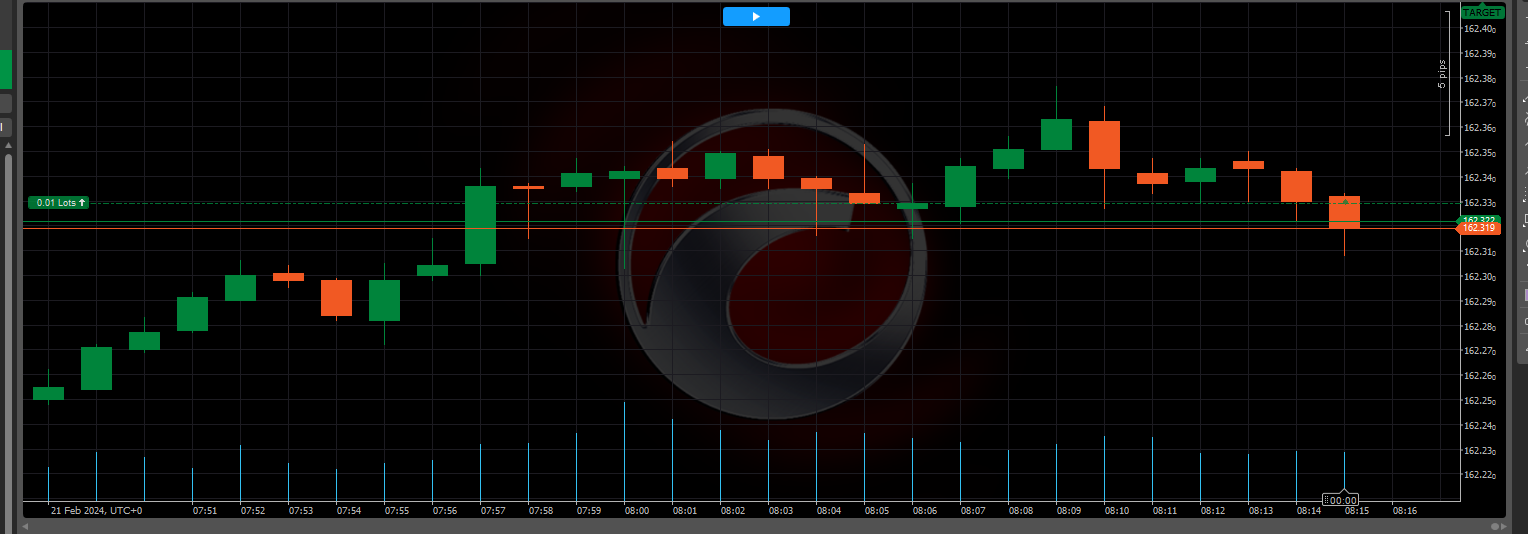
Here is an example on the live market , why did it take this trade ? I don't understand cause the pattern isn't there . Whats going on ? This order was made on 8:15 so I know that the pattern isn't there during that time and that its not possible for it to be an old oder.
Hello, hopefully I can help a little bit.
Delete: AOpen2 > ALow3. <---- because this factor is already confirmed with: AClose3 < AOpen2 (I found it easier to follow the flow as: AOpen2 > AClose3).
Changed: AClose2 >= AOpen3 <---- Why not just make it AClose2 >= AOpen2, because: AOpen2 > AClose3 ensures the intended outcome.
(AClose3 < AClose4) && /// Bearish candle
AOpen2 > AClose3 && AClose2 >= AOpen2 && /// Bullish/spinner candle with gap
RJM1
24 Feb 2024, 05:56 ( Updated at: 24 Feb 2024, 05:58 )
Hello,
Maybe this will help you, press ctrl, click and drag your mouse to select the area you want. The indicator will then choose the highest high and lowest low in your selection area and produce a Fib Retracement. If you want to reset, press ctrl and click and you will see the option to Reset Fib. Because it is an indicator, it's a visual overlay and you will not be able to click the Fib as you normally would after drawing it, and it will vanish if you change timeframes.
I added 500 candles back and forward, hopefully this will assist you.
—> Copy the script below into a new indicator, then load the indicator like any other.
using System;
using cAlgo.API;
using cAlgo.API.Internals;
using cAlgo.API.Indicators;
using cAlgo.Indicators;
using System.Collections.Generic;
using System.Linq;
namespace cAlgo
{
[Indicator(IsOverlay = true, TimeZone = TimeZones.UTC, AccessRights = AccessRights.None)]
public class AutoDrawings : Indicator
{
[Parameter("Drawings Color", DefaultValue = "Black")]
public string DrawingsColor { get; set; }
[Parameter("Selection Color", DefaultValue = "Cyan")]
public string SelectionleColor { get; set; }
ChartRectangle SelectRectangle;
int SelectedStartBarIndex;
int SelectedEndBarIndex;
List<double> DefaultFiboLevels = new List<double>
{
-23.6,
0.0,
23.6,
38.0,
50.0,
61.8,
78.6,
100,
123.6
};
ControlBase DrawingDialog;
List<string> drawnFibObjects = new List<string>();
protected override void Initialize()
{
Chart.MouseDown += Chart_MouseDown;
Chart.MouseUp += Chart_MouseUp;
Chart.MouseMove += Chart_MouseMove;
CreateDrawingDialog();
}
private void CreateDrawingDialog()
{
var stackPanel = new StackPanel
{
VerticalAlignment = VerticalAlignment.Top,
HorizontalAlignment = HorizontalAlignment.Left,
Orientation = Orientation.Vertical,
IsVisible = false,
Width = 160,
BackgroundColor = "#707070"
};
var fibonacciRetracementButton = new Button
{
Text = "Fibonacci Retracement",
HorizontalContentAlignment = HorizontalAlignment.Left
};
var resetButton = new Button
{
Text = "Reset Fibonacci",
HorizontalContentAlignment = HorizontalAlignment.Left
};
resetButton.Click += ResetButton_Click;
stackPanel.AddChild(resetButton);
fibonacciRetracementButton.Click += FibonacciRetracementButton_Click;
stackPanel.AddChild(fibonacciRetracementButton);
DrawingDialog = stackPanel;
Chart.AddControl(DrawingDialog);
}
private void ResetButton_Click(ButtonClickEventArgs obj)
{
foreach (var objectName in drawnFibObjects)
{
Chart.RemoveObject(objectName);
}
drawnFibObjects.Clear();
}
private void FibonacciRetracementButton_Click(ButtonClickEventArgs obj)
{
var extremums = GetHighLowInSelection();
var name = $"Fibonacci Retracement [Auto Drawing] {DateTime.Now:dd.MM.yy HH:mm:ss.zzz}";
var point1 = extremums.Point1.BarIndex < extremums.Point2.BarIndex ? extremums.Point1 : extremums.Point2;
var point2 = extremums.Point1.BarIndex < extremums.Point2.BarIndex ? extremums.Point2 : extremums.Point1;
double distance = Math.Abs(point2.Price - point1.Price);
// Extend lines far to the left and right
int extendToLeftBarIndex = 0;
int extendToRightBarIndex = Bars.ClosePrices.Count + 500;
bool isLowToHigh = point1.Price < point2.Price;
foreach (var lev in DefaultFiboLevels)
{
double dev;
if (isLowToHigh)
{
dev = point1.Price + (1 - lev / 100) * distance;
}
else
{
dev = point2.Price + lev / 100 * distance;
}
var lineName = name + lev + "%";
var textName = name + lev + "% text";
// Adjust the drawing to extend left and right
var line = Chart.DrawTrendLine(lineName, extendToLeftBarIndex, dev, extendToRightBarIndex, dev, DrawingsColor);
line.LineStyle = LineStyle.Dots;
// Optionally, adjust label positions if needed
Chart.DrawText(textName, lev + "%", point2.BarIndex + 10, dev, DrawingsColor);
drawnFibObjects.Add(lineName);
drawnFibObjects.Add(textName);
}
CloseDrawingDialog();
}
private ChartPoints GetHighLowInSelection()
{
var priceMax = double.MinValue;
var priceMin = double.MaxValue;
int barIndexMin = -1;
int barIndexMax = -1;
for (int i = SelectedStartBarIndex; i <= SelectedEndBarIndex; i++)
{
var high = Bars.HighPrices[i];
var low = Bars.LowPrices[i];
if (high > priceMax)
{
priceMax = high;
barIndexMax = i;
}
if (low < priceMin)
{
priceMin = low;
barIndexMin = i;
}
}
var maximum = new ChartPoint(barIndexMax, priceMax);
var minimum = new ChartPoint(barIndexMin, priceMin);
return new ChartPoints(minimum, maximum);
}
private void Chart_MouseMove(ChartMouseEventArgs obj)
{
if (SelectRectangle == null)
return;
SelectRectangle.Time2 = obj.TimeValue;
}
private void Chart_MouseDown(ChartMouseEventArgs obj)
{
if (DrawingDialog.IsVisible)
{
CloseDrawingDialog();
}
if (obj.CtrlKey == false)
return;
Chart.IsScrollingEnabled = false;
SelectRectangle = CreateDragRectangle(obj.TimeValue);
}
private void Chart_MouseUp(ChartMouseEventArgs obj)
{
Chart.IsScrollingEnabled = true;
if (SelectRectangle != null)
{
SetSelectedStartEndIndex(SelectRectangle);
Chart.RemoveObject(SelectRectangle.Name);
SelectRectangle = null;
if (SelectedStartBarIndex >= 0 && SelectedEndBarIndex >= 0)
{
OpenDrawingDialog(obj.MouseX, obj.MouseY);
}
}
}
private void SetSelectedStartEndIndex(ChartRectangle rectangle)
{
var index1 = Bars.OpenTimes.GetIndexByTime(rectangle.Time1);
var index2 = Bars.OpenTimes.GetIndexByTime(rectangle.Time2);
SelectedStartBarIndex = Math.Min(index1, index2);
SelectedEndBarIndex = Math.Max(index1, index2);
}
private void OpenDrawingDialog(double mouseX, double mouseY)
{
DrawingDialog.IsVisible = true;
var left = Chart.Width - mouseX > 160 ? mouseX : mouseX - 160;
var right = Chart.Height - mouseY > 100 ? mouseY : mouseY - 100;
DrawingDialog.Margin = new Thickness(left, right, 0, 0);
}
private void CloseDrawingDialog()
{
DrawingDialog.IsVisible = false;
}
private ChartRectangle CreateDragRectangle(DateTime time)
{
var rect = Chart.DrawRectangle("DragRectangle", time, Chart.TopY, time, Chart.BottomY, SelectionleColor);
rect.IsFilled = true;
return rect;
}
public override void Calculate(int index)
{
}
}
class ChartPoint
{
public ChartPoint(int barIndex, double price)
{
BarIndex = barIndex;
Price = price;
}
public int BarIndex { get; private set; }
public double Price { get; private set; }
}
class ChartPoints
{
public ChartPoints(ChartPoint point1, ChartPoint point2)
{
Point1 = point1;
Point2 = point2;
}
public ChartPoint Point1 { get; private set; }
public ChartPoint Point2 { get; private set; }
}
}
@RJM1