Thank you for your patience and understanding. I was pulling from the bars of the time counter. I had a reservation about the time counter display. Thank you very much again.
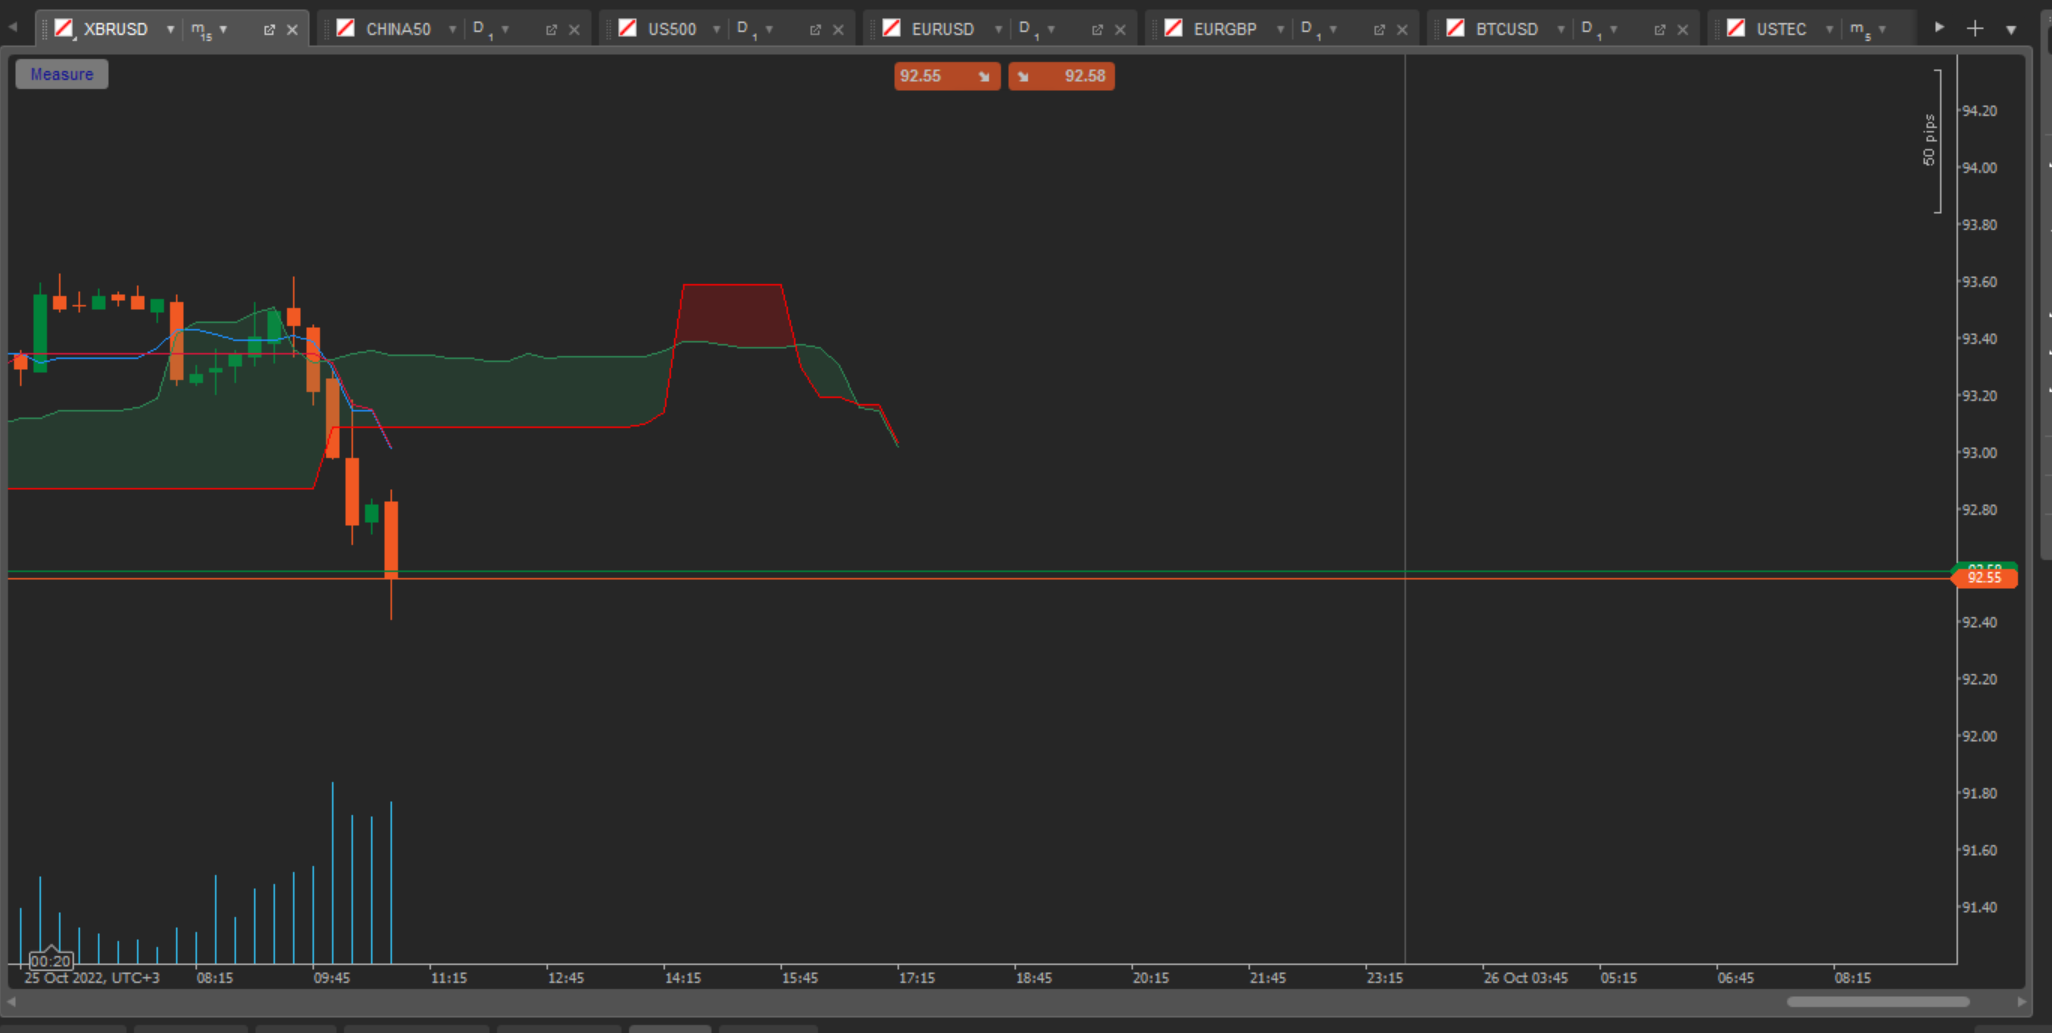
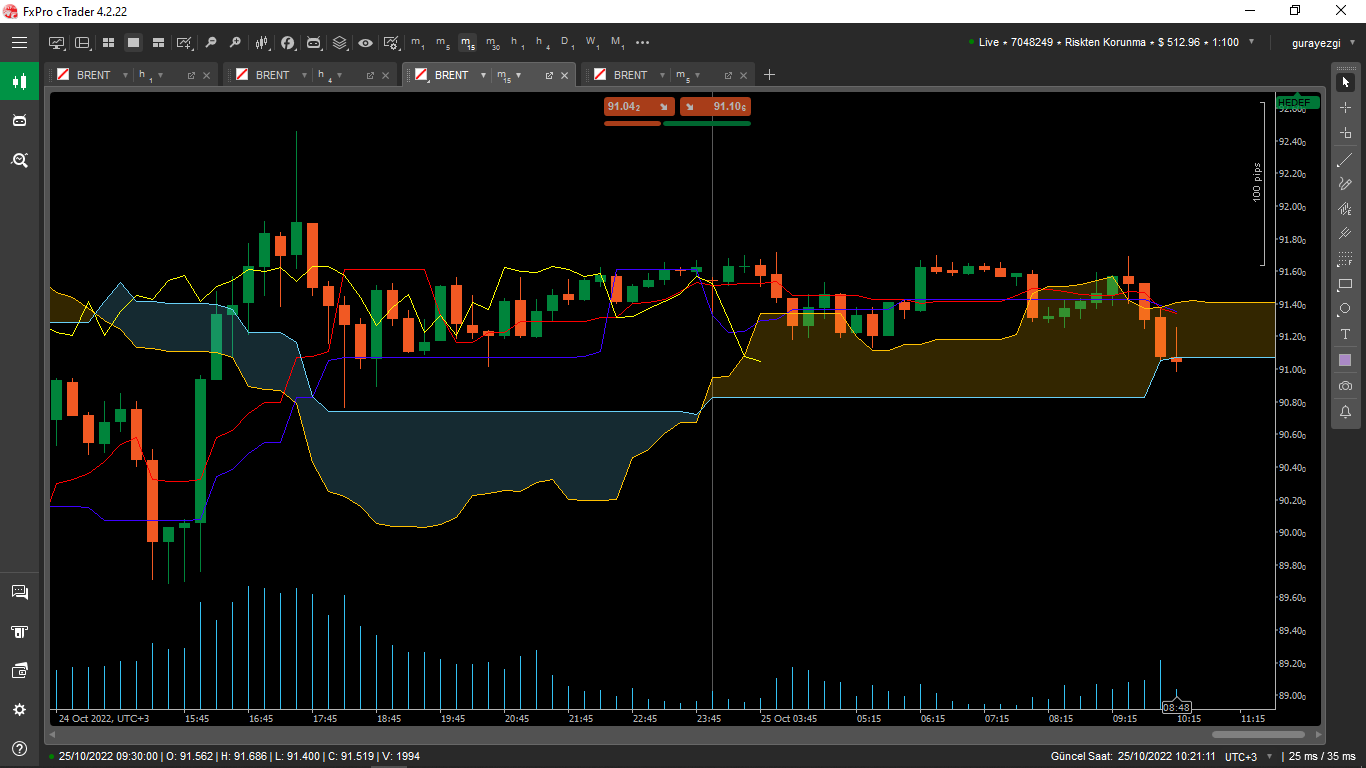
Both charts are in the same time frame. To see the cloud fully, I need to scale down to the 1st chart scale (from the time bar- 09:10, 09:15 ...). At the 2nd chart scale I want to work with, I am already at the last limit that can be drawn from the time counter (not the time bar).
Both charts are in the same time frame. To see the cloud fully, I need to scale down to the 1st chart scale (from the time bar- 09:10, 09:15 ...). At the 2nd chart scale I want to work with, I am already at the last limit that can be drawn from the time counter (not the time bar).
Hi, Thank you for the answer. I wrote what you said " The ichimoku cloud only appears full, when I make the graphics scale too small " . I want to be able to see it at the scale I'm comfortable working with.

 gurayezgi said:

gurayezgi
05 Oct 2023, 06:40
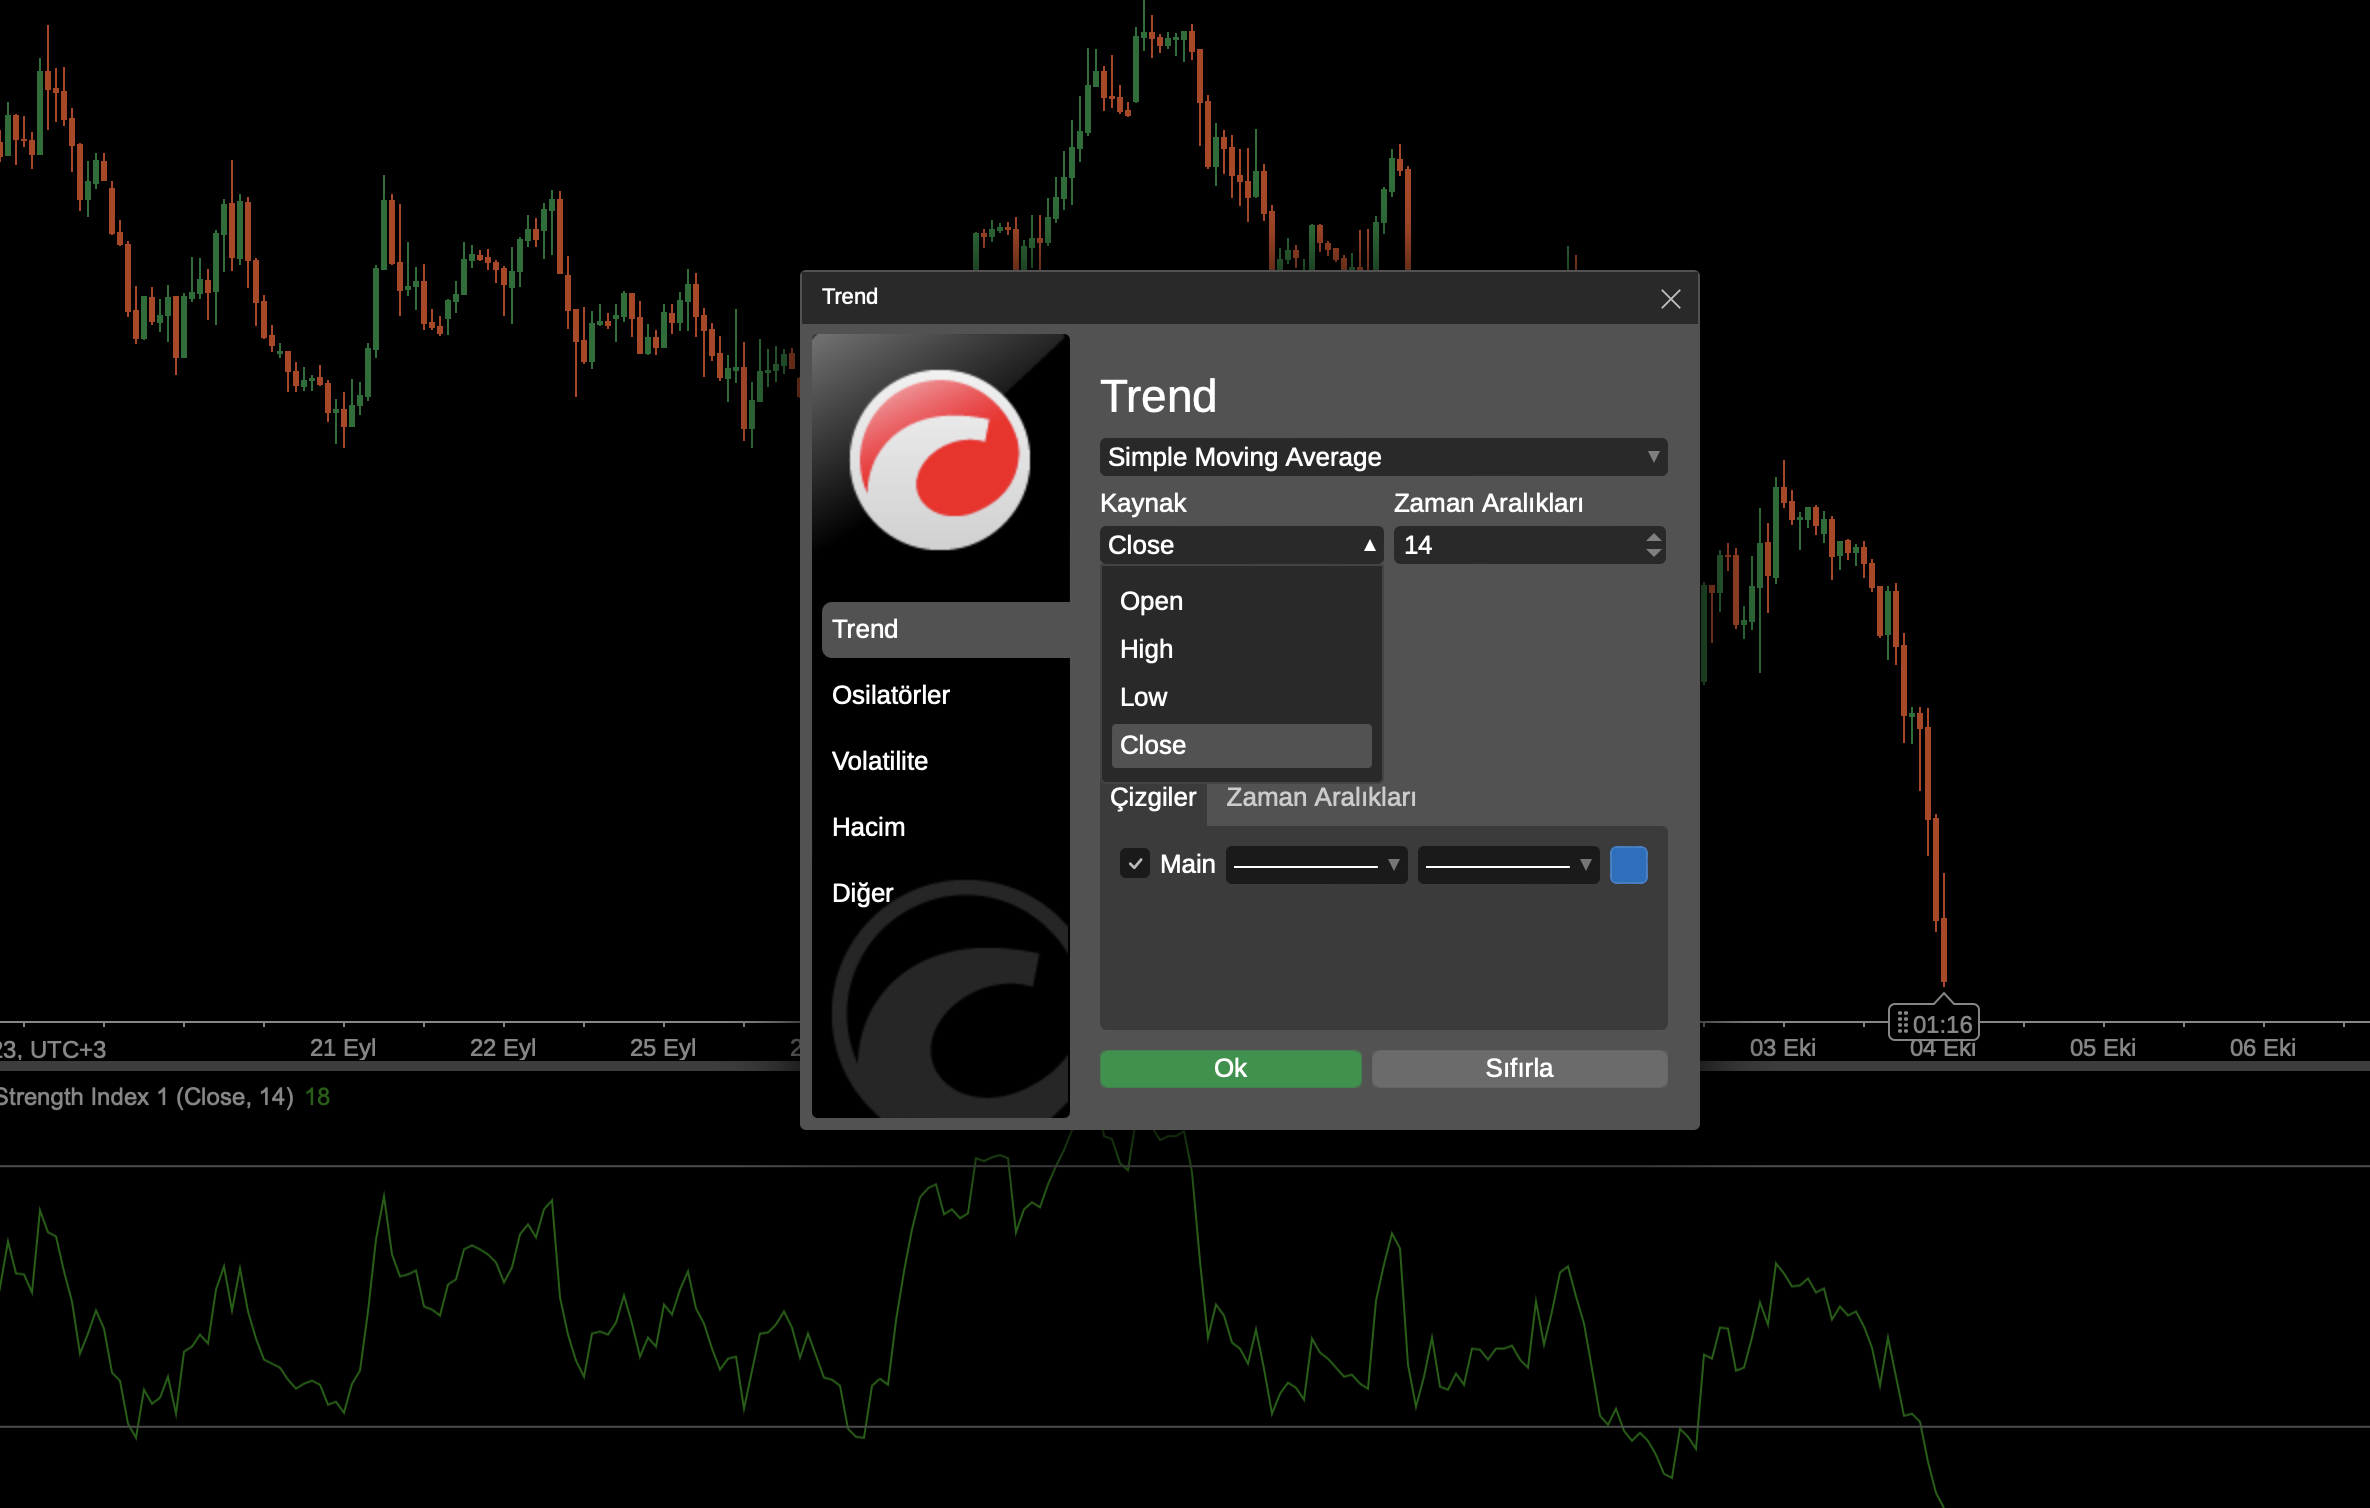
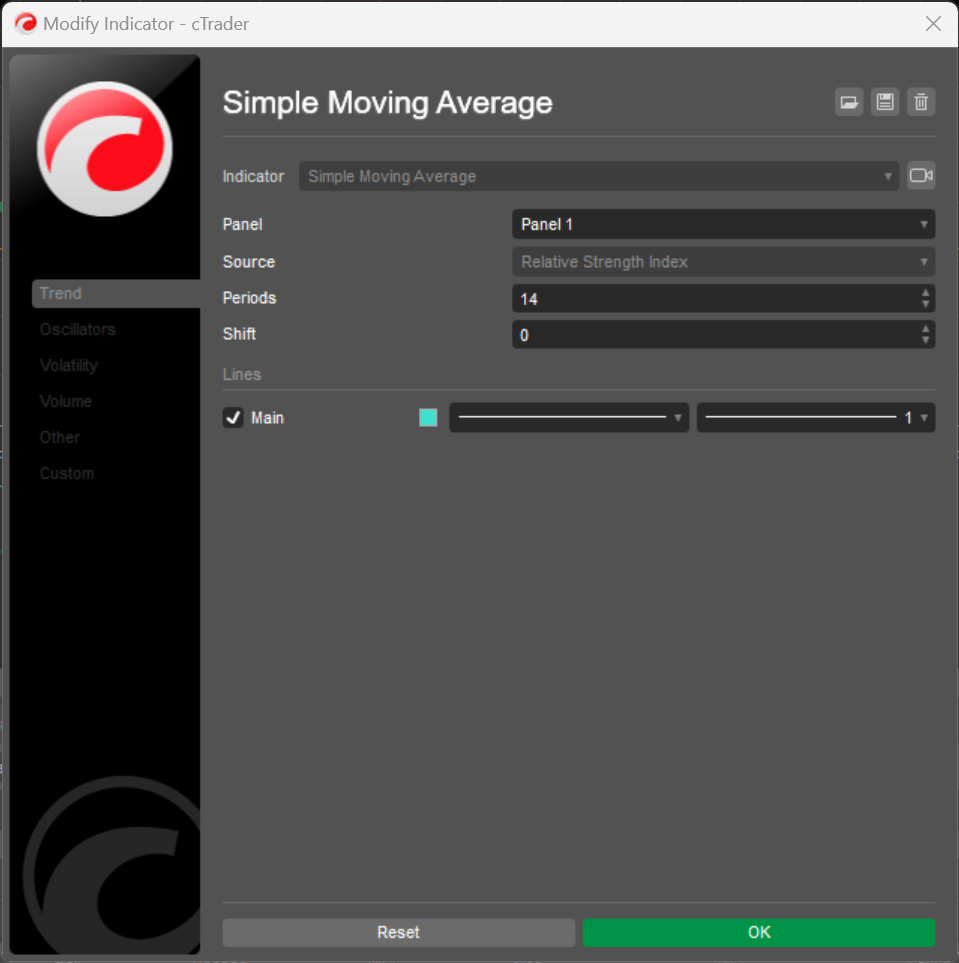
RE: Can't draw SMA on RSI
PanagiotisChar said:
Thank you for your efforts to help.
@gurayezgi