Topics
Replies
IRCtrader
17 May 2023, 18:49
RE:
thanks. it works.
i have a problem with pip.value
it sometimes return 0.
i check it in different broker and i see this more in roboforex. they could do that or it is a bug?
to fix that i have to change account in other broker and return to my main account to works.
i use this formual in aw manager(percent).
PanagiotisChar said:
Hi there,
You need to use the Symbol.PipValue and multiply it by the position's volume to find out how much your net profit changes for each pip move. Then based on the net amount you want to risk, you need to calculate the relevant amount of pips.
Need help? Join us on Telegram
Need premium support? Trade with us
@IRCtrader
IRCtrader
08 May 2023, 18:18
RE:
percent of profit or stoploss
Netprofit exactly
PanagiotisChar said:
Hi there,
Percent of what exactly?
Need help? Join us on Telegram
Need premium support? Trade with us
@IRCtrader
IRCtrader
05 Jan 2023, 12:48
( Updated at: 21 Dec 2023, 09:23 )
RE:
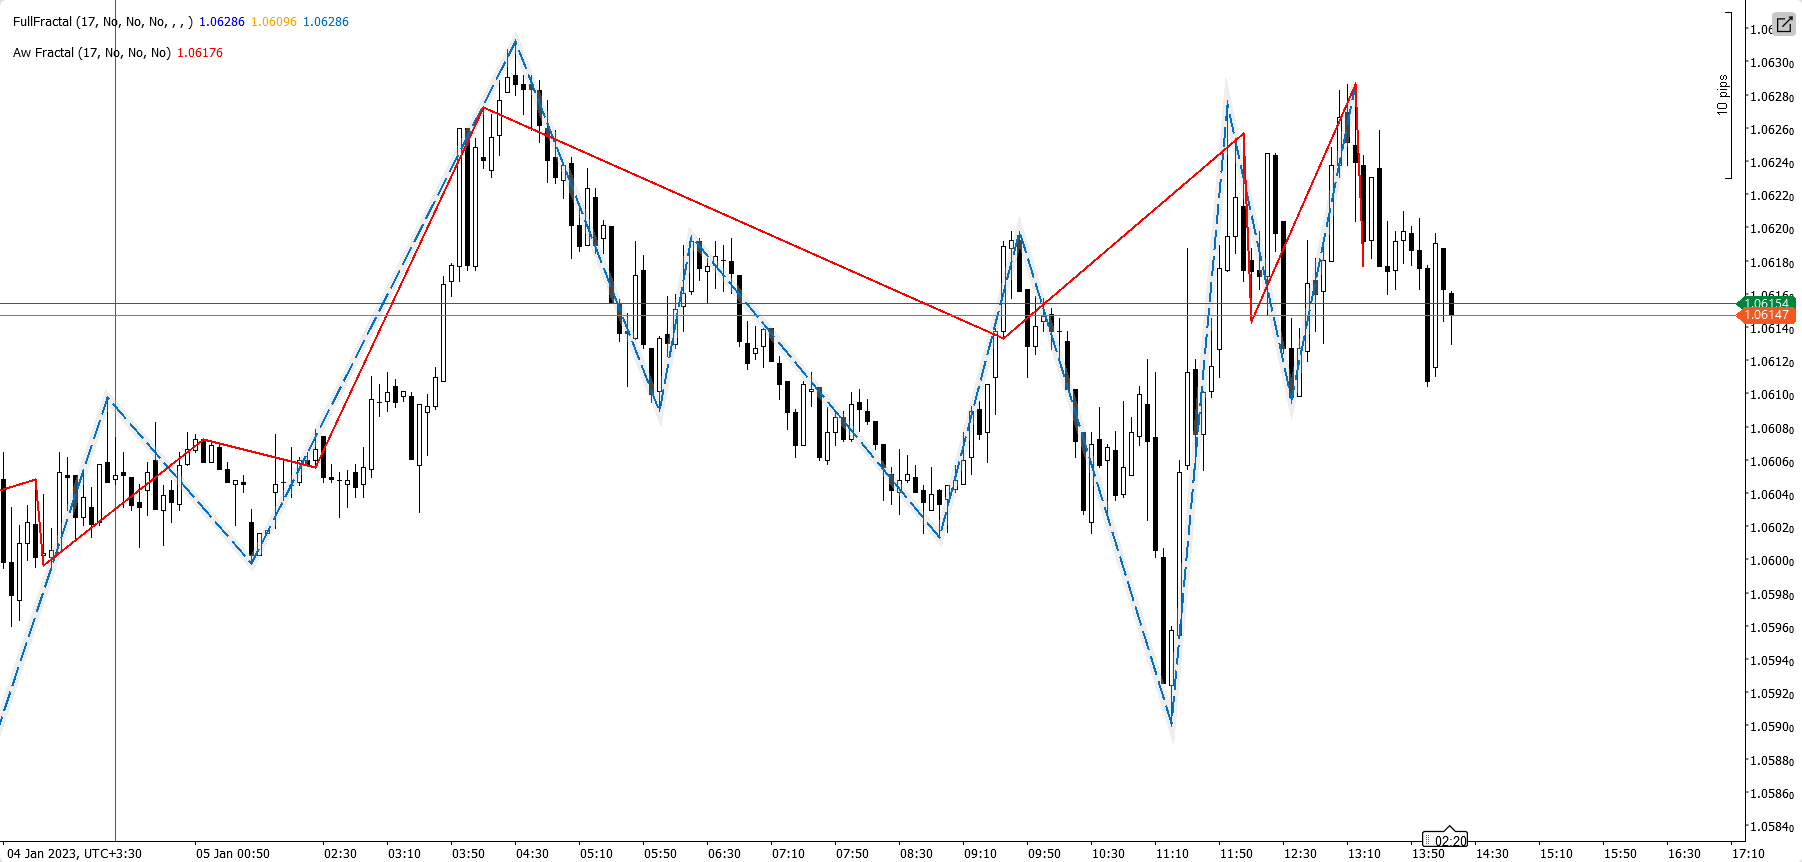
it shows wrong fractal based fractal fomula
Blue line is correct fractal
but my code show red line.
i think DrawUpFractal() and DrawDownFractal() have problems.
PanagiotisChar said:
Hi there,
I cannot understand the problem. Can you explain the issue better?
Need help? Join us on Telegram
Need premium support? Trade with us
@IRCtrader
IRCtrader
02 Sep 2022, 01:23
( Updated at: 21 Dec 2023, 09:22 )
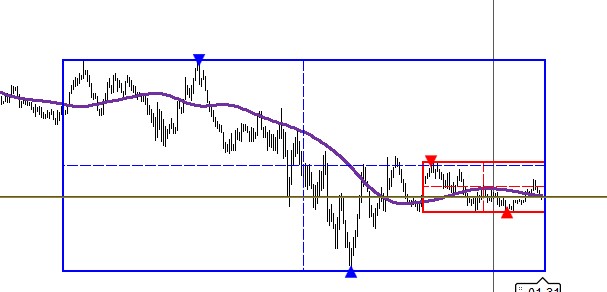
RE: SHOW arrow in max and min candle in period
using System;
using cAlgo.API;
using cAlgo.API.Internals;
using cAlgo.API.Indicators;
using cAlgo.Indicators;
using System.Collections.Generic;
using System.Linq;

namespace cAlgo
{
    [Indicator(IsOverlay = true, TimeZone = TimeZones.UTC, AccessRights = AccessRights.None)]
    public class AWBoxLiveTime : Indicator
    {

        [Parameter("Period", DefaultValue = 10, MinValue = 1, Group = "Rectangle")]
        public int Period { get; set; }
        [Parameter("Color", DefaultValue = "Red", Group = "Rectangle")]
        public string Color { get; set; }
        [Parameter("LineStyle", DefaultValue = LineStyle.Solid, Group = "Rectangle")]
        public LineStyle ls { get; set; }
        [Parameter("Thickness", DefaultValue = 2, Group = "Rectangle")]
        public int Thickness { get; set; }

        [Parameter("Mid Line", DefaultValue = true, Group = "Mid Line")]
        public bool Midline { get; set; }
        [Parameter("Mid Line Color", DefaultValue = "Red", Group = "Mid Line")]
        public string Color2 { get; set; }
        [Parameter("Mid Line Style", DefaultValue = LineStyle.Lines, Group = "Mid Line")]
        public LineStyle ls2 { get; set; }
        [Parameter("Mid Line Thickness", DefaultValue = 1, Group = "Mid Line")]
        public int Thickness2 { get; set; }
        [Parameter("Mid Time Line", DefaultValue = true, Group = "Mid Line")]
        public bool MidTimeline { get; set; }


        protected override void Initialize()
        {


        }

        public override void Calculate(int index)
        {

            var rectangle = Chart.DrawRectangle("rectangle_sample", Bars.Count, Bars.LowPrices.Minimum(Period), Chart.LastVisibleBarIndex - Period, Bars.HighPrices.Maximum(Period), Color);
            rectangle.IsInteractive = false;
            rectangle.IsFilled = false;
            rectangle.LineStyle = ls;
            rectangle.Thickness = Thickness;
            Chart.DrawIcon("iconName", ChartIconType.DownTriangle,GetHighLowInSelection().Point2.BarIndex, Bars.HighPrices.Maximum(Period), Color2);
            Chart.DrawIcon("iconName2", ChartIconType.UpTriangle,GetHighLowInSelection().Point1.BarIndex, Bars.LowPrices.Minimum(Period), Color2);

            if (Midline)
            {
                var trendLine = Chart.DrawTrendLine("trendLine", Chart.LastVisibleBarIndex + 1, (Bars.LowPrices.Minimum(Period) + Bars.HighPrices.Maximum(Period)) / 2, Chart.LastVisibleBarIndex - Period, (Bars.LowPrices.Minimum(Period) + Bars.HighPrices.Maximum(Period)) / 2, Color2, Thickness2, ls2);
            }
            if (MidTimeline)
            {
                var trendLine1 = Chart.DrawTrendLine("TimeLine",(Chart.LastVisibleBarIndex+Chart.LastVisibleBarIndex - Period)/2,Bars.HighPrices.Maximum(Period),(Chart.LastVisibleBarIndex+Chart.LastVisibleBarIndex - Period)/2,Bars.LowPrices.Minimum(Period), Color2, Thickness2, ls2);
            }


        }
         private ChartPoints GetHighLowInSelection()
        {
            var priceMax = double.MinValue;
            var priceMin = double.MaxValue;
            int barIndexMin = -1;
            int barIndexMax = -1;
            for (int i = Chart.LastVisibleBarIndex-Period; i <= Chart.LastVisibleBarIndex;i++)
            {
                var high = Bars.HighPrices[i];
                var low = Bars.LowPrices[i];
                if (high > priceMax)
                {
                    priceMax = high;
                    barIndexMax = i;
                }
                if (low < priceMin)
                {
                    priceMin = low;
                    barIndexMin = i;
                }
            }

            var maximum = new ChartPoint(barIndexMax, priceMax);
            var minimum = new ChartPoint(barIndexMin, priceMin);
            return new ChartPoints(minimum, maximum);
        }
        class ChartPoint
    {
        public ChartPoint(int barIndex, double price)
        {
            BarIndex = barIndex;
            Price = price;
        }

        public int BarIndex { get; private set; }
        public double Price { get; private set; }
    }

    class ChartPoints
    {
        public ChartPoints(ChartPoint point1, ChartPoint point2)
        {
            Point1 = point1;
            Point2 = point2;
        }

        public ChartPoint Point1 { get; private set; }
        public ChartPoint Point2 { get; private set; }
    }


    }
}
i fix this but i have a mini problem with distance betwwen arrow and candle. how can i fix it...
i want to add normal space between arrow and line.
@IRCtrader
IRCtrader
08 Jul 2022, 12:32
RE:
PanagiotisCharalampous said:
Hi khoshroomahdi,
You need to be more specific regarding what is not working.
Best Regards,
Panagiotis
Arguments out of range error in logs.
@IRCtrader
IRCtrader
30 May 2022, 18:47
RE:
amusleh said:
Hi,
Try this:
using System;
using cAlgo.API;
using cAlgo.API.Internals;
using cAlgo.API.Indicators;
using cAlgo.Indicators;

namespace cAlgo
{
    [Indicator(IsOverlay = true, AccessRights = AccessRights.None)]
    [Cloud("Up Kumo", "Down Kumo", Opacity = 0.2)]
    public class AwIchimoku : Indicator
    {
        [Parameter("Tenkan sen", DefaultValue = 9, MinValue = 1)]
        public int Ten_Period { get; set; }

        [Parameter("Kijun sen", DefaultValue = 26, MinValue = 1)]
        public int K_Period { get; set; }

        [Parameter("Senkou span B", DefaultValue = 52, MinValue = 1)]
        public int SB_Period { get; set; }

        [Output("Tenkan sen", LineStyle = LineStyle.Solid, LineColor = "Red")]
        public IndicatorDataSeries Ten_Result { get; set; }

        [Output("Kijun sen", LineStyle = LineStyle.Solid, LineColor = "Blue")]
        public IndicatorDataSeries K_Result { get; set; }

        [Output("Chiku span", LineStyle = LineStyle.Solid, LineColor = "Purple")]
        public IndicatorDataSeries C_Result { get; set; }

        [Output("Up Kumo", LineStyle = LineStyle.Solid, LineColor = "Green")]
        public IndicatorDataSeries Up_Result { get; set; }

        [Output("Down Kumo", LineStyle = LineStyle.Solid, LineColor = "FFFF6666")]
        public IndicatorDataSeries Down_Result { get; set; }

        [Output("Span A", LineStyle = LineStyle.Solid, LineColor = "Green")]
        public IndicatorDataSeries SA_Result { get; set; }

        [Output("Span B", LineStyle = LineStyle.Solid, LineColor = "FFFF6666")]
        public IndicatorDataSeries SB_Result { get; set; }

        private IchimokuKinkoHyo _ICHI;

        protected override void Initialize()
        {
            _ICHI = Indicators.IchimokuKinkoHyo(Ten_Period, K_Period, SB_Period);
        }

        public override void Calculate(int index)
        {
            Ten_Result[index] = _ICHI.TenkanSen[index];
            K_Result[index] = _ICHI.KijunSen[index];
            C_Result[index - 26] = _ICHI.ChikouSpan[index];
            SA_Result[index + 26] = (_ICHI.TenkanSen[index] + _ICHI.KijunSen[index]) / 2;
            SB_Result[index + 26] = _ICHI.SenkouSpanB[index];
            Up_Result[index + 26] = (_ICHI.TenkanSen[index] + _ICHI.KijunSen[index]) / 2;
            Down_Result[index + 26] = _ICHI.SenkouSpanB[index];
        }
    }
}
it doesn't show chico span
@IRCtrader
IRCtrader
13 Jan 2022, 09:29
it's great
now i made an indicator ( aw vline). you could use that.
but it would be great if ctrader implement it as an internal feature
@IRCtrader
IRCtrader
23 Dec 2021, 21:07
RE:
amusleh said:
Hi,
What do you mean by: "i dont' know how to add signal line cross histogram to it?"
Can you show this on a chart screenshot?
Not sure about the exact size of library but if you use the newer version library the size might reduce.
You don't need that library to show a popup alert or play a sound alert.
cTrader automate API has the email and sound alert itself under Notifications: cAlgo API Reference - INotifications Interface (ctrader.com)
i make it. thanks for your amazing library.
it is 10 megabyte with source and i couldn't upload in algorithms.
using cAlgo.API;
using cAlgo.API.Alert;
using cAlgo.API.Indicators;

namespace cAlgo
{
    [Indicator(IsOverlay = false, TimeZone = TimeZones.UTC, AccessRights = AccessRights.FullAccess)]
    public class MacdHistogramAlert : Indicator
    {
        #region Fields

        private MacdHistogram _macdHistogram;

        private int _barIndex;

        #endregion Fields

        #region Parameters

        [Parameter()]
        public DataSeries Source { get; set; }

        [Parameter("Long Cycle", DefaultValue = 26)]
        public int LongCycle { get; set; }

        [Parameter("Short Cycle", DefaultValue = 12)]
        public int ShortCycle { get; set; }

        [Parameter("Signal Periods", DefaultValue = 9)]
        public int Periods { get; set; }

        [Parameter("Histogram Alert", DefaultValue = true)]
        public bool macdh { get; set; }

        [Parameter("Signal Alert", DefaultValue = true)]
        public bool macds { get; set; }
        #endregion Parameters

        #region Outputs

        [Output("Macd Up", LineColor = "Green", PlotType = PlotType.Histogram, Thickness = 2)]
        public IndicatorDataSeries HistogramPositive { get; set; }

        [Output("Macd Down", LineColor = "Red", PlotType = PlotType.Histogram, Thickness = 2)]
        public IndicatorDataSeries HistogramNegative { get; set; }

        [Output("Signal", LineColor = "Blue", LineStyle = LineStyle.Solid, Thickness = 2)]
        public IndicatorDataSeries Signal { get; set; }

        #endregion Outputs

        #region Methods

        protected override void Initialize()
        {
            _macdHistogram = Indicators.MacdHistogram(Source, LongCycle, ShortCycle, Periods);
        }

        public override void Calculate(int index)
        {
            if (_macdHistogram.Histogram[index] > _macdHistogram.Signal[index])
            {
                HistogramPositive[index] = _macdHistogram.Histogram[index];
            }

            if (_macdHistogram.Histogram[index] < _macdHistogram.Signal[index])
            {
                HistogramNegative[index] = _macdHistogram.Histogram[index];
            }

            Signal[index] = _macdHistogram.Signal[index];

            if (macdh)
            {

                if (_macdHistogram.Histogram[index - 2] <= 0 && _macdHistogram.Histogram[index - 1] > 0)
                {
                    TriggerAlert(TradeType.Buy, index);
                }
                else if (_macdHistogram.Histogram[index - 2] >= 0 && _macdHistogram.Histogram[index - 1] < 0)
                {
                    TriggerAlert(TradeType.Sell, index);
                }
            }

            if (macds)
            {

                if (_macdHistogram.Histogram[index - 2] <= _macdHistogram.Signal[index - 2] && _macdHistogram.Histogram[index - 1] > _macdHistogram.Signal[index - 1])
                {
                    TriggerAlert2(TradeType.Buy, index);
                }
                else if (_macdHistogram.Histogram[index - 2] >= _macdHistogram.Signal[index - 2] && _macdHistogram.Histogram[index - 1] < _macdHistogram.Signal[index - 1])
                {
                    TriggerAlert2(TradeType.Sell, index);
                }
            }

        }

        private void TriggerAlert(TradeType tradeType, int index)
        {
            if (_barIndex != index && IsLastBar)
            {
                _barIndex = index;

                string comment = tradeType == TradeType.Buy ? "Histogram is above 0" : "Histogram is below 0";
                Notifications.ShowPopup(TimeFrame, Symbol, tradeType, "MACD Alert", Bars.ClosePrices[index], comment);
            }

        }

        private void TriggerAlert2(TradeType tradeType, int index)
        {
            if (_barIndex != index && IsLastBar)
            {
                _barIndex = index;

                string comment = tradeType == TradeType.Buy ? "Histogram is above signal" : "Histogram is below signal";
                Notifications.ShowPopup(TimeFrame, Symbol, tradeType, "MACD Alert", Bars.ClosePrices[index], comment);
            }

        }

        #endregion Methods
    }
}
@IRCtrader
IRCtrader
22 Dec 2021, 14:24
( Updated at: 22 Dec 2021, 14:27 )
RE:
thanks
amusleh said:
Hi,
Please read API references and check the examples there before asking a question: cAlgo API Reference - ChartHorizontalLine Interface (ctrader.com)
Try this:
using System;
using System.Linq;
using cAlgo.API;

namespace cAlgo
{
    [Robot(TimeZone = TimeZones.UTC, AccessRights = AccessRights.None)]
    public class AWCPDaily : Robot
    {
        private TextBlock tb = new TextBlock();
        private ChartHorizontalLine sll;

        [Parameter("Take Profit", DefaultValue = 100)]
        public double tp { get; set; }

        [Parameter("Stop Profit", DefaultValue = 90)]
        public double sl { get; set; }

        [Parameter("FontSize", DefaultValue = 16, Group = "Text")]
        public int FontSize { get; set; }

        [Parameter("Space to Corner", DefaultValue = 10, Group = "Text")]
        public int Margin { get; set; }

        [Parameter("Horizental Alignment", DefaultValue = HorizontalAlignment.Left, Group = "Text")]
        public HorizontalAlignment HAlignment { get; set; }

        [Parameter("Vertical Alignment", DefaultValue = VerticalAlignment.Top, Group = "Text")]
        public VerticalAlignment VAlignment { get; set; }

        [Parameter("Color", DefaultValue = "Red", Group = "Text")]
        public string Color1 { get; set; }

        [Parameter("Opacity", DefaultValue = 0.7, MinValue = 0.1, MaxValue = 1, Group = "Text")]
        public double Opacity { get; set; }

        [Parameter("Text Alignment", DefaultValue = TextAlignment.Center, Group = "Text")]
        public TextAlignment Alignment { get; set; }

        protected override void OnStart()
        {
            var y = Chart.BottomY + ((Chart.TopY - Chart.BottomY) / 2);

            sll = Chart.DrawHorizontalLine("horizontal", y, Color.Red);

            sll.IsInteractive = true;

            Chart.AddControl(tb);
            tb.Text = "sl : " + sl.ToString() + ", " + "tp : " + tp.ToString() + "\n EQ: " + Account.Equity + ", ML%: " + Account.MarginLevel + "\nVP: " + Account.Margin / Account.Balance + "V: " + sll.Y;
            tb.FontSize = FontSize;
            tb.ForegroundColor = Color1.TrimEnd();
            tb.HorizontalAlignment = HAlignment;
            tb.VerticalAlignment = VAlignment;
            tb.TextAlignment = Alignment;
            tb.Margin = Margin;
            tb.Opacity = Opacity;
        }

        protected override void OnTick()
        {
            foreach (var position in Positions)
            {
                if (Account.Equity > tp || Account.Equity < sl)
                {
                    ClosePositionAsync(position);
                }
            }

            foreach (var order in PendingOrders)
            {
                if (Account.Equity > tp || Account.Equity < sl)
                {
                    CancelPendingOrder(order);
                }
            }
        }
    }
}
You have to set a chart object IsInteractive property to true, then you will be able to change it on the chart.
@IRCtrader
IRCtrader
08 Oct 2021, 10:40
( Updated at: 21 Dec 2023, 09:22 )
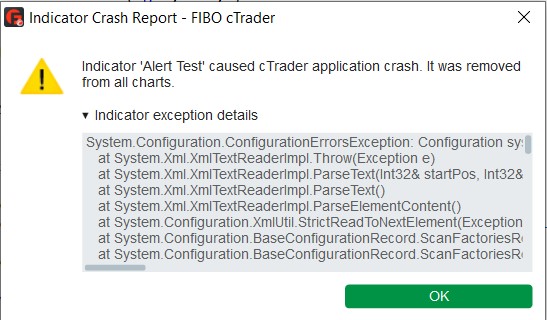
ctrader crashed
tanks for your help
but now when i add this indicator to ctrader. when it want shows pop up trader crash.
@IRCtrader
IRCtrader
06 Oct 2021, 18:03
( Updated at: 06 Oct 2021, 18:26 )
using cAlgo.API;
using cAlgo.API.Alert;
using System;
using cAlgo.API.Alert.Utility;
using cAlgo.API.Indicators;
using cAlgo.Indicators;

namespace cAlgo
{
    [Indicator(IsOverlay = false, TimeZone = TimeZones.UTC, AccessRights = AccessRights.FullAccess)]
    public class AlertTest : Indicator
    {
        public MacdHistogram _Macd;

        [Parameter("source")]
        public DataSeries Source { get; set; }

        [Parameter("Long Cycle 1", DefaultValue = 26)]
        public int LongCycle1 { get; set; }

        [Parameter("Short Cycle 1", DefaultValue = 12)]
        public int ShortCycle1 { get; set; }

        [Parameter("Signal 1", DefaultValue = 9)]
        public int inpSingal1 { get; set; }

        public IndicatorDataSeries Macdup { get; set; }
        [Output("Macd", LineColor = "Red", Thickness = 2, PlotType = PlotType.Histogram)]

        public IndicatorDataSeries Macd { get; set; }

        protected override void Initialize()
        {
            _Macd = Indicators.MacdHistogram(Source, LongCycle1, ShortCycle1, inpSingal1);
        }


        public override void Calculate(int index)
        {

            Macd[index] = _Macd.Histogram[index];
            if (_Macd.Histogram.Last(1) > 0 && _Macd.Histogram.Last(2) <= 0)
            {
                Notifications.ShowPopup(MarketSeries.TimeFrame, Symbol, TradeType.Buy, "AcademyWave.com", Symbol.Bid, "Macd cross Above zero", Server.Time);
            }

            if (_Macd.Histogram.Last(1) < 0 && _Macd.Histogram.Last(2) >= 0)
            {
                Notifications.ShowPopup(MarketSeries.TimeFrame, Symbol, TradeType.Sell, "AcademyWave.com", Symbol.Bid, "Macd cross Below zero", Server.Time);
            }
        }
    }
}
i write this code. but it has lag and show many pop ups.
how could i use close indicator data. not last value.
@IRCtrader
IRCtrader
06 Oct 2021, 17:03
( Updated at: 06 Oct 2021, 17:34 )
finally i get pop up notification in ctrader but with sample code in Github..
with my code i didn't get any pop up yet.
i need help to complete MACD alert indicator.
if you could give me a sample how cross over histogram with zero lever or cross signal line with histogram i could complete this indicator. and after that i could complete other alert indicator for community.
thank in advance
@IRCtrader
IRCtrader
05 Oct 2021, 07:11
RE:
amusleh said:
Hi,
You should reference all DLL files inside Release zip file you downloaded, then it will work.
I strongly recommend you to use Visual Studio and install the alert library via Nuget.
Visual Studio is free, you can download it from here: Visual Studio - Visual Studio (microsoft.com)
is my code correct?
i do this even with visual studio but i didn't get any notification.
@IRCtrader
IRCtrader
12 Aug 2021, 22:04
( Updated at: 21 Dec 2023, 09:22 )
RE:
amusleh said:
Hi,
Try this:
using System;
using cAlgo.API;
using cAlgo.API.Internals;
using cAlgo.API.Indicators;
using cAlgo.Indicators;

namespace cAlgo
{
    [Indicator(IsOverlay = false, TimeZone = TimeZones.UTC, AccessRights = AccessRights.None)]
    public class AWMACDMTF : Indicator
    {
        private StochasticOscillator _stoch;

        private Bars _baseTimeFrameBars;

        // you could change default Value to Minute,Minute15,Hour2 and ...
        [Parameter("Base Timeframe", DefaultValue = "Minute15")]
        public TimeFrame BaseTimeFrame { get; set; }

        [Parameter("K%", DefaultValue = 5)]
        public int kPeriod { get; set; }

        [Parameter("K slowing", DefaultValue = 3)]
        public int kslowing { get; set; }

        [Parameter("D%", DefaultValue = 3)]
        public int dPeriod { get; set; }

        [Output("K%,", LineColor = "Red", LineStyle = LineStyle.Solid, Thickness = 2)]
        public IndicatorDataSeries k_Line { get; set; }

        [Output("D%,", LineColor = "Blue", LineStyle = LineStyle.Solid, Thickness = 2)]
        public IndicatorDataSeries d_Line { get; set; }

        protected override void Initialize()
        {
            _baseTimeFrameBars = MarketData.GetBars(BaseTimeFrame);

            _stoch = Indicators.StochasticOscillator(_baseTimeFrameBars, kPeriod, kslowing, dPeriod, MovingAverageType.Simple);
        }

        public override void Calculate(int index)
        {
            var baseSeriesIndex = _baseTimeFrameBars.OpenTimes.GetIndexByTime(Bars.OpenTimes[index]);
            k_Line[index] = _stoch.PercentK[baseSeriesIndex];
            d_Line[index] = _stoch.PercentD[baseSeriesIndex];
        }
    }
}
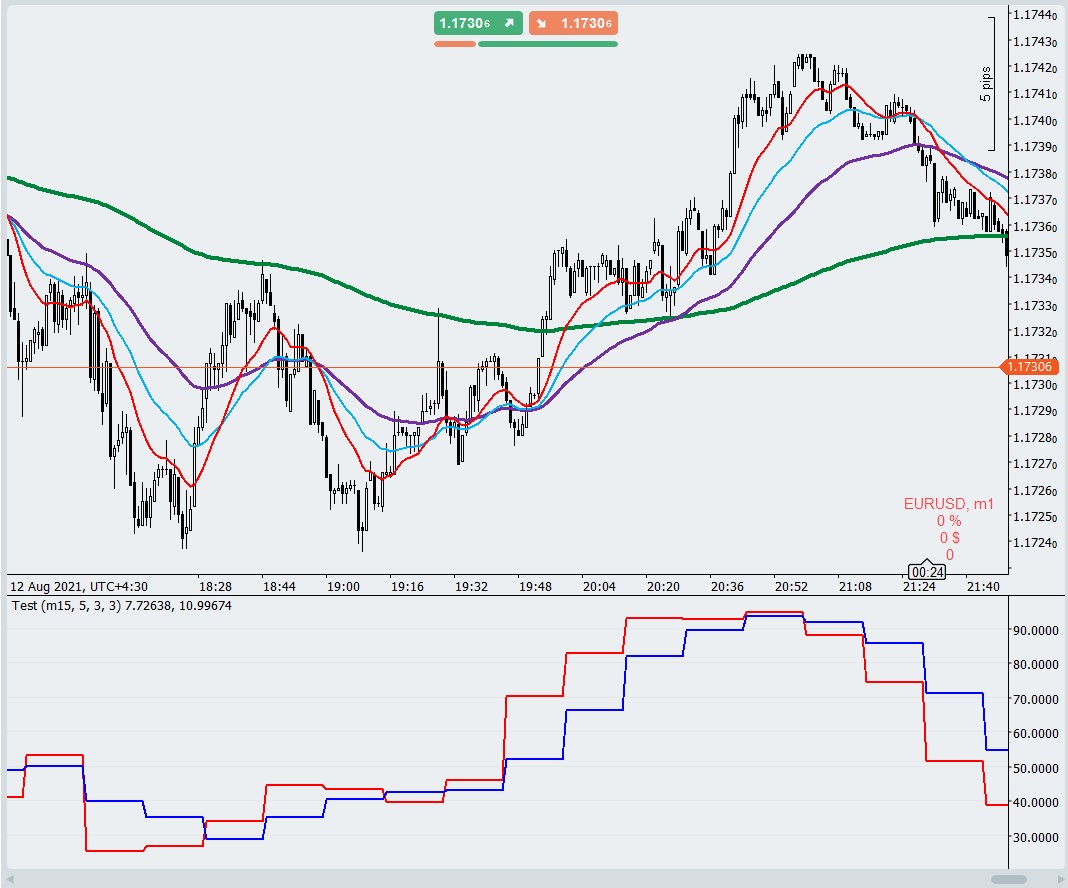
your code is like my code. i want indicotr be like the second picture that i placed in first post.
@IRCtrader
IRCtrader
02 Aug 2021, 16:43
( Updated at: 02 Aug 2021, 16:54 )
RE:
PanagiotisCharalampous said:
Hi khoshroomahdi,
See an example below
using System;
using cAlgo.API;
using cAlgo.API.Internals;
using cAlgo.API.Indicators;
using cAlgo.Indicators;

namespace cAlgo
{
    [Indicator(IsOverlay = false, TimeZone = TimeZones.UTC, AccessRights = AccessRights.None)]
    public class NewIndicator : Indicator
    {
        [Parameter(DefaultValue = true)]
        public bool ShowOnMain { get; set; }


        protected override void Initialize()
        {
            // Initialize and create nested indicators
        }

        public override void Calculate(int index)
        {
            if (ShowOnMain)
                Chart.DrawStaticText("Text", "Text", VerticalAlignment.Top, HorizontalAlignment.Right, Color.Red);
            else
                Chart.IndicatorAreas[0].DrawStaticText("Text", "Text", VerticalAlignment.Top, HorizontalAlignment.Right, Color.Red);

        }
    }
}
Best Regards,
Panagiotis
Join us on Telegram and Facebook
thanks. great answer
@IRCtrader
IRCtrader
02 Aug 2021, 14:25
( Updated at: 02 Aug 2021, 14:26 )
finally i solve it
using cAlgo.API;
using cAlgo.API.Indicators;

namespace cAlgo
{
    [Levels(0)]
    [Indicator(IsOverlay = false, AccessRights = AccessRights.None)]
    public class MACDLine : Indicator
    {
        public MacdHistogram MacdHistogram;

        [Parameter()]
        public DataSeries Source { get; set; }

        [Parameter("Long Cycle", DefaultValue = 26)]
        public int LongCycle { get; set; }

        [Parameter("Short Cycle", DefaultValue = 12)]
        public int ShortCycle { get; set; }

        [Parameter("Signal Periods", DefaultValue = 9)]
        public int Periods { get; set; }


        [Output("Macd Line Up", PlotType = PlotType.DiscontinuousLine, LineColor = "Green", Thickness = 2)]
        public IndicatorDataSeries MacdLineUp { get; set; }

        [Output("Macd Line Dn", PlotType = PlotType.DiscontinuousLine, LineColor = "Red", Thickness = 2)]
        public IndicatorDataSeries MacdLineDn { get; set; }


        bool Mode;


        protected override void Initialize()
        {
            MacdHistogram = Indicators.MacdHistogram(Source, LongCycle, ShortCycle, Periods);
        }

        public override void Calculate(int index)
        {
            if (MacdHistogram.Histogram[index] >= MacdHistogram.Signal[index])
            {

                MacdLineUp[index] = MacdHistogram.Histogram[index];
                if (Mode == true)
                {
                    MacdLineUp[index - 1] = MacdHistogram.Histogram[index - 1];
                    Mode = false;
                }
            }

            else
            {
                MacdLineDn[index] = MacdHistogram.Histogram[index];
                if (Mode == false)
                {
                    MacdLineDn[index - 1] = MacdHistogram.Histogram[index - 1];
                    Mode = true;
                }

            }


        }
    }
}
@IRCtrader
IRCtrader
29 Jul 2021, 10:42
RE:
amusleh said:
Hi,
You can have one line and two outputs, that's exactly what my posted code does.
i mean 1 output line with two color by condition.
could you please explain me why in plottype.point or dicontinueline or histogram, it's fine but plottype.line we have 2 line.
i couldn't underatnd it.
@IRCtrader
IRCtrader
28 Jul 2021, 15:25
RE:
amusleh said:
Hi,
Try this:
using System;
using System.Linq;
using cAlgo.API;
using cAlgo.API.Internals;
using cAlgo.API.Indicators;
using cAlgo.Indicators;

namespace cAlgo
{
    [Indicator(IsOverlay = true, TimeZone = TimeZones.UTC, AccessRights = AccessRights.None)]
    public class AWMultiData : Indicator
    {
        private TextBlock tb = new TextBlock();

        [Parameter("FontSize", DefaultValue = 12)]
        public int FontSize { get; set; }

        [Parameter("Space to Corner", DefaultValue = 10)]
        public int Margin { get; set; }

        [Parameter("Horizental Alignment", DefaultValue = HorizontalAlignment.Right)]
        public HorizontalAlignment HAlignment { get; set; }

        [Parameter("Vertical Alignment", DefaultValue = VerticalAlignment.Bottom)]
        public VerticalAlignment VAlignment { get; set; }

        [Parameter("Color", DefaultValue = "Red")]
        public string Color1 { get; set; }

        [Parameter("Opacity", DefaultValue = 0.7, MinValue = 0.1, MaxValue = 1)]
        public double Opacity { get; set; }

        [Parameter("Text Alignment", DefaultValue = TextAlignment.Center)]
        public TextAlignment Alignment { get; set; }

        protected override void Initialize()
        {
            Chart.AddControl(tb);
        }

        public override void Calculate(int index)
        {
            if (IsLastBar)
                DisplaySpreadOnChart();
        }

        public void DisplaySpreadOnChart()
        {
            // Calc Spread
            var spread = Math.Round(Symbol.Spread / Symbol.PipSize, 2);
            string sp = string.Format("{0}", spread);

            //Calc daily Net Profit
            double DailyNet1 = Positions.Sum(p => p.NetProfit);
            double DailyNet2 = History.Where(x => x.ClosingTime.Date == Time.Date).Sum(x => x.NetProfit);
            double DailyNet = Math.Round(DailyNet1 + DailyNet2, 2);

            var oldTrades = History.Where(x => x.ClosingTime.Date != Time.Date).OrderBy(x => x.ClosingTime).ToArray();

            // get Starting Balance
            double StartingBalance;

            if (oldTrades.Length == 0)
            {
                StartingBalance = History.Count == 0 ? Account.Balance : History.OrderBy(x => x.ClosingTime).First().Balance;
            }
            else
            {
                StartingBalance = oldTrades.Last().Balance;
            }

            //calc Daily Percent Profit

            string DailyPercent = Math.Round(DailyNet / StartingBalance * 100, 2).ToString();

            //text property
            tb.Text = Symbol.Name + ", " + TimeFrame.ShortName + "\n" + StartingBalance + "\n" + DailyPercent + " %" + "\n" + DailyNet + " $" + "\n" + sp;
            tb.FontSize = FontSize;
            tb.ForegroundColor = Color1.TrimEnd();
            tb.HorizontalAlignment = HAlignment;
            tb.VerticalAlignment = VAlignment;
            tb.TextAlignment = Alignment;
            tb.Margin = Margin;
            tb.Opacity = Opacity;
        }
    }
}
it works. thanks for your help.
@IRCtrader
IRCtrader
30 Sep 2024, 12:54
please add line with market chart.
please add volume candle chart
@IRCtrader