Topics
Replies
TheBeast
01 Jun 2021, 17:44
RE: RE:
habanero79 said:
The original strategy is not far from complete loss, so the copycats will be gone soon, too.
Yeah quite right.
He/she has dug another hole and is sitting on some hefty open negative float at the mo. See if it blows again. Keeps buying the down-move on DE30.... Nothing to do with trading. Martingale galore...
Feel sorry for those that lose serious amounts of money :-(
@TheBeast
TheBeast
28 May 2021, 11:57
RE:
PanagiotisCharalampous said:
Hi ctid2720557,
I cannot reproduce any issues at the moment for the specific strategy. MMFM was banned from the forum because he violated our Community Rules and Guidelines. He was defaming the platform without providing the information I was requesting from him.
Best Regards,
Panagiotis
Well that clears that up then... Very odd how returns and graphs can change like that. If you are able to reproduce these issues in future, please do share it with everyone here.
It might help to restore some faith in the reporting of the returns of providers, as currently (from what I see across the various trading forums I frequent) the trust is rather low.
Partly due to the way returns are calculated but also due to how individual trades are combined and shown as 1 trade, with an average price of all of them combined, in the history tab. This hides providers that use grids and/or martingale type systems.
I'm not saying you do this for this reason/on purpose, but a cynical person might and this is how it currently comes across to most people I speak to.
I'm saying the above with the best intentions. To improve your reputation and the quality of your platform/the service you provide, I would strongly suggest to look into this.
Have a good weekend.
@TheBeast
TheBeast
25 May 2021, 20:04
( Updated at: 21 Dec 2023, 09:22 )
RE: RE:
MMFM said:
PanagiotisCharalampous said:
Hi MMFM,
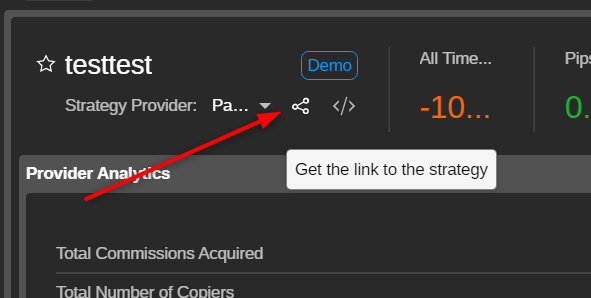
I assume we are talking about a strategy. You can get the link to your strategy here
Best Regards,
Panagiotis
I don't see that anywhere. Like I said at the beginning the account is not public, but the wider issue here is if it was to be, or any other account, then I need to understand if I can rely on the ctrader system to give accurate ROI, which in this case looks suspect. Where 10,000% per month gain frauds are frequent here in the strategy providers and you do nothing about them. And good legit traders won't get noticed. Sorry to be kurt, but I've spent very little time looking through ctrader and seeing things that irritate against the promise of something grander than old Metaquotes.
I'm glad I'm not the only one that takes issue the way returns are being calculated. It should simply be: what is the return on investment over a certain period.
Say you start the month with 1000, end the month with 1100? This makes a return of 10%.
If after another month your equity is 1200, your overall return on investment is 20%.
The return for the last month is 1200-1100= 100. (100/1100)*100 = 9.09%
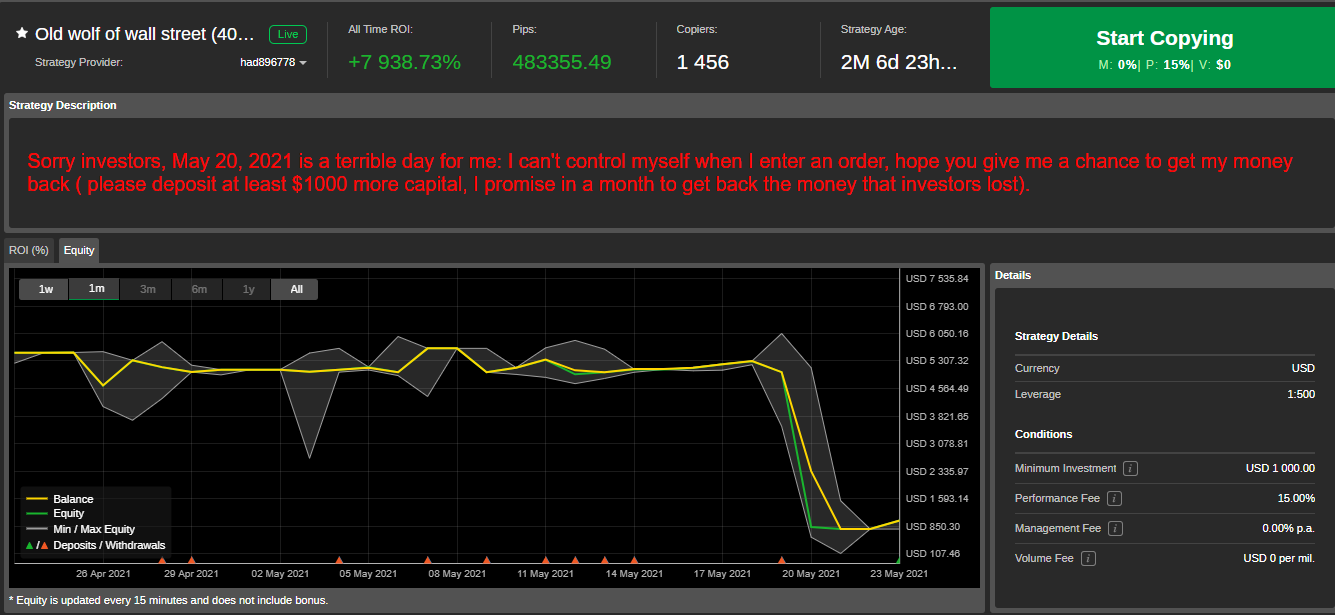
Anyway... Here is something that 'confused' me (saying it nicely). I have been following this provider for some time and he/she had a very bad day on the 20th of May, losing most of the capital.
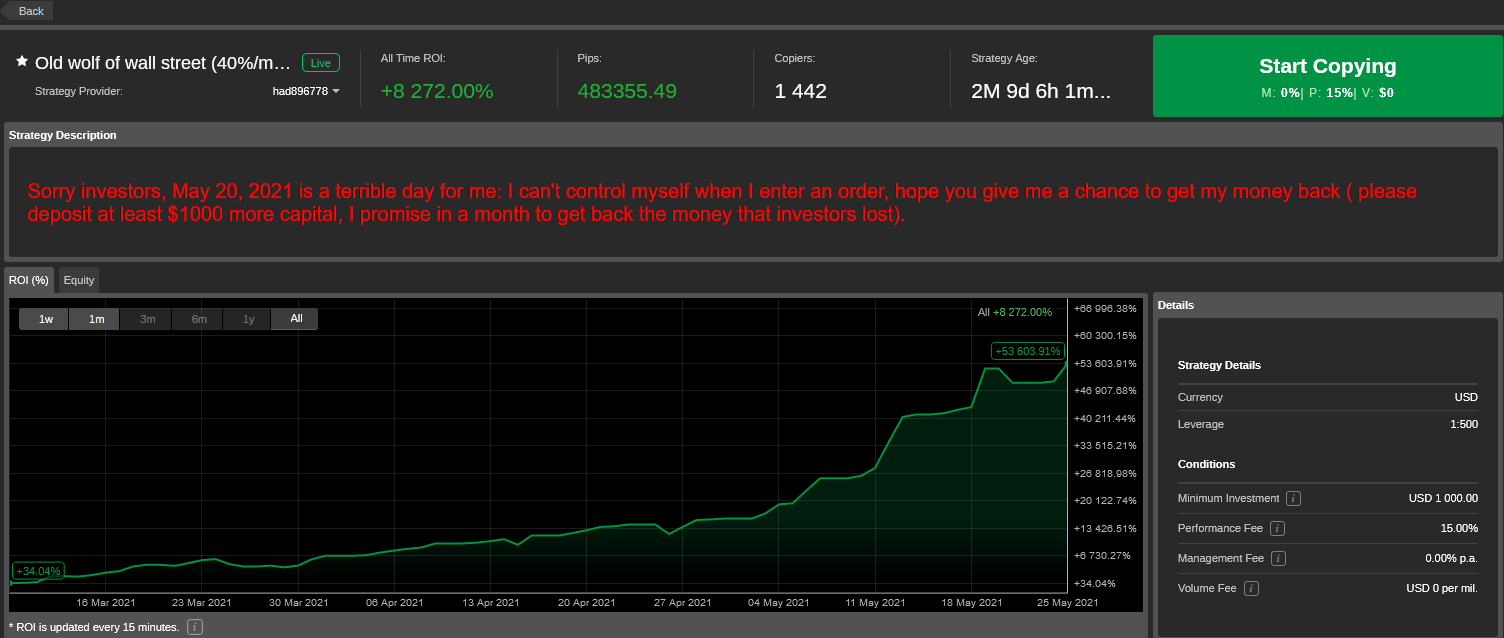
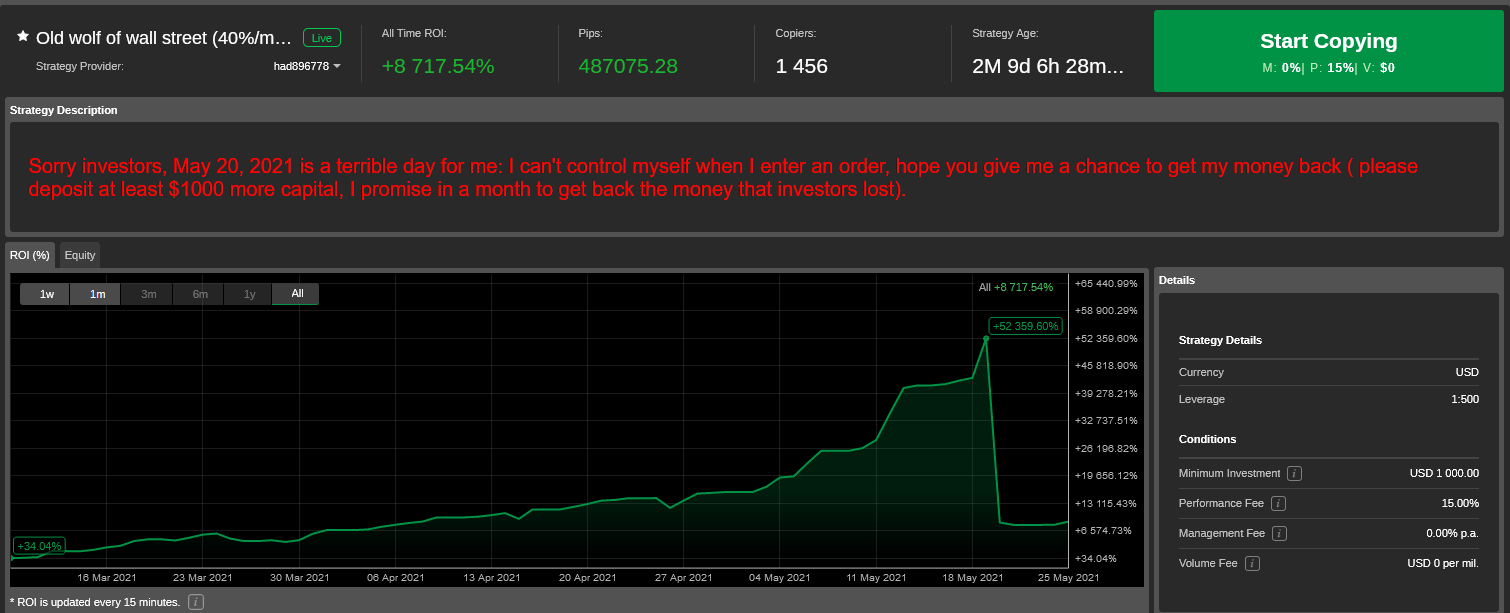
Over the last few days this was visible in the ROI graph, when I just checked, the drop magically disappeared.
Can you please explain this?
Below the drop in equity/balance on the 20th.

Here a screenshot of the graph of the ROI now. Where did the drop in ROI go? Was there at the beginning of the day!
Please note that the 'All Time ROI' is reported as +8272.00% but the graph is showing 53.603.91%, with no significant drop on the 20th of May.

I think I best create a script that takes screenshots on an hourly basis for future reference.
@TheBeast


TheBeast
06 Jun 2021, 11:09
RE: RE: RE:
ctid2720557 said:
Well this is going from bad to worse :-(

First the message in May was:
Fast forward only a few days:

Intriguing to see that there are still 1463 copiers... To all of them: if you don't want/need your money, I'm happy to send you my bank details and will do some good with it :-)
@TheBeast