Topics
Replies
crank
04 Jan 2015, 15:38
RE:
How would I display just the numerical value of the linear regression slope of these two trendlines on the chart? I don't need to graph anything, just the numerical values of the two slopes in the top left corner of the existing price chart.
cAlgo_Development said:
Indicator drawing trend-lines automatically using specified period (minimum distance between high and low extremums):
Source code:
using System;
using cAlgo.API;
using cAlgo.API.Indicators;

namespace cAlgo.Indicators
{
    [Indicator(IsOverlay = true)]
    public class TrendLines : Indicator
    {
    	[Parameter(DefaultValue = 30, MinValue = 1)]
        public int Period { get; set; }

        protected override void Initialize()
        {
            RedrawLines();
        }

        public override void Calculate(int index)
        {
            if (IsRealTime)
                RedrawLines();
        }

        private void RedrawLines()
        {
            int count = MarketSeries.Close.Count;

            int maxIndex1 = FindNextLocalExtremum(MarketSeries.High, count - 1, true);
            int maxIndex2 = FindNextLocalExtremum(MarketSeries.High, maxIndex1 - Period, true);

            int minIndex1 = FindNextLocalExtremum(MarketSeries.Low, count - 1, false);
            int minIndex2 = FindNextLocalExtremum(MarketSeries.Low, minIndex1 - Period, false);

            int startIndex = Math.Min(maxIndex2, minIndex2) - 100;
            int endIndex = count + 100;

            DrawTrendLine("high", startIndex, endIndex, maxIndex1, MarketSeries.High[maxIndex1],
                maxIndex2, MarketSeries.High[maxIndex2]);

            DrawTrendLine("low", startIndex, endIndex, minIndex1, MarketSeries.Low[minIndex1],
                minIndex2, MarketSeries.Low[minIndex2]);
        }

        private void DrawTrendLine(string lineName, int startIndex,
            int endIndex, int index1, double value1, int index2, double value2)
        {
            double gradient = (value2 - value1) / (index2 - index1);

            double startValue = value1 + (startIndex - index1) * gradient;
            double endValue = value1 + (endIndex - index1) * gradient;

            ChartObjects.DrawLine(lineName, startIndex, startValue, endIndex, endValue, Colors.Gray);
            ChartObjects.DrawLine(lineName+"_red", index1, value1, index2, value2, Colors.Red);
        }

        private int FindNextLocalExtremum(DataSeries series, int maxIndex, bool findMax)
        {
            for (int index = maxIndex; index >= 0; index --)
            {
                if (IsLocalExtremum(series, index, findMax))
                {
                    return index;
                }
            }
            return 0;
        }

        private bool IsLocalExtremum(DataSeries series, int index, bool findMax)
        {
        	int end = Math.Min(index + Period, series.Count - 1);
        	int start = Math.Max(index - Period, 0);

        	double value = series[index];

        	for (int i = start; i < end; i++)
        	{
        		if (findMax && value < series[i])
        			return false;

    			if (!findMax && value > series[i])
        			return false;
        	}
        	return true;
        }
    }
}

@crank
crank
02 Jan 2015, 22:22
RE: Indicator example: Multi-timeframe moving average
Without plotting the actual moving average lines, how would I just output the numerical value of how far the 100 DAY moving average is from the current price on a one HOUR price chart, plotting just the numerical value in the top left corner of the a one hour price chart, i.e.,
(100 DAY moving average value) - (Current price on a one HOUR chart). With the numerical value output in the top left corner of the one hour chart. When I'm looking at shorter time frame charts like an hour or 15 minute charts, I want to know how far the close is from DAILY moving averages. The code below really only works if you want to know the MAs of shorter timeframes than the chart that you are viewing. I want to know the opposite, i.e, show longer timeframe MAs on shorter timeframe charts.
In this example, we output moving averages with the same period for different timeframes on a single chart:
Source code:
using System;
using cAlgo.API;
using cAlgo.API.Internals;
using cAlgo.API.Indicators;

namespace cAlgo.Indicators
{
    [Indicator(IsOverlay = true, TimeZone = TimeZones.UTC)]
    public class MultiTF_MA : Indicator
    {
        [Parameter(DefaultValue = 50)]
        public int Period { get; set; }

        [Output("MA", Color = Colors.Yellow)]
        public IndicatorDataSeries MA { get; set; }

        [Output("MA5", Color = Colors.Orange)]
        public IndicatorDataSeries MA5 { get; set; }

        [Output("MA10", Color = Colors.Red)]
        public IndicatorDataSeries MA10 { get; set; }

        private MarketSeries series5;
        private MarketSeries series10;

        private MovingAverage ma;
        private MovingAverage ma5;
        private MovingAverage ma10;

        protected override void Initialize()
        {
            series5 = MarketData.GetSeries(TimeFrame.Minute5);
            series10 = MarketData.GetSeries(TimeFrame.Minute10);

            ma = Indicators.MovingAverage(MarketSeries.Close, Period, MovingAverageType.Triangular);
            ma5 = Indicators.MovingAverage(series5.Close, Period, MovingAverageType.Triangular);
            ma10 = Indicators.MovingAverage(series10.Close, Period, MovingAverageType.Triangular);
        }

        public override void Calculate(int index)
        {
            MA[index] = ma.Result[index];

            var index5 = GetIndexByDate(series5, MarketSeries.OpenTime[index]);
            if (index5 != -1)
                MA5[index] = ma5.Result[index5];

            var index10 = GetIndexByDate(series10, MarketSeries.OpenTime[index]);
            if (index10 != -1)
                MA10[index] = ma10.Result[index10];
        }


        private int GetIndexByDate(MarketSeries series, DateTime time)
        {
            for (int i = series.Close.Count - 1; i > 0; i--)
            {
                if (time == series.OpenTime[i])
                    return i;
            }
            return -1;
        }
    }
}

@crank
crank
01 Jan 2015, 15:35
RE: RE:
1) But the Stochastic Oscillator doesn't have an input for "series" like the RSI or a moving average to distinguish between two different symbols/series in one indicator.
2) Also, in indicator below, how would I display the difference in the RSI of symbol1 minus the RSI of symbol2, i.e., how do you perform simple arithmetic involving the different symbol RSI outputs instead of just the RSI output?
Example; The RSI (Or preferably the Stochastic Oscillator %K ) of USDCAD is 70 and the RSI of EURAUD is 60. How do I display USDCAD - EURAUD = 10 using the multi-symbol indicator below, in addition to just the absolute RSI levels for each symbol. Like the MultiSymbolMarketInfo displays the ask, bid, & spread in the top left of the price chart, but for displaying the result (In the price of simple arithmetic calculations like "USDCAD - EURAUD = 10," instead of ask, bid, & spread.
using System;
using cAlgo.API;
using cAlgo.API.Indicators;
using cAlgo.API.Internals;
namespace cAlgo.Indicators
{
[Levels(30, 70, 80, 20)]
[Indicator(IsOverlay = false, TimeZone = TimeZones.UTC)]
public class MultiSymbolMA : Indicator
{
private RelativeStrengthIndex ma1, ma2, ma3, ma4;
private MarketSeries series1, series2, series3, series4;
private Symbol symbol1, symbol2, symbol3, symbol4;
[Parameter(DefaultValue = "USDCAD")]
public string Symbol1 { get; set; }
[Parameter(DefaultValue = "EURAUD")]
public string Symbol2 { get; set; }
[Parameter(DefaultValue = "EURJPY")]
public string Symbol3 { get; set; }
[Parameter(DefaultValue = "GBPUSD")]
public string Symbol4 { get; set; }
[Parameter(DefaultValue = 5)]
public int Period { get; set; }
[Output("MA Symbol 1", Color = Colors.Red, PlotType = PlotType.Line, Thickness = 1)]
public IndicatorDataSeries Result1 { get; set; }
[Output("MA Symbol 2", Color = Colors.Magenta, PlotType = PlotType.Line, Thickness = 1)]
public IndicatorDataSeries Result2 { get; set; }
[Output("MA Symbol 3", Color = Colors.Yellow, PlotType = PlotType.Line, Thickness = 1)]
public IndicatorDataSeries Result3 { get; set; }
[Output("MA Symbol 4", Color = Colors.White, PlotType = PlotType.Line, Thickness = 1, LineStyle = LineStyle.Dots)]
public IndicatorDataSeries Result4 { get; set; }
protected override void Initialize()
{
symbol1 = MarketData.GetSymbol(Symbol1);
symbol2 = MarketData.GetSymbol(Symbol2);
symbol3 = MarketData.GetSymbol(Symbol3);
symbol4 = MarketData.GetSymbol(Symbol4);
series1 = MarketData.GetSeries(symbol1, TimeFrame);
series2 = MarketData.GetSeries(symbol2, TimeFrame);
series3 = MarketData.GetSeries(symbol3, TimeFrame);
series4 = MarketData.GetSeries(symbol4, TimeFrame);
ma1 = Indicators.RelativeStrengthIndex(series1.Close, Period);
ma2 = Indicators.RelativeStrengthIndex(series2.Close, Period);
ma3 = Indicators.RelativeStrengthIndex(series3.Close, Period);
ma4 = Indicators.RelativeStrengthIndex(series4.Close, Period);
}
public override void Calculate(int index)
{
ShowOutput(symbol1, Result1, ma1, series1, index);
ShowOutput(symbol2, Result2, ma2, series2, index);
ShowOutput(symbol3, Result3, ma3, series3, index);
ShowOutput(symbol4, Result4, ma4, series4, index);
}
private void ShowOutput(Symbol symbol, IndicatorDataSeries result, RelativeStrengthIndex RelativeStrengthIndex, MarketSeries series, int index)
{
int index2 = GetIndexByDate(series, MarketSeries.OpenTime[index]);
result[index] = RelativeStrengthIndex.Result[index2];
string text = string.Format("{0} {1}", symbol.Code, Math.Round(result[index], 0));
ChartObjects.DrawText(symbol.Code, text, index + 1, result[index], VerticalAlignment.Center, HorizontalAlignment.Right, Colors.Yellow);
}
private int GetIndexByDate(MarketSeries series, DateTime time)
{
for (int i = series.Close.Count - 1; i >= 0; i--)
if (time == series.OpenTime[i])
return i;
return -1;
}
}
}
How would I use the Stochastic Oscillator %K for two different symbols in indicators or robots?
We added new functionality to cAlgo - the ability for robots and indicators to work with multiple symbols. Now it's possible to use multiple symbol prices, OHLCV series and trade different symbols.
Requesting symbol
Robots and indicators can request a symbol specifying its symbol code. Symbol objects behave like the default Symbol object of a robot or indicator, containing current Ask, Bid, PipSize and other useful properties.
Symbol symbol = MarketData.GetSymbol("USDJPY");

Print("Symbol: {0}, Ask: {1}, Bid: {2}", symbol.Code, symbol.Ask, symbol.Bid);
Requesting OHLCV series
Robots and indicators can request OHLCV series for multiple symbols and timeframes and build indicators based on it.
MarketSeries series = MarketData.GetSeries("EURCAD", TimeFrame.Minute15);
MovingAverage ma = Indicators.SimpleMovingAverage(series.Close, 20);

Print("Symbol: {0}, TimeFrame: {1}", series.SymbolCode, series.TimeFrame);
Print("Last Close: {0}, Average Close: {1}", series.Close.LastValue, ma.Result.LastValue);
Trading multiple symbols
Robots in cAlgo can execute orders for different symbols. To do this, the robot must request the needed symbol by its code. Then, it will be possible to use it in a trade request:
 Symbol symbol = MarketData.GetSymbol("GBPCHF");
 ExecuteMarketOrder(TradeType.Buy, symbol, 10000);
The new version of our Demo cTrader and cAlgo is released and can be downloaded from www.spotware.com
Backtesting of Multi-symbol robots in not supported at least for now. It can be implemented in future.
@crank
crank
01 Jan 2015, 15:34
RE: RE:
1) But the Stochastic Oscillator doesn't have an input for "series" like the RSI or a moving average to distinguish between two different symbols/series in one indicator.
2) Also, in indicator below, how would I display the difference in the RSI of symbol1 minus the RSI of symbol2, i.e., how do you perform simple arithmetic involving the different symbol RSI outputs instead of just the RSI output?
Example; The RSI (Or preferably the Stochastic Oscillator %K ) of USDCAD is 70 and the RSI of EURAUD is 60. How do I display USDCAD - EURAUD = 10 using the multi-symbol indicator below, in addition to just the absolute RSI levels for each symbol. Like the MultiSymbolMarketInfo displays the ask, bid, & spread in the top left of the price chart, but for displaying the result (In the price of simple arithmetic calculations like "USDCAD - EURAUD = 10," instead of ask, bid, & spread.
using System;
using cAlgo.API;
using cAlgo.API.Indicators;
using cAlgo.API.Internals;
namespace cAlgo.Indicators
{
[Levels(30, 70, 80, 20)]
[Indicator(IsOverlay = false, TimeZone = TimeZones.UTC)]
public class MultiSymbolMA : Indicator
{
private RelativeStrengthIndex ma1, ma2, ma3, ma4;
private MarketSeries series1, series2, series3, series4;
private Symbol symbol1, symbol2, symbol3, symbol4;
[Parameter(DefaultValue = "USDCAD")]
public string Symbol1 { get; set; }
[Parameter(DefaultValue = "EURAUD")]
public string Symbol2 { get; set; }
[Parameter(DefaultValue = "EURJPY")]
public string Symbol3 { get; set; }
[Parameter(DefaultValue = "GBPUSD")]
public string Symbol4 { get; set; }
[Parameter(DefaultValue = 5)]
public int Period { get; set; }
[Output("MA Symbol 1", Color = Colors.Red, PlotType = PlotType.Line, Thickness = 1)]
public IndicatorDataSeries Result1 { get; set; }
[Output("MA Symbol 2", Color = Colors.Magenta, PlotType = PlotType.Line, Thickness = 1)]
public IndicatorDataSeries Result2 { get; set; }
[Output("MA Symbol 3", Color = Colors.Yellow, PlotType = PlotType.Line, Thickness = 1)]
public IndicatorDataSeries Result3 { get; set; }
[Output("MA Symbol 4", Color = Colors.White, PlotType = PlotType.Line, Thickness = 1, LineStyle = LineStyle.Dots)]
public IndicatorDataSeries Result4 { get; set; }
protected override void Initialize()
{
symbol1 = MarketData.GetSymbol(Symbol1);
symbol2 = MarketData.GetSymbol(Symbol2);
symbol3 = MarketData.GetSymbol(Symbol3);
symbol4 = MarketData.GetSymbol(Symbol4);
series1 = MarketData.GetSeries(symbol1, TimeFrame);
series2 = MarketData.GetSeries(symbol2, TimeFrame);
series3 = MarketData.GetSeries(symbol3, TimeFrame);
series4 = MarketData.GetSeries(symbol4, TimeFrame);
ma1 = Indicators.RelativeStrengthIndex(series1.Close, Period);
ma2 = Indicators.RelativeStrengthIndex(series2.Close, Period);
ma3 = Indicators.RelativeStrengthIndex(series3.Close, Period);
ma4 = Indicators.RelativeStrengthIndex(series4.Close, Period);
}
public override void Calculate(int index)
{
ShowOutput(symbol1, Result1, ma1, series1, index);
ShowOutput(symbol2, Result2, ma2, series2, index);
ShowOutput(symbol3, Result3, ma3, series3, index);
ShowOutput(symbol4, Result4, ma4, series4, index);
}
private void ShowOutput(Symbol symbol, IndicatorDataSeries result, RelativeStrengthIndex RelativeStrengthIndex, MarketSeries series, int index)
{
int index2 = GetIndexByDate(series, MarketSeries.OpenTime[index]);
result[index] = RelativeStrengthIndex.Result[index2];
string text = string.Format("{0} {1}", symbol.Code, Math.Round(result[index], 0));
ChartObjects.DrawText(symbol.Code, text, index + 1, result[index], VerticalAlignment.Center, HorizontalAlignment.Right, Colors.Yellow);
}
private int GetIndexByDate(MarketSeries series, DateTime time)
{
for (int i = series.Close.Count - 1; i >= 0; i--)
if (time == series.OpenTime[i])
return i;
return -1;
}
}
}
How would I use the Stochastic Oscillator %K for two different symbols in indicators or robots?
We added new functionality to cAlgo - the ability for robots and indicators to work with multiple symbols. Now it's possible to use multiple symbol prices, OHLCV series and trade different symbols.
Requesting symbol
Robots and indicators can request a symbol specifying its symbol code. Symbol objects behave like the default Symbol object of a robot or indicator, containing current Ask, Bid, PipSize and other useful properties.
Symbol symbol = MarketData.GetSymbol("USDJPY");

Print("Symbol: {0}, Ask: {1}, Bid: {2}", symbol.Code, symbol.Ask, symbol.Bid);
Requesting OHLCV series
Robots and indicators can request OHLCV series for multiple symbols and timeframes and build indicators based on it.
MarketSeries series = MarketData.GetSeries("EURCAD", TimeFrame.Minute15);
MovingAverage ma = Indicators.SimpleMovingAverage(series.Close, 20);

Print("Symbol: {0}, TimeFrame: {1}", series.SymbolCode, series.TimeFrame);
Print("Last Close: {0}, Average Close: {1}", series.Close.LastValue, ma.Result.LastValue);
Trading multiple symbols
Robots in cAlgo can execute orders for different symbols. To do this, the robot must request the needed symbol by its code. Then, it will be possible to use it in a trade request:
 Symbol symbol = MarketData.GetSymbol("GBPCHF");
 ExecuteMarketOrder(TradeType.Buy, symbol, 10000);
The new version of our Demo cTrader and cAlgo is released and can be downloaded from www.spotware.com
Backtesting of Multi-symbol robots in not supported at least for now. It can be implemented in future.
@crank
crank
27 Dec 2014, 17:32
( Updated at: 21 Dec 2023, 09:20 )
RE:
How do I use PercentK from the StochasticOscillator for two different symbols? I see the RSI for multi-symbols, but RSI has an "MarketSeries.Close" type input. PercentK any many other indicators don't.
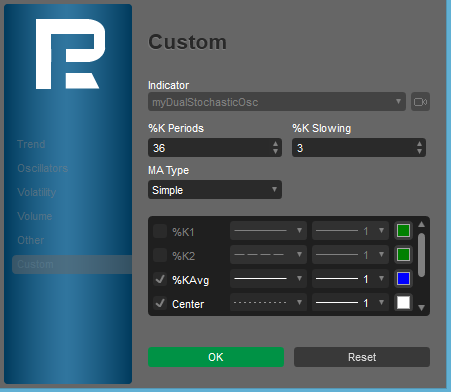
Is there a way to tell programmatically if someone has chosen to hide an output of an indicator? In the picture below I unchecked %k1, I would like to branch on that selection within the code of the indicator.
@crank
crank
27 Dec 2014, 17:26
( Updated at: 21 Dec 2023, 09:20 )
RE:
How do I use PercentK for two different symbols?
You may access it as follows:
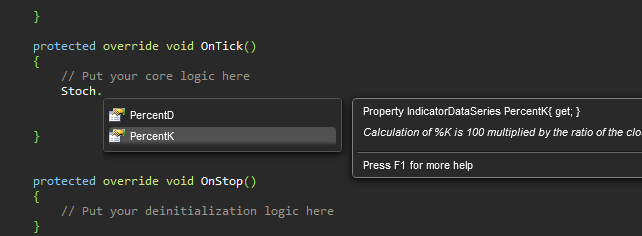
    Stoch.PercentK.LastValue;  // Last value of Main
    Stoch.PercentD.LastValue;  // Last value of Signal
    // or
    int index = MarketSeries.Close.Count - 1; // index of last bar
    Stoch.PercentK[index - 1]; // Previous to last value of Main
    Stoch.PercentD[index - 1]; // Previous to last value of Signal
The instellisense will populate a list of all properties upot pressing the period (dot):
@crank
crank
27 Dec 2014, 16:29
RE: Solved!
How would I use the Stochastic Oscillator %K for two different symbols in indicators or robots?
Thanks, Jeex! This is fabulous, problem solved!
I am posting the working code for the sample for others to see. Needless to say, the sample doesn't make sense as it's adding up currency, it's just meant to show how to make this work :)
using System;
using cAlgo.API;
using cAlgo.API.Internals;
using cAlgo.API.Indicators;

namespace cAlgo.Indicators
{
    [Indicator(IsOverlay = false, TimeZone = TimeZones.UTC)]
    public class Test : Indicator
    {
        [Parameter(DefaultValue = 0.0)]
        public double Parameter { get; set; }

        [Output("Main")]
        public IndicatorDataSeries Result { get; set; }

        MarketSeries series1;
        MarketSeries series2;
        MarketSeries series3;

        protected override void Initialize()
        {
            series1 = MarketData.GetSeries("USDJPY", this.TimeFrame);
            series2 = MarketData.GetSeries("AUDUSD", this.TimeFrame);
            series3 = MarketData.GetSeries("USDCAD", this.TimeFrame);
        }

        public override void Calculate(int index)
        {
            int index1 = series1.OpenTime.GetIndexByExactTime(MarketSeries.OpenTime[index]);
            int index2 = series2.OpenTime.GetIndexByExactTime(MarketSeries.OpenTime[index]);
            int index3 = series3.OpenTime.GetIndexByExactTime(MarketSeries.OpenTime[index]);

            Result[index] = series1.Close[index1] + series2.Close[index2] + series3.Close[index3];

            if (double.IsNaN(series1.Close[index1]))
                Print("Nan: Series 1");

            if (double.IsNaN(series2.Close[index2]))
                Print("Nan: Series 2");

            if (double.IsNaN(series3.Close[index3]))
                Print("Nan: Series 3");
        }
    }
}
@crank
crank
27 Dec 2014, 16:27
RE:
How would I use the Stochastic Oscillator %K for two different symbols in indicators or robots?
We added new functionality to cAlgo - the ability for robots and indicators to work with multiple symbols. Now it's possible to use multiple symbol prices, OHLCV series and trade different symbols.
Requesting symbol
Robots and indicators can request a symbol specifying its symbol code. Symbol objects behave like the default Symbol object of a robot or indicator, containing current Ask, Bid, PipSize and other useful properties.
Symbol symbol = MarketData.GetSymbol("USDJPY");

Print("Symbol: {0}, Ask: {1}, Bid: {2}", symbol.Code, symbol.Ask, symbol.Bid);
Requesting OHLCV series
Robots and indicators can request OHLCV series for multiple symbols and timeframes and build indicators based on it.
MarketSeries series = MarketData.GetSeries("EURCAD", TimeFrame.Minute15);
MovingAverage ma = Indicators.SimpleMovingAverage(series.Close, 20);

Print("Symbol: {0}, TimeFrame: {1}", series.SymbolCode, series.TimeFrame);
Print("Last Close: {0}, Average Close: {1}", series.Close.LastValue, ma.Result.LastValue);
Trading multiple symbols
Robots in cAlgo can execute orders for different symbols. To do this, the robot must request the needed symbol by its code. Then, it will be possible to use it in a trade request:
 Symbol symbol = MarketData.GetSymbol("GBPCHF");
 ExecuteMarketOrder(TradeType.Buy, symbol, 10000);
The new version of our Demo cTrader and cAlgo is released and can be downloaded from www.spotware.com
Backtesting of Multi-symbol robots in not supported at least for now. It can be implemented in future.
@crank
crank
27 Dec 2014, 16:26
RE:
How would I use the Stochastic Oscillator %K for two different symbols in indicators or robots?
cAlgo_Development said:
We added new functionality to cAlgo - the ability for robots and indicators to work with multiple symbols. Now it's possible to use multiple symbol prices, OHLCV series and trade different symbols.
Requesting symbol
Robots and indicators can request a symbol specifying its symbol code. Symbol objects behave like the default Symbol object of a robot or indicator, containing current Ask, Bid, PipSize and other useful properties.
Symbol symbol = MarketData.GetSymbol("USDJPY");

Print("Symbol: {0}, Ask: {1}, Bid: {2}", symbol.Code, symbol.Ask, symbol.Bid);
Requesting OHLCV series
Robots and indicators can request OHLCV series for multiple symbols and timeframes and build indicators based on it.
MarketSeries series = MarketData.GetSeries("EURCAD", TimeFrame.Minute15);
MovingAverage ma = Indicators.SimpleMovingAverage(series.Close, 20);

Print("Symbol: {0}, TimeFrame: {1}", series.SymbolCode, series.TimeFrame);
Print("Last Close: {0}, Average Close: {1}", series.Close.LastValue, ma.Result.LastValue);
Trading multiple symbols
Robots in cAlgo can execute orders for different symbols. To do this, the robot must request the needed symbol by its code. Then, it will be possible to use it in a trade request:
 Symbol symbol = MarketData.GetSymbol("GBPCHF");
 ExecuteMarketOrder(TradeType.Buy, symbol, 10000);
The new version of our Demo cTrader and cAlgo is released and can be downloaded from www.spotware.com
Backtesting of Multi-symbol robots in not supported at least for now. It can be implemented in future.
@crank
crank
27 Dec 2014, 16:25
RE: Example: Multi-symbol RSI robot
How would I use the Stochastic Oscillator %K for two different symbols in indicators or robots?
cAlgo_Development said:
Robot below trades EURUSD if both EURUSD and EURJPY are overbought or oversold according to RSI indicator:
using System;
using cAlgo.API;
using cAlgo.API.Indicators;
using cAlgo.API.Requests;
using cAlgo.API.Internals;
using cAlgo.Indicators;

namespace cAlgo.Robots
{
    [Robot()]
    public class MultiSymbolRsiRobot : Robot
    {

        private const string MyLabel = "MultiSymbolRsiRobot";

        [Parameter("Periods", DefaultValue = 14)]
        public int Periods { get; set; }

        [Parameter("Volume", DefaultValue = 10000, MinValue = 1000)]
        public int Volume { get; set; }

        private RelativeStrengthIndex eurJpyRSI;
        private RelativeStrengthIndex eurUsdRSI;

        private Symbol eurUsd;

        protected override void OnStart()
        {
            var eurJpySeries = MarketData.GetSeries("EURJPY", TimeFrame);
            var eurUsdSeries = MarketData.GetSeries("EURUSD", TimeFrame);

            eurJpyRSI = Indicators.RelativeStrengthIndex(eurJpySeries.Close, Periods);
            eurUsdRSI = Indicators.RelativeStrengthIndex(eurUsdSeries.Close, Periods);

            eurUsd = MarketData.GetSymbol("EURUSD");
        }

        protected override void OnTick()
        {
            if (Trade.IsExecuting)
                return;

            if (eurUsdRSI.Result.LastValue > 70 && eurJpyRSI.Result.LastValue > 70)
            {
                ClosePosition(eurUsd, TradeType.Buy);
                OpenPosition(eurUsd, TradeType.Sell);
            }
            if (eurUsdRSI.Result.LastValue < 30 && eurJpyRSI.Result.LastValue < 30)
            {
                ClosePosition(eurUsd, TradeType.Sell);
                OpenPosition(eurUsd, TradeType.Buy);
            }
        }


        private void ClosePosition(Symbol symbol, TradeType tradeType)
        {
            foreach (Position position in Account.Positions)
            {
                if (position.Label == MyLabel && position.SymbolCode == symbol.Code && position.TradeType == tradeType)
                    Trade.Close(position);
            }
        }

        private void OpenPosition(Symbol symbol, TradeType tradeType)
        {
            if (HasPosition(symbol, tradeType))
                return;

            var request = new MarketOrderRequest(tradeType, Volume)
            {
                Label = MyLabel,
                Symbol = symbol
            };

            Trade.Send(request);
        }

        private bool HasPosition(Symbol symbol, TradeType tradeType)
        {
            foreach (Position position in Account.Positions)
            {
                if (position.SymbolCode == symbol.Code && position.Label == MyLabel && position.TradeType == tradeType)
                    return true;
            }
            return false;
        }

    }
}
@crank
crank
27 Dec 2014, 16:24
RE: Example: Multi-symbol RSI robot
How would I use the Stochastic Oscillator %K with two symbols in indicators or Robots?
cAlgo_Development said:
Robot below trades EURUSD if both EURUSD and EURJPY are overbought or oversold according to RSI indicator:
using System;
using cAlgo.API;
using cAlgo.API.Indicators;
using cAlgo.API.Requests;
using cAlgo.API.Internals;
using cAlgo.Indicators;

namespace cAlgo.Robots
{
    [Robot()]
    public class MultiSymbolRsiRobot : Robot
    {

        private const string MyLabel = "MultiSymbolRsiRobot";

        [Parameter("Periods", DefaultValue = 14)]
        public int Periods { get; set; }

        [Parameter("Volume", DefaultValue = 10000, MinValue = 1000)]
        public int Volume { get; set; }

        private RelativeStrengthIndex eurJpyRSI;
        private RelativeStrengthIndex eurUsdRSI;

        private Symbol eurUsd;

        protected override void OnStart()
        {
            var eurJpySeries = MarketData.GetSeries("EURJPY", TimeFrame);
            var eurUsdSeries = MarketData.GetSeries("EURUSD", TimeFrame);

            eurJpyRSI = Indicators.RelativeStrengthIndex(eurJpySeries.Close, Periods);
            eurUsdRSI = Indicators.RelativeStrengthIndex(eurUsdSeries.Close, Periods);

            eurUsd = MarketData.GetSymbol("EURUSD");
        }

        protected override void OnTick()
        {
            if (Trade.IsExecuting)
                return;

            if (eurUsdRSI.Result.LastValue > 70 && eurJpyRSI.Result.LastValue > 70)
            {
                ClosePosition(eurUsd, TradeType.Buy);
                OpenPosition(eurUsd, TradeType.Sell);
            }
            if (eurUsdRSI.Result.LastValue < 30 && eurJpyRSI.Result.LastValue < 30)
            {
                ClosePosition(eurUsd, TradeType.Sell);
                OpenPosition(eurUsd, TradeType.Buy);
            }
        }


        private void ClosePosition(Symbol symbol, TradeType tradeType)
        {
            foreach (Position position in Account.Positions)
            {
                if (position.Label == MyLabel && position.SymbolCode == symbol.Code && position.TradeType == tradeType)
                    Trade.Close(position);
            }
        }

        private void OpenPosition(Symbol symbol, TradeType tradeType)
        {
            if (HasPosition(symbol, tradeType))
                return;

            var request = new MarketOrderRequest(tradeType, Volume)
            {
                Label = MyLabel,
                Symbol = symbol
            };

            Trade.Send(request);
        }

        private bool HasPosition(Symbol symbol, TradeType tradeType)
        {
            foreach (Position position in Account.Positions)
            {
                if (position.SymbolCode == symbol.Code && position.Label == MyLabel && position.TradeType == tradeType)
                    return true;
            }
            return false;
        }

    }
}
@crank
crank
15 Nov 2014, 17:48
RE: RE: RE: RE:
crank said:I might add that I find it odd that cAlgo, on those optimizations runs that produce NO losing trades, the fitness and profit factor will understandably be blank, but so is the "History, " "balance chart" and "log" is also be blank for those runs that had no losing trades. Also if you sort for the best optimization funs/optimal parameter set, those with no losing trades are sorted so low as to be "below the fold" on the results page and can easily be missed entirely unless you scroll down, whereas they should generally be at or near the top as they have a "max balance drawdown" of zero.
Spotware said:
crank said:
Spotware said:
Please make sure that your cBot is not out of money after 2 months.
Definitely not out of money, these are highly successful optimizations. Also, when you "save" parameters, how do you open/use them in the future? When I click on the saved optimization parameters, it just asks what program to use to open the parameter file, even though cAlgo is already running. I've never been able to open the saved parameter file.
You can load parameters by clicking on Load Parameters buttion in Modify cBot Parameters window in cTrader, or in context menu of cBot in cAlgo.
In fact, since the optimizer will only produce trades for the first two months of whatever length data set you choose in the slider to optimize, many of my optimization runs have no losing trades. If you load 1-4 years of data to optimize, upon finishing the optimization, it is clear by the dates in the resulting trades, that it only used first two months of the data set for trades, even though the green optimization progress bar within the slider has "optimized" all the dates in the optimization set. And any time-frame from 1 hour to weekly data still produces trade results for the first two months of whatever data set length you choose. One hour data obviously produces more trades, but only for the first two months of data.
@crank
crank
15 Nov 2014, 17:31
RE: RE: RE:
Spotware said:
crank said:
Spotware said:
Please make sure that your cBot is not out of money after 2 months.
Definitely not out of money, these are highly successful optimizations. Also, when you "save" parameters, how do you open/use them in the future? When I click on the saved optimization parameters, it just asks what program to use to open the parameter file, even though cAlgo is already running. I've never been able to open the saved parameter file.
You can load parameters by clicking on Load Parameters buttion in Modify cBot Parameters window in cTrader, or in context menu of cBot in cAlgo.
In fact, since the optimizer will only produce trades for the first two months of whatever length data set you choose in the slider to optimize, many of my optimization runs have no losing trades. If you load 1-4 years of data to optimize, upon finishing the optimization, it is clear by the dates in the resulting trades, that it only used first two months of the data set for trades, even though the green optimization progress bar within the slider has "optimized" all the dates in the optimization set. And any time-frame from 1 hour to weekly data still produces trade results for the first two months of whatever data set length you choose. One hour data obviously produces more trades, but only for the first two months of data.
@crank
crank
13 Nov 2014, 21:20
RE:
Spotware said:
Please make sure that your cBot is not out of money after 2 months.
Definitely not out of money, these are highly successful optimizations. Also, when you "save" parameters, how do you open/use them in the future? When I click on the saved optimization parameters, it just asks what program to use to open the parameter file, even though cAlgo is already running. I've never been able to open the saved parameter file.
@crank
crank
11 Nov 2014, 19:34
Why no matter what currency is optimized on 4 years of data using the slider, it only uses the first 1-2 months of that four years of data for the trades after optimization, i.e., when you look at any "history" after a 4 year optimization, it only used the first two months of data. If I choose another two year period to train optimization, it will only shows trades in the "history" for the first 1-2 months of data when you look at the trades in optimization. And it does not stop optimization after 1-2 months, it uses the whole 4 years of data, but only produces trades over the first 1-2 months of what ever optimization period was used.
@crank
crank
17 Jan 2015, 14:15
Why don't these multi-symbol indicators load on the weekend when the market is closed? The only timeframe I can get to load when the market is closed is 2 day timeframe or greater. All my multi-symbol/multi-timframe custom indicators work fine until...
Why don't these multi-symbol indicators load on the weekend when the market is closed? The only timeframe I can get to load when the market is closed is 2 day timeframe or greater. All my multi-symbol/multi-timframe custom indicators work fine until the weekend when I'm not trading and have time to work on them. Even a cut-and-paste of the simple indicator below won't load on the weekend.
@crank