CT
Topics
01 Jul 2020, 14:55
1319
2
01 Jul 2020, 14:52
1523
5
01 Jul 2020, 11:43
1
1057
1
Replies
ctrader001
01 Jul 2020, 17:43
( Updated at: 21 Dec 2023, 09:22 )
RE:
PanagiotisCharalampous said:
Hi ctrader001,
Can you please post some screenshots or a video that will allow us to visualize the problem and reproduce it?
Best Regards,
Panagiotis
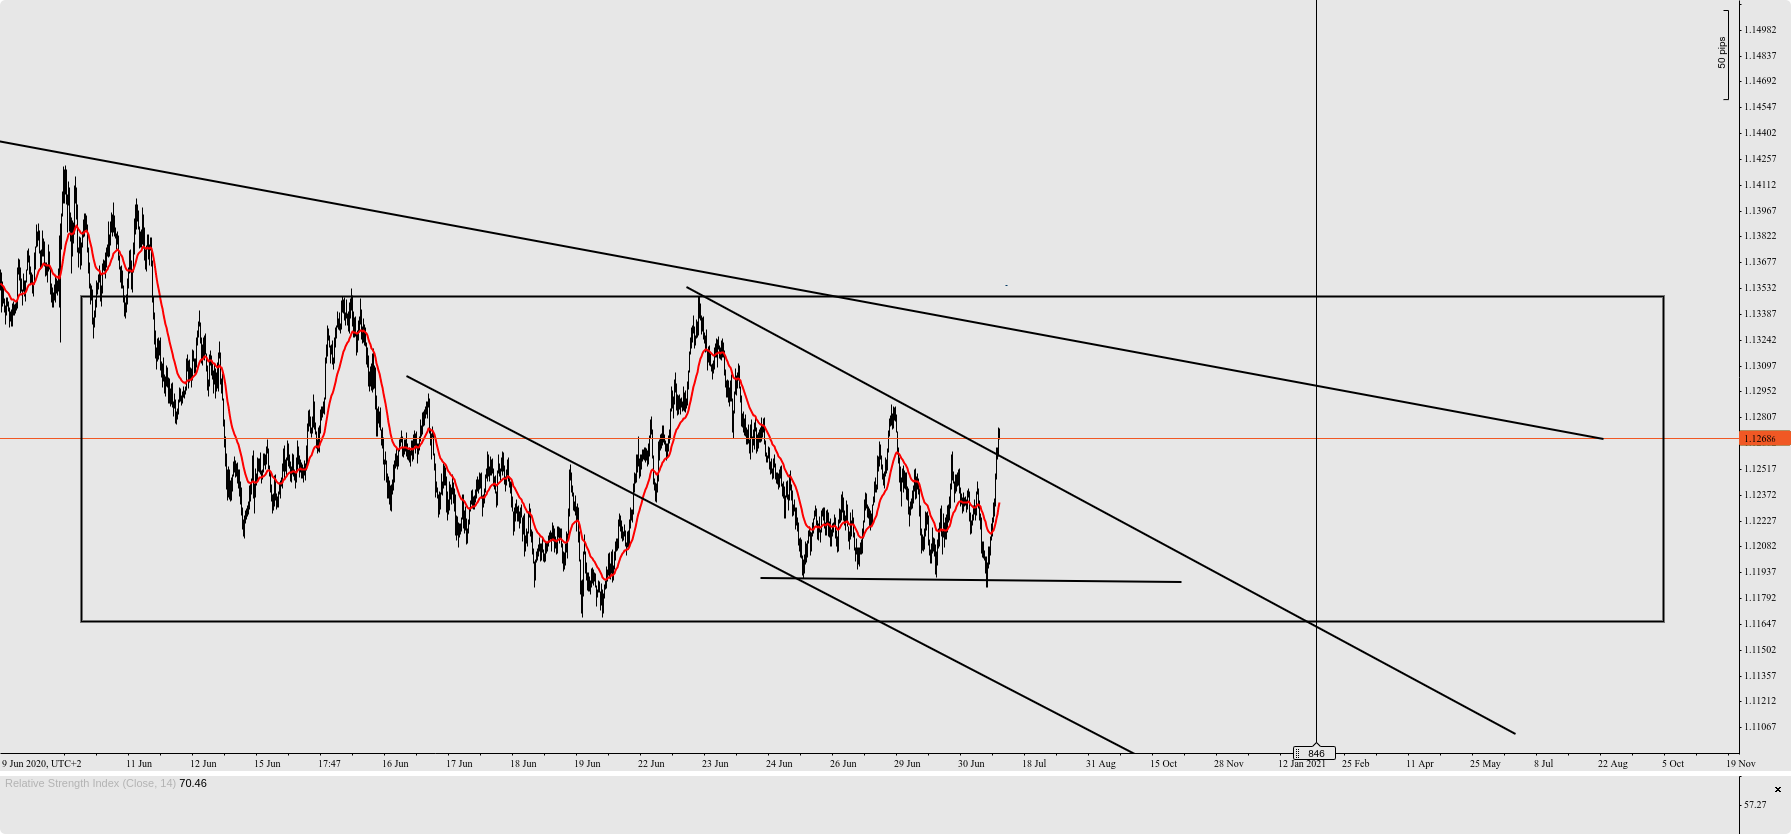
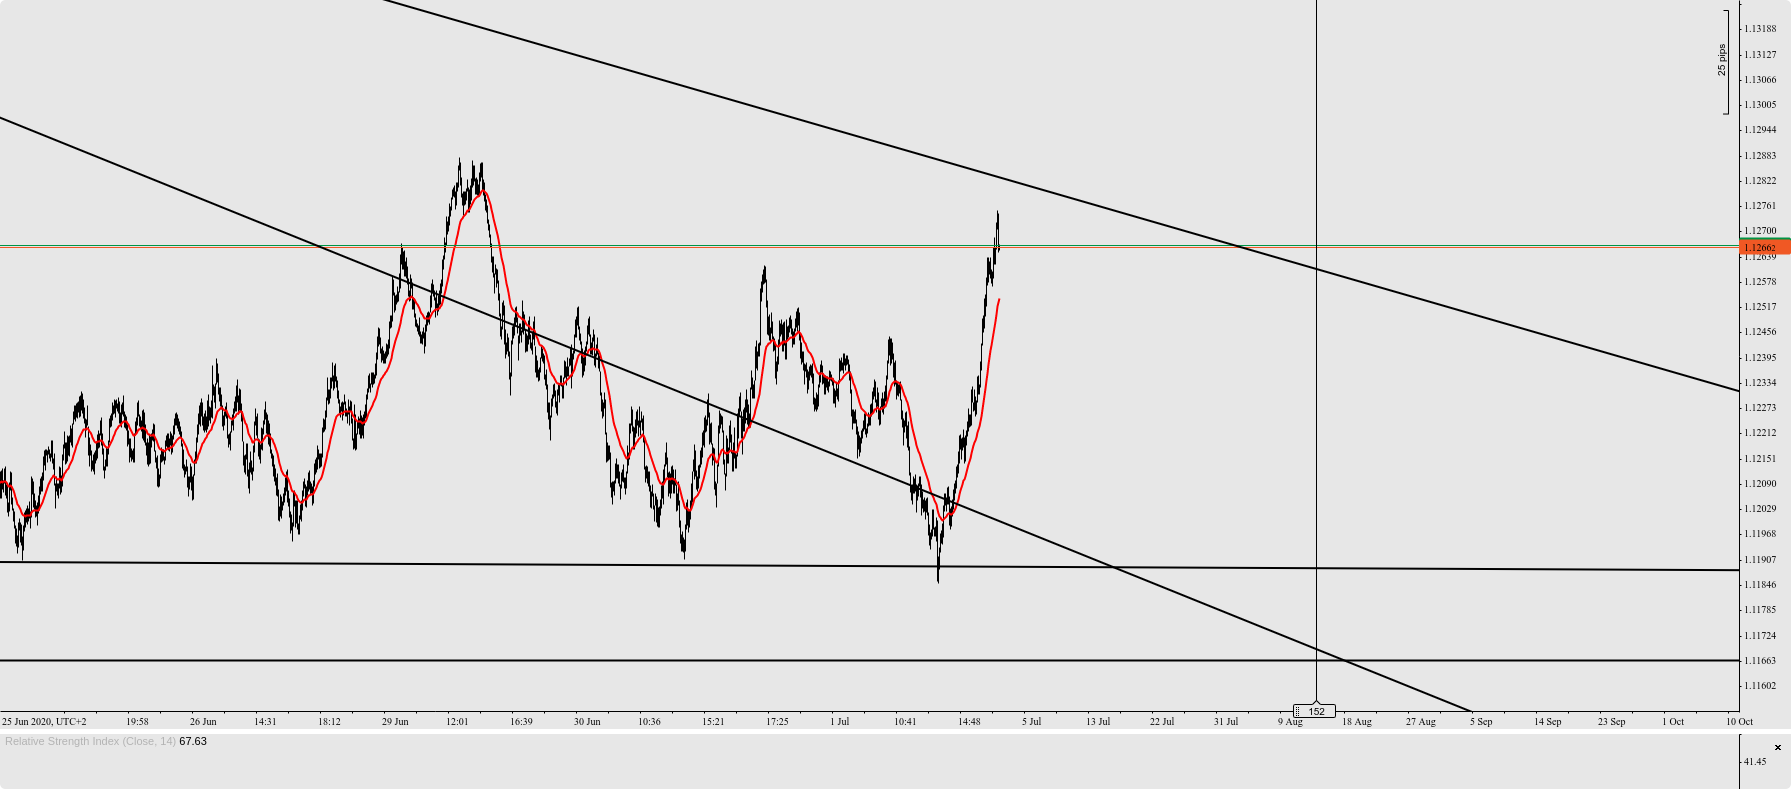
two screenshots of EUR_USD 1000ticks and 200ticks, the bearish trendline is at bad coordinates when you downsize timeframe from 1000 to 200.


@ctrader001
ctrader001
01 Jul 2020, 14:13
( Updated at: 01 Jul 2020, 14:53 )
moved to ctrader web forum
@ctrader001
ctrader001
03 Aug 2020, 13:40
RE: [Resolved]
PanagiotisCharalampous said:
i finally found the issue :
* mouse right clic on the trendline to open the settings popup
* uncheck the "Snap to chart prices" option
In fact, you can reproduce the behaviour on the same timeframe, just by changing the zoom.
i don't know exactly, what's the purpose of this option., surely an auto scale option.
so, to avoid coordinates change, during zoom, you must uncheck this option.
perhaps, you can append your comment about this option.
Thanks
UPDATE : i tried another test on another currency, and the bug still exists.
if i draw the trendline from the back left of the screen to the low middle of the range, and change the zoom level, the coordinates of the trendline change.
So the bug still exists.
@ctrader001