
Topics
Replies
yomm0401
21 Apr 2022, 11:14
RE:
amusleh said:
Hi,
Try this:
using System;
using cAlgo.API;
using cAlgo.API.Internals;
using cAlgo.API.Indicators;
using cAlgo.Indicators;

namespace cAlgo
{
    [Indicator(IsOverlay = true, TimeZone = TimeZones.UTC, AutoRescale = false, AccessRights = AccessRights.None)]
    public class SampleSMA : Indicator
    {
        [Parameter("Source")]
        public DataSeries Source { get; set; }

        [Parameter(DefaultValue = 14)]
        public int Periods { get; set; }

        [Output("Main")]
        public IndicatorDataSeries Result { get; set; }

        private ToggleButton togglebutton;
        private bool hideshow = true;

        protected override void Initialize()
        {
            buttonDraw();
        }

        private void buttonDraw()
        {
            var stackPanel = new StackPanel
            {
                HorizontalAlignment = HorizontalAlignment.Center,
                VerticalAlignment = VerticalAlignment.Bottom,
                Margin = 20
            };

            togglebutton = new ToggleButton
            {
                Text = "Hide",
                Width = 80
            };
            togglebutton.Click += togglebuttonclick;

            stackPanel.AddChild(togglebutton);

            Chart.AddControl(stackPanel);


        }
        private void togglebuttonclick(ToggleButtonEventArgs arg)
        {
            if (togglebutton.IsChecked)
            {
                hideshow = false;
                togglebutton.Text = "Show";

                for (int i = 0; i < Result.Count; i++)
                {
                    Result[i] = double.NaN;
                }
            }
            else
            {
                hideshow = true;
                togglebutton.Text = "Hide";

                for (int i = 0; i < Result.Count; i++)
                {
                    Calculate(i);
                }
            }
        }

        public override void Calculate(int index)
        {
            if (hideshow)
            {
                double sum = 0.0;

                for (int i = index - Periods + 1; i <= index; i++)
                {
                    sum += Source[i];
                }
                Result[index] = sum / Periods;
            }
        }
    }
}
Dear amusleh
you are great!
Thank you very much.
@yomm0401
yomm0401
27 Dec 2021, 10:19
RE:
amusleh said:
Hi,
As I said it works fine on my system:
Can you tell what's you system graphics card? most probably that's the issue as it can't process fast enough that amount of data.
That's the most likely scenario.
However, when I tried it on a laptop without a high performance graphics card, it displayed correctly.
So that means the problem is with my graphics card.
Thank you for taking care of this for me at the busy end of the year.
Have a happy new year
@yomm0401
yomm0401
24 Dec 2021, 12:02
RE:
amusleh said:
Hi,
I tired with your exact code and its working fine, I replicated your actions on the video and the bottom line didn't disappeared.
Can you tell me which broker cTrader you are using or which version? I tried on Spotware Beta cTrader 4.1.
I have also tested it with PulicBeta4.1 of SportWare cTrader, but it does not solve the problem of not showing up.
It looks like the video.
I thought it might be a memory issue, so I restarted the computer and checked with only one cTrader open.
Also, the specs of my computer is a desktop computer, Corei 7-7700K memory 16GB, so I don't think it's a problem.
@yomm0401
yomm0401
24 Dec 2021, 09:13
RE:
amusleh said:
Hi,
It works fine, try this:
using System;
using cAlgo.API;
using cAlgo.API.Internals;

namespace cAlgo
{
    [Indicator(IsOverlay = true, TimeZone = TimeZones.UTC, AccessRights = AccessRights.None)]
    public class TopYbottomYtest : Indicator
    {
        private double topY, bottomY;

        protected override void Initialize()
        {
            TopBottomYtest();
            Chart.ScrollChanged += onscrollchanged;
        }

        private void onscrollchanged(ChartScrollEventArgs f)
        {
            TopBottomYtest();
        }

        private void TopBottomYtest()
        {
            topY = Math.Round(Chart.TopY, Symbol.Digits);
            bottomY = Math.Round(Chart.BottomY, Symbol.Digits);
            Chart.DrawStaticText("test", "TOP " + topY.ToString() + " Bottom " + bottomY.ToString(), VerticalAlignment.Bottom, HorizontalAlignment.Center, Color.Red);
            Chart.DrawTrendLine("trendlinetesttop", Chart.FirstVisibleBarIndex, Chart.TopY, Chart.LastVisibleBarIndex, Chart.TopY, Color.Red, 30);
            Chart.DrawTrendLine("trendlinetestbottom", Chart.FirstVisibleBarIndex, Chart.BottomY, Chart.LastVisibleBarIndex, Chart.BottomY, Color.Red, 30);
        }

        public override void Calculate(int index)
        {
        }
    }
}
Thanks for the reply.
I have confirmed that the BottomY trendline does not disappear with your code.
However, the problem is that it does not show up when I specify it using a number from "LastVisibleBarIndex".
I don't want to show the trendline on all the bottoms of the chart.
I want to show the trendline on all the bottoms of the chart using a number from "LastVisibleBarIndex".
I want to show the trendline on plus or minus several bars from the "LastVisibleBarIndex".
In this sense, I think it is a bug in cTrader.
@yomm0401
yomm0401
29 Nov 2021, 16:39
RE:
amusleh said:
Hi,
The order and price alert lines are under chart and the mouse events will not work while cursor is over them.
You can use Chart mouse leave and enter events to get the latest cursor position, if you move mouse over these lines the chart mouse leave event will be triggered and when you move back to other areas of chart the mouse enter event will be triggered.
Thank you amusleh.
It would be nice to have an event to ignore the order and price alert lines.
@yomm0401
yomm0401
28 Apr 2021, 09:47
RE:
PanagiotisCharalampous said:
Hi yomm0401,
Check this discussion regarding margin calculation.
Best Regards,
Panagiotis
Dear PanagiotisCharalampous
Thanks reply.
I will check this discussion.
@yomm0401
yomm0401
13 Apr 2021, 15:59
RE: RE:
firemyst said:
amusleh said:
Hi,
Right now there is no way to change a chart time frame while a cBot instance is running on that chart.
We have plans to allow changing the time frame but we can't give you any ETA for that, I recommend you to open a thread for this feature request on forum suggestions section.
For clarification, yomm0401 didn't specifically ask if the "chart" time frame itself could be changed, only if the timeframe could be changed.
The answer to the latter question is yes in cBot code if that's what the intended question was.
The cbot code can always call:
MarketData.GetBars(TimeFrame.xxx, Symbol.Name);
and get data from a diffferent symbol and/or timeframe than what's on the chart.
thank you for your answer.
As you pointed out, what I wanted to ask was whether the chart timeframe could be changed.
I will propose it to the forum.
@yomm0401
yomm0401
13 Apr 2021, 15:56
RE:
amusleh said:
Hi,
Right now there is no way to change a chart time frame while a cBot instance is running on that chart.
We have plans to allow changing the time frame but we can't give you any ETA for that, I recommend you to open a thread for this feature request on forum suggestions section.
Dear amusleh
Thanks reply,
I will suggest.
@yomm0401
yomm0401
04 Mar 2021, 09:56
RE:
PanagiotisCharalampous said:
Hi yomm0401,
If you are looking for a setting to change the daily bars start time, then there isn't one available. Daily bars start at a specific time. If you want to program a custom data source that would use daily start time + a fixed time span then I think you can program that.
Best Regards,
Panagiotis
OK Thanks Panagiotis
@yomm0401
yomm0401
05 Aug 2020, 17:15
( Updated at: 21 Dec 2023, 09:22 )
RE: Thanks Mr Panagiotis
PanagiotisCharalampous said:
Hi yomm0401,
Just drag the time counter to the left
Best Regards,
Panagiotis
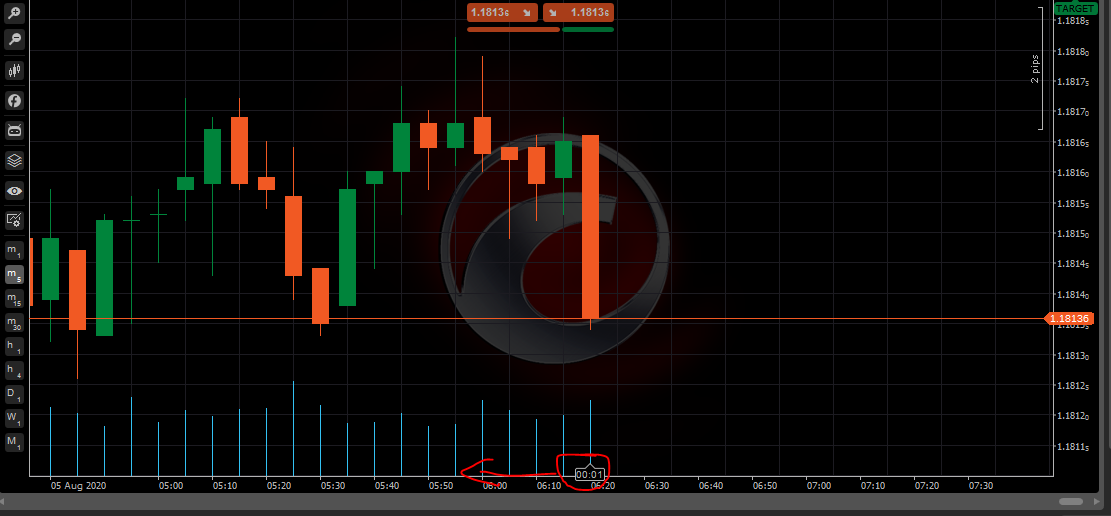
I know control this could drag the time counter to the left .
I mean can I use AIP to control the default position?
If you restart the app, the position will be returned every time.
I don’t feel like it.
Best Regards.
@yomm0401
yomm0401
30 May 2020, 15:26
RE:
firemyst said:
I'm not sure what you're expecting to see?
When I load up your indicator on an M5 chart, and select the timeframe to be M15, it shows. When I change it from M15 to M5, they overlap.
When I change the chart to M15 chart, and put the timeframe on M5, they both show as they should. When I set them both to M15 on the M15 chart, they both overlap.
??
Thank you very much for your quick response.
If the MA of the 15-minute time frame is displayed on the 5-minute chart, the MA will be displayed from the middle when you look at the past charts.
In that case, change the chart to the 15-minute bar, scroll to the past data, return to the 5-minute bar chart and scroll to the past data, and it will be displayed.
I was able to confirm it. Thank you very much.
The problem I want to solve is whether I can update the MA when I look at the historical data in the 5-minute chart without changing the chart to the 15-minute chart.
Does the data of different time frame have to be read only after changing to the specified time frame chart?
@yomm0401
yomm0401
24 Jul 2023, 06:47
RE: How can I get the latest position information?
PanagiotisChar said:
Appreciate the replies.
You have solved all my problems.
Thank you.
@yomm0401