Topics
Replies
alexnikon
21 Sep 2020, 10:12
RE:
PanagiotisCharalampous said:
Hi alexnikon,
I had a look at the cBot and the indicator and I do not see anything wrong. But from what I understand you are comparing irrelevant information. You are opening trades in the middle of the daily bar based on the current state of the daily moving average but you compare the conditions with the indicator calculated using the finalized daily bar. This is wrong since the values of the finalized daily bar are different from the value of the indicator at the current moment the order was executed.
Best Regards,
Panagiotis
Ok. Thanks a lot! It's promising.
Can be a way to synchronise the visual and real trades? I did try to feel the gaps using the operators 'for' and 'if' but haven't succeed...
@alexnikon
alexnikon
18 Sep 2020, 13:43
RE: RE: RE:
alexnikon said:
alexnikon said:
PanagiotisCharalampous said:
Hi alexnikon,
I am sorry but this is still very confusing
The indicators are the MTF_MA with a method advised by your teamWhat is this indicator? When and where did we advise for this method? Where is this used in the cBot?
What are the lines we are looking at on the screen?
Can you provide all the cBot parameters so that we can reproduce the exact same results as you.
Best Regards,
Panagiotis
Hi Panagiotis
I have sent you two same texts answers to your questions, but the confirmation email never came back to me for some reason. It looks like the texts were too large with all codes and pictures included. Sorry for this. I do it again in a shorter format without repeating cBot cod and pictures published earlier on this thread…
I have used the Multi-Time-frame method described on this Forum. Click this link: https://ctrader.com/forum/announcements/1463
This my cod is just a transparent way to see the problem, but I have tried a few options. You also published earlier on this forum a sample Bot for MACD indicator using this method. I have simplified your bot to have one only open position at time, and it has the same not-matching issue.
To reproduce this cod, open it please for the GBPUSD pare on the ‘h1’ screen with default parameters: MTF Hull-MA D1 20 and Hull-MA H1 15. In my sample I have back-tested it over 5 years period for $1000 with total profit of $656. But the analysis shows that the Bot is running his own strategy. To see the problem you have to compare the crossover points of two MTF MA indicators with the trading points of the standard Deal Map. On my pictures the indicators are represented by yellow lines.
My MTF MA indicator is based on the cod with operator ‘GetIndexByDate’ which you have advised to me before for my MTF Gann-High-Low indicator. I also seen it in a few other examples in this forum. I have used it for different indicators, and it works perfectly for live trading on the screen. Thanks a lot. But it gives natural flat ‘gaps’ between the bars using it on the shorter time frames. This might cause the problem for cBots, as I imagine. I’ll send full code to you in next text message...
See next message...
Code of the indicator:
using System;
using cAlgo.API;
using cAlgo.API.Internals;
using cAlgo.API.Indicators;
namespace cAlgo.Indicators
{
[Indicator(IsOverlay = true, TimeZone = TimeZones.UTC)]
public class MyMTF_MA : Indicator
{
[Parameter("Timeframe", DefaultValue = "Hourly")]
public TimeFrame CustomTimeFrame { get; set; }
[Parameter("MA Type", DefaultValue = MovingAverageType.Simple)]
public MovingAverageType MAType { get; set; }
[Parameter(DefaultValue = 5)]
public int Period { get; set; }
[Output("MA", LineColor = "#FFFFFF01")]
public IndicatorDataSeries Result { get; set; }
private Bars bars;
private MovingAverage ma;
//-----------------------------------------------------------------------
protected override void Initialize()
{
bars = MarketData.GetBars(CustomTimeFrame);
ma = Indicators.MovingAverage(bars.ClosePrices, Period, MAType);
}
//-----------------------------------------------------------------------
public override void Calculate(int index)
{
var customIndex = GetIndexByDate(bars, Bars.OpenTimes[index]);
if (customIndex != -1)
Result[index] = ma.Result[customIndex];}
// Sub-Programme (smothing ??) -------------------------------------------
private int GetIndexByDate(Bars bars, DateTime time)
{
for (int i = bars.ClosePrices.Count - 1; i > 0; i--)
{
if (time == bars.OpenTimes[i])
return i;
}
return -1;
}
}
}
I hope this clarifies my problem. Sorry for the mess. But I'm an absolutely beginner in programming, just trying to preserve my nervous for the live trading :))
Thanks in advance...
@alexnikon
alexnikon
18 Sep 2020, 13:37
RE: RE:
alexnikon said:
PanagiotisCharalampous said:
Hi alexnikon,
I am sorry but this is still very confusing
The indicators are the MTF_MA with a method advised by your teamWhat is this indicator? When and where did we advise for this method? Where is this used in the cBot?
What are the lines we are looking at on the screen?
Can you provide all the cBot parameters so that we can reproduce the exact same results as you.
Best Regards,
Panagiotis
Hi Panagiotis
I have sent you two same texts answers to your questions, but the confirmation email never came back to me for some reason. It looks like the texts were too large with all codes and pictures included. Sorry for this. I do it again in a shorter format without repeating cBot cod and pictures published earlier on this thread…
I have used the Multi-Time-frame method described on this Forum. Click this link: https://ctrader.com/forum/announcements/1463
This my cod is just a transparent way to see the problem, but I have tried a few options. You also published earlier on this forum a sample Bot for MACD indicator using this method. I have simplified your bot to have one only open position at time, and it has the same not-matching issue.
To reproduce this cod, open it please for the GBPUSD pare on the ‘h1’ screen with default parameters: MTF Hull-MA D1 20 and Hull-MA H1 15. In my sample I have back-tested it over 5 years period for $1000 with total profit of $656. But the analysis shows that the Bot is running his own strategy. To see the problem you have to compare the crossover points of two MTF MA indicators with the trading points of the standard Deal Map. On my pictures the indicators are represented by yellow lines.
My MTF MA indicator is based on the cod with operator ‘GetIndexByDate’ which you have advised to me before for my MTF Gann-High-Low indicator. I also seen it in a few other examples in this forum. I have used it for different indicators, and it works perfectly for live trading on the screen. Thanks a lot. But it gives natural flat ‘gaps’ between the bars using it on the shorter time frames. This might cause the problem for cBots, as I imagine. I’ll send full code to you in next text message...
See next message...
Code of the indicator:
using System;
using cAlgo.API;
using cAlgo.API.Internals;
using cAlgo.API.Indicators;
namespace cAlgo.Indicators
{
[Indicator(IsOverlay = true, TimeZone = TimeZones.UTC)]
public class MyMTF_MA : Indicator
{
[Parameter("Timeframe", DefaultValue = "Hourly")]
public TimeFrame CustomTimeFrame { get; set; }
[Parameter("MA Type", DefaultValue = MovingAverageType.Simple)]
public MovingAverageType MAType { get; set; }
[Parameter(DefaultValue = 5)]
public int Period { get; set; }
[Output("MA", LineColor = "#FFFFFF01")]
public IndicatorDataSeries Result { get; set; }
private Bars bars;
private MovingAverage ma;
//-----------------------------------------------------------------------
protected override void Initialize()
{
bars = MarketData.GetBars(CustomTimeFrame);
ma = Indicators.MovingAverage(bars.ClosePrices, Period, MAType);
}
//-----------------------------------------------------------------------
public override void Calculate(int index)
{
var customIndex = GetIndexByDate(bars, Bars.OpenTimes[index]);
if (customIndex != -1)
Result[index] = ma.Result[customIndex];
}
// Sub-Programme (smothing ??) -------------------------------------------
private int GetIndexByDate(Bars bars, DateTime time)
{
for (int i = bars.ClosePrices.Count - 1; i > 0; i--)
{
if (time == bars.OpenTimes[i])
return i;
}
return -1;
}
}
}
@alexnikon
alexnikon
18 Sep 2020, 13:35
RE:
PanagiotisCharalampous said:
Hi alexnikon,
I am sorry but this is still very confusing
The indicators are the MTF_MA with a method advised by your teamWhat is this indicator? When and where did we advise for this method? Where is this used in the cBot?
What are the lines we are looking at on the screen?
Can you provide all the cBot parameters so that we can reproduce the exact same results as you.
Best Regards,
Panagiotis
Hi Panagiotis
I have sent you two same texts answers to your questions, but the confirmation email never came back to me for some reason. It looks like the texts were too large with all codes and pictures included. Sorry for this. I do it again in a shorter format without repeating cBot cod and pictures published earlier on this thread…
I have used the Multi-Time-frame method described on this Forum. Click this link: https://ctrader.com/forum/announcements/1463
This my cod is just a transparent way to see the problem, but I have tried a few options. You also published earlier on this forum a sample Bot for MACD indicator using this method. I have simplified your bot to have one only open position at time, and it has the same not-matching issue.
To reproduce this cod, open it please for the GBPUSD pare on the ‘h1’ screen with default parameters: MTF Hull-MA D1 20 and Hull-MA H1 15. In my sample I have back-tested it over 5 years period for $1000 with total profit of $656. But the analysis shows that the Bot is running his own strategy. To see the problem you have to compare the crossover points of two MTF MA indicators with the trading points of the standard Deal Map. On my pictures the indicators are represented by yellow lines.
My MTF MA indicator is based on the cod with operator ‘GetIndexByDate’ which you have advised to me before for my MTF Gann-High-Low indicator. I also seen it in a few other examples in this forum. I have used it for different indicators, and it works perfectly for live trading on the screen. Thanks a lot. But it gives natural flat ‘gaps’ between the bars using it on the shorter time frames. This might cause the problem for cBots, as I imagine. I’ll send full code to you in next text message...
See next message...
@alexnikon
alexnikon
17 Sep 2020, 12:00
( Updated at: 21 Dec 2023, 09:22 )
RE: Multitimrframe
PanagiotisCharalampous said:
Hi alexnikon,
Thanks but I still need some steps to reproduce the problem. What am I supposed to be looking at?
Best Regards,
Panagiotis
Hi Panagiotis
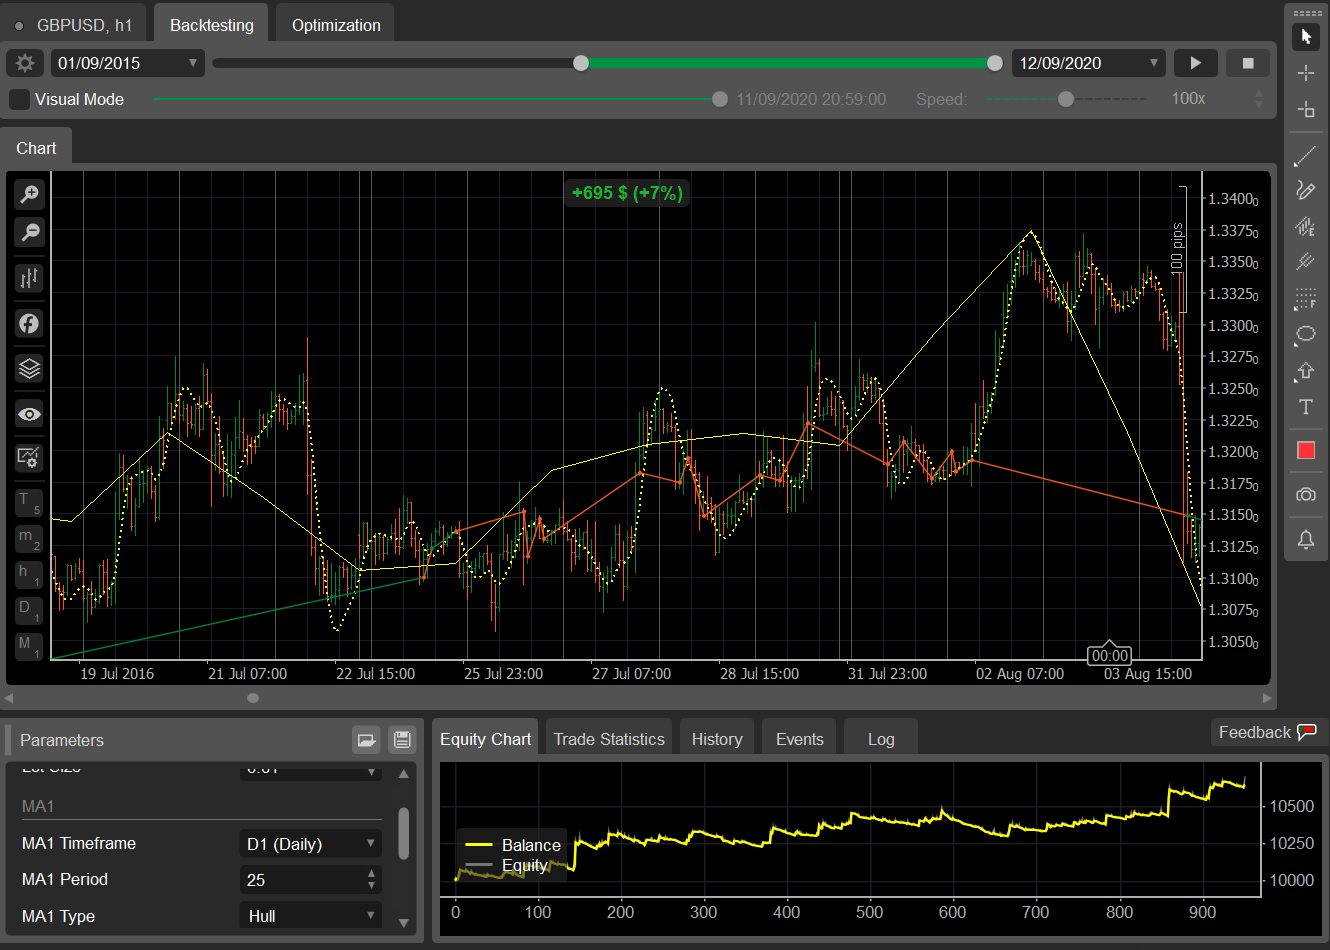
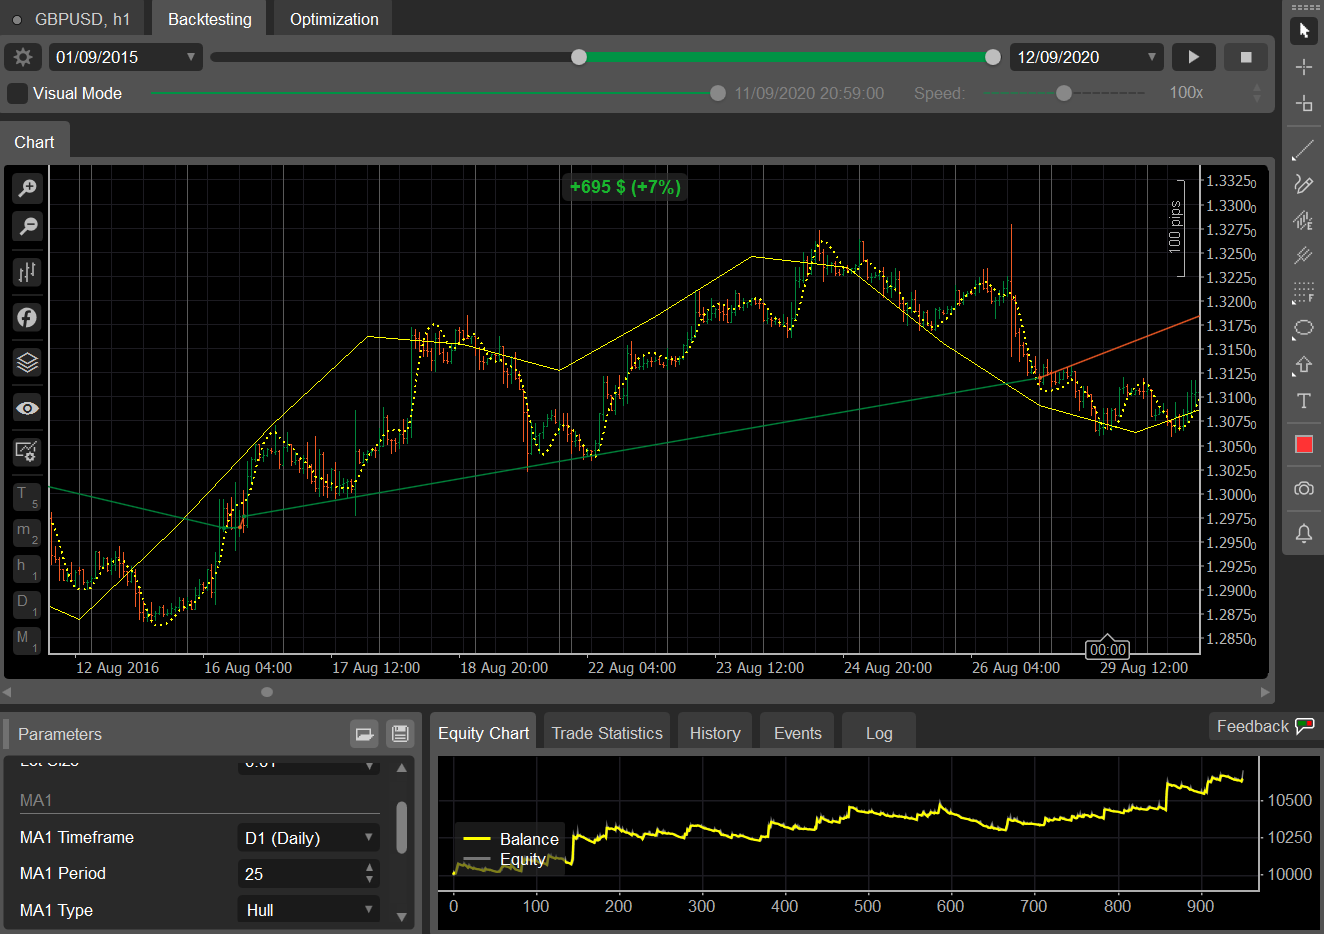
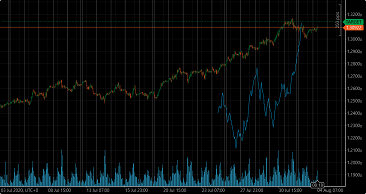
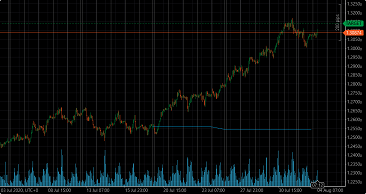
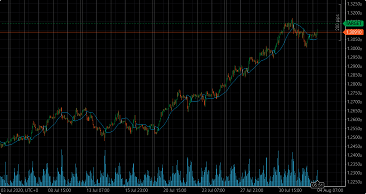
Here are the pictures of the deal map of back-testing of this cBot. It is testing the MA cross-over trigger over 5 years DB on the h1 screen. The indicators are the MTF_MA with a method advised by your team. The Hull-MA period 25 of D1 crosses with the Hull-MA period 6 of the h1 timeframe (as the screen).
The trading is profitable, but is clearly chaotic. You can see that the lines crossings don't match at all with the deal map trading points. I would blame. The same happen with other indicators and frames combinations.
I would be really please with your help. Thank you...
@alexnikon
alexnikon
16 Sep 2020, 15:02
RE:
PanagiotisCharalampous said:
Hi alexnikon,
To be able to understand the problem you need to share with us your cBot and indicators code as well as steps to reproduce the problem.
Best Regards,
Panagiotis
Dear Panagiotis. It's nice to hear from you again.
In this sample I have used the cBot advised by you for MA. The trading method is different to have only one open position at time.
Here it is:
using System;
using System.Linq;
using cAlgo.API;
using cAlgo.API.Indicators;
using cAlgo.API.Internals;
using cAlgo.Indicators;
namespace cAlgo.Robots
{
[Robot(TimeZone = TimeZones.UTC, AccessRights = AccessRights.None)]
public class MyBot11MTF_MA : Robot
{
[Parameter("Instance Name", DefaultValue = "001")]
public string InstanceName { get; set; }
[Parameter("Lot Size", DefaultValue = 0.01)]
public double LotSize { get; set; }
//........................................................................
[Parameter("MA1 Timeframe", Group = "MA1", DefaultValue = "Daily")]
public TimeFrame TimeframeMA1 { get; set; }
[Parameter("MA2 Timeframe", Group = "MA2", DefaultValue = "Hourly")]
public TimeFrame TimeframeMA2 { get; set; }
[Parameter("MA1 Period", Group = "MA1", DefaultValue = 20)]
public int PeriodMA1 { get; set; }
[Parameter("MA2 Period", Group = "MA2", DefaultValue = 15)]
public int PeriodMA2 { get; set; }
[Parameter("MA1 Type", Group = "MA1", DefaultValue = MovingAverageType.Hull)]
public MovingAverageType MA1Type { get; set; }
[Parameter("MA2 Type", Group = "MA2", DefaultValue = MovingAverageType.Hull)]
public MovingAverageType MA2Type { get; set; }
//................... Indicators declarations .....................
private Bars barsTF1;
private Bars barsTF2;
private MovingAverage ma1;
private MovingAverage ma2;
//------------------- Indicators construction ---------------------
protected override void OnStart()
{
barsTF1 = MarketData.GetBars(TimeframeMA1);
barsTF2 = MarketData.GetBars(TimeframeMA2);
ma1 = Indicators.MovingAverage(barsTF1.ClosePrices, PeriodMA1, MA1Type);
ma2 = Indicators.MovingAverage(barsTF2.ClosePrices, PeriodMA2, MA2Type);
}
//............................. Trading ...........................
protected override void OnBar()
{
Triggers();
}
//........................... Finish of a loop ....................
protected override void OnStop()
{
Print("Successful day!");
// this metod can be used to clean-up memory resources
}
//==================================================================
private void Triggers()
{
if (ma2.Result.LastValue > ma1.Result.LastValue)
{
ClosePosition(TradeType.Sell);
if (!IsPositionOpenByType(TradeType.Buy))
{
OpenPosition(TradeType.Buy);
}
}
//.....................................................................
if (ma2.Result.LastValue < ma1.Result.LastValue)
{
ClosePosition(TradeType.Buy);
if (!IsPositionOpenByType(TradeType.Sell))
{
OpenPosition(TradeType.Sell);
}
}
}
//============================ TRADING ===============================
private void OpenPosition(TradeType type)
{
// calculate volume from lot size
double volume = Symbol.QuantityToVolumeInUnits(LotSize);
// open a new position
ExecuteMarketOrder(type, this.SymbolName, volume, InstanceName, null, null);
}
private void ClosePosition(TradeType type)
{
var p = Positions.Find(InstanceName, this.SymbolName, type);
if (p != null)
{
ClosePosition(p);
}
}
// position Information
private bool IsPositionOpenByType(TradeType type)
{
var p = Positions.FindAll(InstanceName, SymbolName, type);
if (p.Count() >= 1)
{
return true;
}
return false;
}
}
}
@alexnikon
alexnikon
04 Aug 2020, 12:18
( Updated at: 21 Dec 2023, 09:22 )
RE:
PanagiotisCharalampous said:
Hi alexnikon,
I used the same timeframes but the chart looks fine to me
Best Regards,
Panagiotis


Oooo!! I hope I'm wrong. I'll try to fit it in a robot. Thank you very much. I highly appreciate your help!
@alexnikon
alexnikon
04 Aug 2020, 11:14
( Updated at: 21 Dec 2023, 09:22 )
RE: RE:
alexnikon said:
PanagiotisCharalampous said:
Hi alexnikon,
I cannot help you further at the moment because I have no idea what is the indicator expected to do. You need to provide more information of what the expected outcome should be and what does the indicator do instead. Screenshots would be helpful.
Best Regards,
Panagiotis
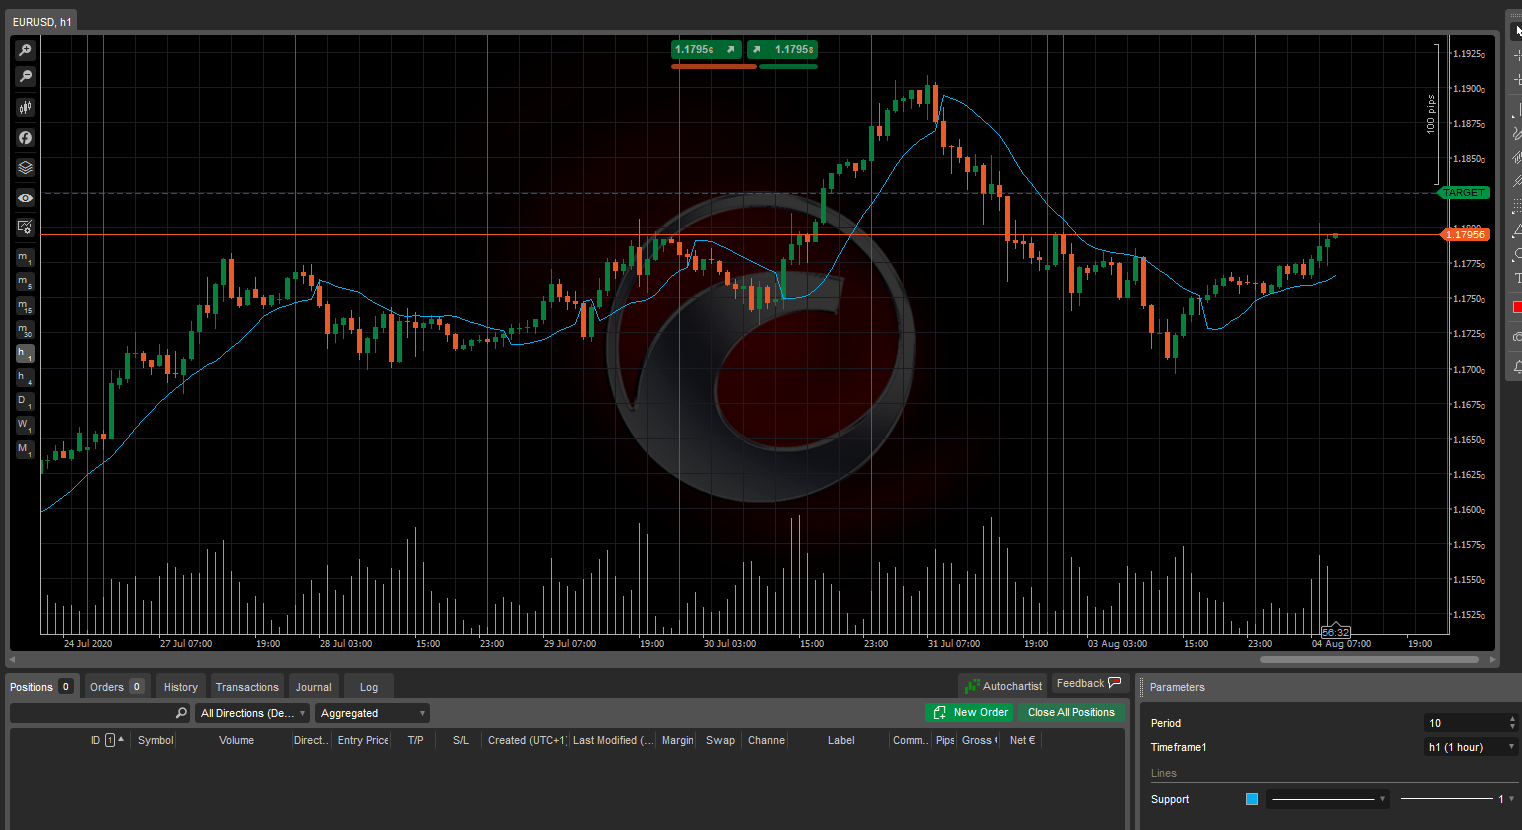
Dear PanagiotisCharalampous. Thank you very much again. Sorry, the Gann-High-Low indicator isn't very popular. It is based on moving averages of High and Low prices of the series. It shows only one of them which is below the trend - would it be the average of Highs or Lows depending of the trend direction. The line sharply swaps the side around the trend when the Close price penetrates the actual high or low price average line in the opposite movement and the trend changes direction (pict.1).
Not sure whether my explanation is clear, but hope the pictures can help. I sorry for asking so much attention... Thanks in advance...
Pic.1

Dear Panagiotic
Here you can see what the H1 chart looks like when I use consecutively M5, Daily and H1 (normal) custom frames.
(Sorry for publishing them this way. Can not see how to attach the link from cTrader directly...)
Thank you very much.
@alexnikon
alexnikon
03 Aug 2020, 23:41
RE:
PanagiotisCharalampous said:
Hi alexnikon,
I cannot help you further at the moment because I have no idea what is the indicator expected to do. You need to provide more information of what the expected outcome should be and what does the indicator do instead. Screenshots would be helpful.
Best Regards,
Panagiotis
Dear PanagiotisCharalampous. Thank you very much again. Sorry, the Gann-High-Low indicator isn't very popular. It is based on moving averages of High and Low prices of the series. It shows only one of them which is below the trend - would it be the average of Highs or Lows depending of the trend direction. The line sharply swaps the side around the trend when the Close price penetrates the actual high or low price average line in the opposite movement and the trend changes direction (pict.1).
Not sure whether my explanation is clear, but hope the pictures can help. I sorry for asking so much attention... Thanks in advance...
Pic.1
@alexnikon
alexnikon
03 Aug 2020, 15:41
RE:
PanagiotisCharalampous said:
Hi alexnikon,
I am not sure what is the indicator supposed to do but your indexing is definitely wrong. See below how to get the correct indices for your indicators
            double smaHigh = _smaHigh.Result[_bars.OpenTimes.GetIndexByTime(Bars.OpenTimes[index]) - 0];
            double smaHighPrev = _smaHigh.Result[_bars.OpenTimes.GetIndexByTime(Bars.OpenTimes[index]) - 1];
            double smaLow = _smaLow.Result[_bars.OpenTimes.GetIndexByTime(Bars.OpenTimes[index]) - 0];
            double smaLowPrev = _smaLow.Result[_bars.OpenTimes.GetIndexByTime(Bars.OpenTimes[index]) - 1];
Let me know if this helps
Best Regards,
Panagiotis
Thanks a lot !! It looks better. It draws more sensible line if the Custom timescale is shorter than the carrier chart, but it is still wrong if it is longer. F.e. on the base H1 chart, the Custom frame M10 looks nearly properly (even not sure), but the D1 is wrong...
Note: I want eventually use the GannHiLo for a cBot to trigger when Close price crosses the HiLo on the triple screen view (by Elder). It seams to be working as a kind of dynamic support line...
The updated code with your suggestion follows:
using System;
using cAlgo.API;
using cAlgo.API.Internals;
using cAlgo.API.Indicators;
using cAlgo.Indicators;
namespace cAlgo
{
[Indicator(IsOverlay = true, AccessRights = AccessRights.None)]
public class MyMultiFrameHiLo2 : Indicator
{
[Parameter("Period", DefaultValue = 10)]
public int Period { get; set; }
[Parameter("Timeframe1", DefaultValue = "Daily")]
public TimeFrame Timeframe { get; set; }
[Output("Support", LineColor = "#FF02AFF1", Thickness = 1)]
public IndicatorDataSeries Support { get; set; }
private Bars _bars;
private SimpleMovingAverage _smaHigh;
private SimpleMovingAverage _smaLow;
protected override void Initialize()
{
_bars = MarketData.GetBars(Timeframe);
_smaHigh = Indicators.SimpleMovingAverage(_bars.HighPrices, Period);
_smaLow = Indicators.SimpleMovingAverage(_bars.LowPrices, Period);
}
public override void Calculate(int index)
{
if (index < Period)
return;
double close = Bars.ClosePrices[index];
/* ------ excluded ----------------------------------------
double smaHigh = _smaHigh.Result[index - 0];
double smaHighPrev = _smaHigh.Result[index - 1];
double smaLow = _smaLow.Result[index - 0];
double smaLowPrev = _smaLow.Result[index - 1];
------------------------------------------------------------*/
double smaHigh = _smaHigh.Result[_bars.OpenTimes.GetIndexByTime(Bars.OpenTimes[index]) - 0];
double smaHighPrev = _smaHigh.Result[_bars.OpenTimes.GetIndexByTime(Bars.OpenTimes[index]) - 1];
double smaLow = _smaLow.Result[_bars.OpenTimes.GetIndexByTime(Bars.OpenTimes[index]) - 0];
double smaLowPrev = _smaLow.Result[_bars.OpenTimes.GetIndexByTime(Bars.OpenTimes[index]) - 1];
//------------------------------------------------------------------------
if (close > smaHigh)
Support[index] = smaLow;
else
{
if (close < smaLow)
Support[index] = smaHigh;
else
{
if (Support[index - 1] == smaHighPrev)
Support[index] = smaHigh;
else
Support[index] = smaLow;
}
}
}
}
}
@alexnikon
alexnikon
03 Aug 2020, 13:04
RE:
PanagiotisCharalampous said:
Hi alexnikon,
To give you an advice, you need to provide more information. It would be better to create a new thread, post your code and explain your issue in detail.
Best Regards,
Panagiotis
Dear PanagiotisCharalampous thanks a lot for the reply. Greatly appreciated...
I'm traying to design a GannHighLow Multi-Timeframe indicator useful to build up a multi-frame cBot afterwards, and with no success at the moment.
I have tried a referencing and also a direct re-coding of the provided by cTrader samples. Still no success. Both options work well on the chats with the same time scale, but are showing some nonsense lines on the chats with longer or shorter timeframes. It looks like the problem is in re-indexing of series for the Custom Timeframe. The HiLo is using the [index - 1] value, which might be deteriorating the graph, but my knowledge is too limited to sort it out. It would be great, if you could give some advise... Thanks in advance.
One of the codes, which I'm trying to finish, is here:
// from updated "GannHighLow" by 'kalex718' at 12/09/2012
using System;
using cAlgo.API;
using cAlgo.API.Internals;
using cAlgo.API.Indicators;
using cAlgo.Indicators;
namespace cAlgo
{
[Indicator(IsOverlay = true, AccessRights = AccessRights.None)]
public class MyMultiFrameHiLo2 : Indicator
{
[Parameter("Period", DefaultValue = 10)]
public int Period { get; set; }
[Parameter("Timeframe1", DefaultValue = "Daily")]
public TimeFrame Timeframe { get; set; }
[Output("Support", LineColor = "#FF02AFF1", Thickness = 1)]
public IndicatorDataSeries Support { get; set; }
private Bars _bars;
private SimpleMovingAverage _smaHigh;
private SimpleMovingAverage _smaLow;
//-------------------------------------------------------------------------------------------------------
protected override void Initialize()
{
_bars = MarketData.GetBars(Timeframe);
_smaHigh = Indicators.SimpleMovingAverage(_bars.HighPrices, Period);
_smaLow = Indicators.SimpleMovingAverage(_bars.LowPrices, Period);
}
public override void Calculate(int index)
{
if (index < Period)
return;
double close = Bars.ClosePrices[index];
double smaHigh = _smaHigh.Result[index - 0];
double smaHighPrev = _smaHigh.Result[index - 1];
double smaLow = _smaLow.Result[index - 0];
double smaLowPrev = _smaLow.Result[index - 1];
//-------------------------------------------------------------------------------------------------------
if (close > smaHigh)
Support[index] = smaLow;
else
{
if (close < smaLow)
Support[index] = smaHigh;
else
{
if (Support[index - 1] == smaHighPrev)
Support[index] = smaHigh;
else
Support[index] = smaLow;
}
}
}
}
}
@alexnikon
alexnikon
01 Aug 2020, 13:27
multi-timeframes
Hi guys. I'm struggling to make a multi-time-frame Gann-high-low indicator. I have tried to use all examples from the website, but with no success. It doesn't want to recognise the custom time-frames and doesn't work properly. Could some one give me an advise, please?..
@alexnikon
alexnikon
27 Jul 2020, 09:22
Multi-timeframe
Great solution! It works! But the Build Results give me that MarketSeries method is obsolete. Could you advise how update it?
@alexnikon
alexnikon
22 Sep 2020, 23:38
RE:
PanagiotisCharalampous said:
Thank you, Panagiotis. I have tried another MTF MA method, advised by your team, and it is feeling the data from the long term frame for every bar of the shortest time frames. It looks like it will work for other indicators and the live trading. A huge thanks...
@alexnikon