Topics
Replies
RayAdam
02 Aug 2022, 02:59
( Updated at: 21 Dec 2023, 09:22 )
RE: And if you didn t remember to install Net 6 sdk and runtimes from the microsoft official page
paolo.panicali said:
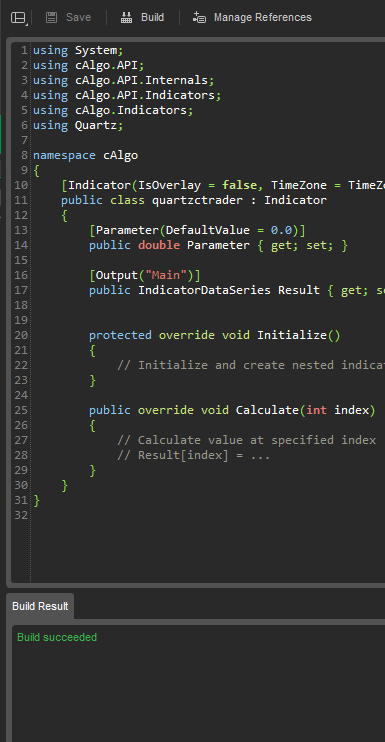
Thanks again for your input, appreciated. I have changed the compiler to 6.0 as per your post and successfully build inside cTrader platform. But "using Quartz" is still showing red line underneath and on mouse hovering show the below message. any thought on that?

@RayAdam
RayAdam
01 Aug 2022, 15:18
( Updated at: 21 Dec 2023, 09:22 )
RE: Build succeded...Quartz 2.6.2
paolo.panicali said:
I necessarily have to use a net version >4 for a project, so what I did was a console App in visual studio and made the Ctrader Bot or Indicator executing it and catching the output value/s:
string filename = "C:\\Yourpath\\ConsoleApp1.exe";
var proc = System.Diagnostics.Process.Start(filename, text);
proc.CloseMainWindow();
proc.Close();At least this is what I found out, maybe Spotaware team can provide you a better solution...
bye
thanks for your input but seems like you are still on cTrader 4.1 platform. I have no problem on 4.1 as I mentioned in my post already.
My cTrader platform has upgraded recently to 4.2.16 which is using dot net version 6 and I'm getting the error since.
Waiting for spotware to respond with some workaround or a permanent fix
@RayAdam
RayAdam
24 May 2021, 15:59
( Updated at: 25 May 2021, 00:59 )
RE: Issue with Ctrl + W Shortcut
Hi Team,
HotKey Ctrl + W - Show/hide Tradewatch at the bottom
At my end, Ctrl + W - does not perform it's function instead it Restore the ICMarket Window. Could you please see if that's the case at your end too?
Thanks
Update: No issue with cTrader but it's the multimonitor software on my PC which has taken this key for window restore. thnx
@RayAdam
RayAdam
29 May 2020, 16:08
( Updated at: 21 Dec 2023, 09:22 )
RE:
Thanks Panagiotis for prompt reply,
I have update the OnStart() method below as advised but system goes into an infinite loop and had to stop it. For some reason LoadMoreHistory() is not functioning as expected please see the logs below.
protected override void OnStart()
        {
            Series = MarketData.GetBars(otherTF);

            SMA = CreateDataSeries();
            _SMA = Indicators.SimpleMovingAverage(Series.ClosePrices, inputSMA);

            int SeriesBarsCountBeforeLoadMoreHistory = Series.Count;

            while (Series.Count < inputSMA)
            {
                Series.LoadMoreHistory();
                Print("Series BarsCount Before LoadMoreHistory: {0}, Series BarsCount After LoadMoreHistory: {1}", SeriesBarsCountBeforeLoadMoreHistory, Series.Count);
            }
        }
Logs

I even tried LoadMoreHistory() with Chart Time Frame (Bars) but encountered similar issue.
Restarted cTrader but same issue.
Could you please see and advise
Thanks
@RayAdam
RayAdam
03 Jun 2019, 18:34
( Updated at: 21 Dec 2023, 09:21 )
Thanks Panagiotis for looking into it
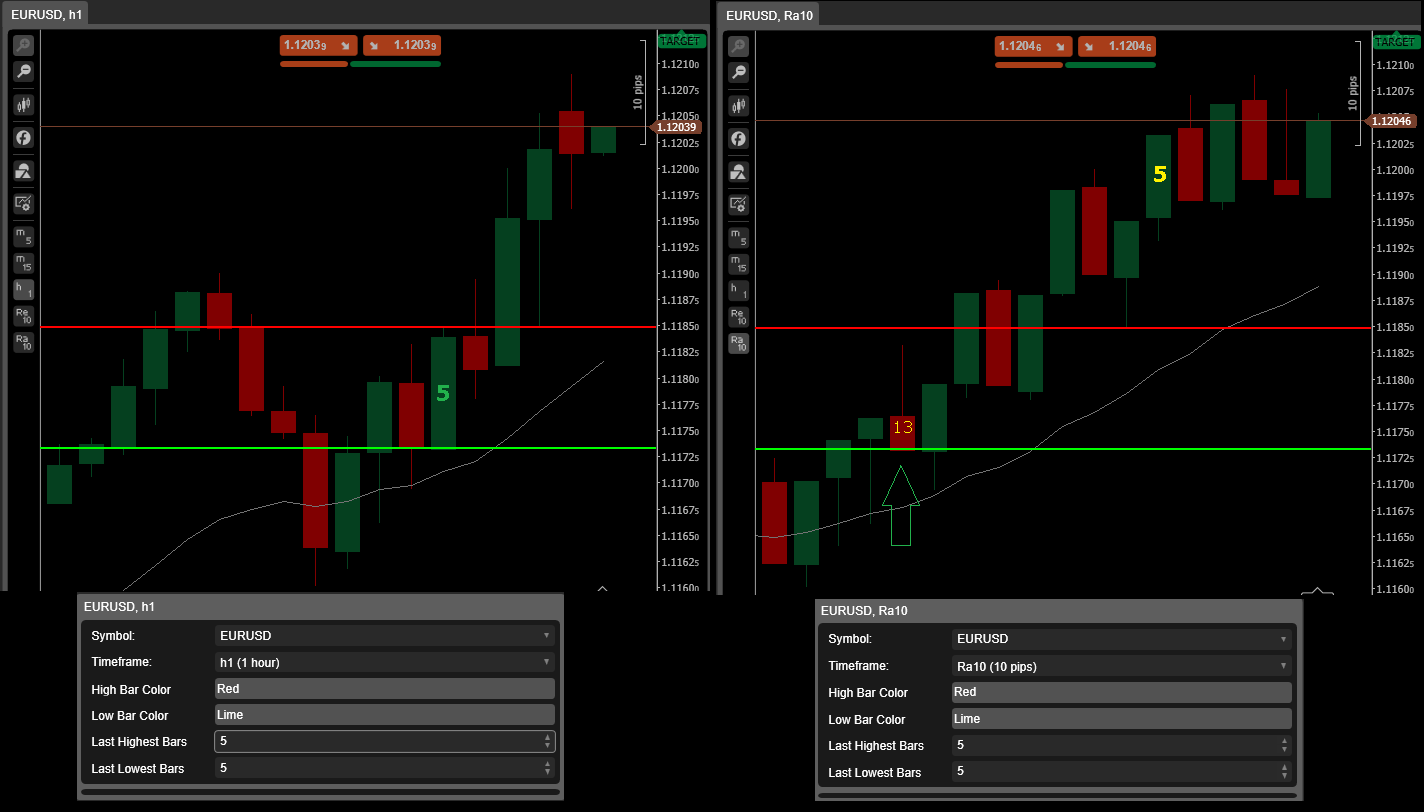
Please see the attached Candle chart as well as Range Chart
H1 Candle Chart has no issues
Range Chart is plotting lines but not at the right candle
I couldn’t find syntax equivalent to TimeFrame to call Range chart and I think as I have used TimeFrame.Hour at line 34 so indicator is ignoring supplied Range chart parameters and plotting the lines which are in line with H1 TimeFrame candles.
Whereas I want exactly the opposite, plotting lines on Candle chart (any TF) which are in line with Range Candles on set number of Pips

using System;
using cAlgo.API;
using cAlgo.API.Internals;
using cAlgo.API.Indicators;
using cAlgo.Indicators;

namespace cAlgo
{
    [Indicator(IsOverlay = true, TimeZone = TimeZones.UTC, AccessRights = AccessRights.None)]
    public class HighLow : Indicator
    {

        [Parameter("High Bar Color", DefaultValue = "Red")]
        public string ColorH { get; set; }

        [Parameter("Low Bar Color", DefaultValue = "Lime")]
        public string ColorL { get; set; }

        [Parameter("Last Highest Bars", DefaultValue = "5")]
        public int HighBars { get; set; }

        [Parameter("Last Lowest Bars", DefaultValue = "5")]
        public int LowBars { get; set; }


        protected override void Initialize()
        {
            // Initialize and create nested indicators
        }

        public override void Calculate(int index)
        {

            var series = MarketData.GetSeries(TimeFrame.Hour);
            var highPrice = series.High.Last(HighBars);
            var lowPrice = series.Low.Last(LowBars);

            Chart.DrawHorizontalLine("Resistance Area", highPrice, ColorH, 2, LineStyle.Solid);
            Chart.DrawHorizontalLine("Support Area", lowPrice, ColorL, 2, LineStyle.Solid);

        }
    }
}
@RayAdam


RayAdam
18 Oct 2022, 01:51 ( Updated at: 21 Dec 2023, 09:22 )
RE: RE:
yuval.ein said:
getting the same error with 1.0.3 which was published yesterday, 17 Oct.
@RayAdam