Topics
Replies
calgodemo
09 Apr 2020, 08:59
( Updated at: 21 Dec 2023, 09:21 )
RE: RE:
firemyst said:
calgodemo said:
Hey all,
At the bottom of the ctrader window where it shows 'Current Time', the time, then the timezone, my time is incorrect.
I have everything set to UTC-5 (NY, East coast - the same as my local system time which also says UTC-5), however the time itself is an hour behind, or in my case Central Standard Time.
Is it not updating for daylight savings? if my bot/indicator codes use the same timeframe will this affect execution at all?
Many thanks!
CaD
Can you post a screen capture please showing the time differences?

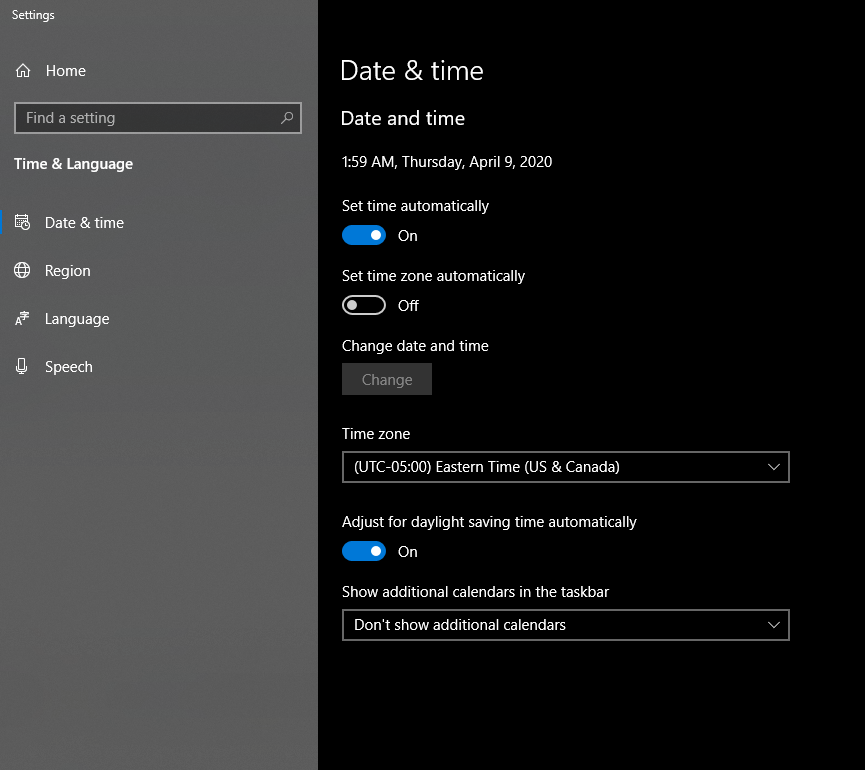
As of this posting, it is nearly 2am in NYC, yet my ctrader instance is trying to tell me it's still winter.
Thanks!
CaD
@calgodemo
calgodemo
03 Apr 2020, 20:52
Couldn't find anything like that either, shouldn't be too difficult to program a custom indicator to draw a horizontal line on the previous days high/low.
You can use the DrawHoritzontalLine function, all it requires is a color and a value for the price, which can be found any number of ways...
Good luck!
CaD
@calgodemo
calgodemo
12 Mar 2020, 17:53
RE:
PanagiotisCharalampous said:
Hi calgodemo,
Here is a starting point
        private void IndicatorArea_Click(ChartMouseEventArgs obj)
        {
            var text1 = new TextBlock
            {
                BackgroundColor = Color.Red,
                Text = "Test",
                Width = 30,
                Height = 10,
                HorizontalAlignment = HorizontalAlignment.Left,
                VerticalAlignment = VerticalAlignment.Top
            };

            text1.Margin = new Thickness(obj.MouseX, obj.MouseY, 0, 0);
            IndicatorArea.AddControl(text1);
        }
Best Regards,
Panagiotis
Thank you! That did for a start!
CaD
@calgodemo
calgodemo
11 Mar 2020, 23:48
Essentially I'd like to replicate what happens in ctrader normally when I hover over an indicator value, with the box and everything nice and neatly. Just with my own values.
@calgodemo
calgodemo
30 Jan 2020, 17:47
RE:
PanagiotisCharalampous said:
Hi calgodemo,
This should work on indicators as well. If you can share the complete indicator code, we can have a look.
Best Regards,
Panagiotis
can I share with you privately?
@calgodemo
calgodemo
27 Jan 2020, 22:14
( Updated at: 19 Mar 2025, 08:57 )
RE:
PanagiotisCharalampous said:
Hi zendoo,
Sure, you can send it at support@ctrader.com.
Best Regards,
Panagiotis
If there was something that needs to be done to fix this can the solution be shared? I'm also experiencing this in backtesting since 3.7 upgrade came along.
Much appreciated,
CaD
@calgodemo
calgodemo
27 Dec 2019, 19:59
RE:
PanagiotisCharalampous said:
Hi calgodemo,
It is not possible to take chart screenshots using the API at the moment.
Best Regards,
Panagiotis
Thanks!
CaD
@calgodemo
calgodemo
15 Nov 2019, 22:04
There may be something like that - admittedly it's not an easy thing to search the available bots and indicators...
As for coding it up - it's a relatively simple solution, need to loop through your positions, the symbol, pips, volume, gross & net profits are all available through the API. Not sure about commissions/swaps but I imagine that's included by definition in the netprofit field.
The positioning is also definable in the API with some static text... font size I'd have to look into but imagine that's possible to change as well...
Take a stab at coding it yourself! Lots of help here if you run into problems :) the Guides can get you started and are well done.
CaD
@calgodemo
calgodemo
15 Nov 2019, 21:57
Panagiotis,
2) sorry cannot do that, it usually happens in debugging but I cannot reproduce it at will, no idea how to make it trigger - but I assumed since spotware created the code that throws the exception in the first place they could tell me more about what it is thrown for... if the question could be asked of the developers that'd be great.
1) Global meaning it's scope is not limited to a method, function, or other bracketed code. Inside the bot class it's accessible anywhere.
CaD
@calgodemo
calgodemo
24 Sep 2019, 19:22
RE:
Panagiotis Charalampous said:
Hi calgodemo,
Can you share the indicator code? All indicators are calculated for all data available on the chart so "back calculate" mechanism you are looking for is there by design.
Best Regards,
Panagiotis
Thanks Panagiotis, that's what I thought! And that's my experience with indicators - even my own.
I tell you what I did - on initialization I set my LastIndex integer to Marketseries.close -2... then in the following code
if (index > Lastindex)
{
OnBarClosed(Lastindex, index_special);
Lastindex = index;
}
it only calculated from the last candle ... when I changed LastIndex to 0 on initialization, it behaved like it should and I got the calculations for all available data on the chart like you said.
Not sure what I was thinking when i wrote that but it's corrected now!
Thanks again!
CaD
@calgodemo
calgodemo
11 Sep 2019, 20:20
That did it - Thanks!
I think what threw me off was in doing my research I saw other indicators/bots where the access level was still set to none. I don't know but your suggestion has fixed it for me.
Much appreciated!
CaD
@calgodemo
calgodemo
06 Sep 2019, 01:03
Panagiotis,
I don't have permissions to post the indicator code on this one, I apologize. Let me ask some more general questions and perhaps get to the bottom of it.
Can you or someone on the team explain to me
- Can I have an instance of an indicator running on the same chart that a bot is invoking the indicator on?
- How does calgo handle the multithreading? When the bot invokes the calculate method and runs the same indicator code as the display instance should the values not be identical?
- Any known issues to cause this not to happen?
- Any known backtesting bugs that would not happen on forward testing?
I am running the standard calculate method on every tick for the robot, and in the indicator code I have the standard (index > lastindex) for onbar behavior.
If I do not invoke the code in the bot, the indicator tells me the right stuff, when I invoke with the bot I get something else. When the backtesting stops, the bot invoked indicator is erased from the chart and though it is the same code what remains from the separate instance is different.
Appreciate your time, I will continue to examine on my end.
CaD
@calgodemo
calgodemo
05 Sep 2019, 07:56
Okay,
So, I am backtesting my bot and I have the indicator running so I can see what the bot is executing. If I close the indicator then I seem to not get the things confused, I'm curious why the indicator and bot while invoking the same code on the same marketdata somehow arrive at different values.
Is there a way for a bot to use a custom indicator and have the custom indicator viewable at the same time???
CaD
@calgodemo
calgodemo
14 Jun 2019, 18:31
I've also read on other threads here that one must invoke the calculate method in the cbot... I've done this as well both onbar and ontick with the same result.
using System;
using System.Linq;
using cAlgo.API;
using cAlgo.API.Indicators;
using cAlgo.API.Internals;
using cAlgo.Indicators;

namespace cAlgo.Robots
{
    [Robot(TimeZone = TimeZones.UTC, AccessRights = AccessRights.None)]
    public class MDE : Robot
    {

        [Parameter("Source")]
        public DataSeries Source { get; set; }
        [Parameter(DefaultValue = 60, MinValue = 5)]
        public int Timeframe { get; set; }

        // Declare indicator.
        public MDEv2I MDE;
        // here are some variables I am creating along the way.

        protected override void OnStart()
        {
            // instantiate custom indicator
            MDE = Indicators.GetIndicator<MDEv2I>(Source);
        }

        protected override void OnBar()
        {
       MDE.Calculate(MarketSeries.Open.Count - 1);
            // count indicies and display to chart to test indicator values are being read correctly

       Chart.DrawStaticText("D_Orange", "Last orange dot index is " + MDE.D_Orange.ToString(), VerticalAlignment.Center, HorizontalAlignment.Right, "orange");
        }
        protected override void OnStop()
        {
            // Put your deinitialization logic here
        }
    }
}
@calgodemo
calgodemo
14 Jun 2019, 18:25
public override void Calculate(int index)
        {
            Blueline[index] = Macd.MACD[index];
            Redline[index] = Macd.Signal[index];
            Histogram[index] = Macd.Histogram[index];

            if (CalcHistZero() != 0)
            {
                D_Orange_Last = D_Orange;
                D_Orange = index;
                IndicatorArea.DrawIcon("orangedot" + index.ToString(), ChartIconType.Diamond, D_Orange, Blueline[D_Orange], "orange");
            }
            if (CalcMacdZeroCross() != 0)
            {
                Vg_last = Vg;
                Vg = index;
            }
        }
When I was editing the post I guess I got overzealous and removed the line.... see above for line included in the Calculate method - it will throw a nullreferenceexception and die right there at
IndicatorArea.DrawIcon("orangedot" + index.ToString(), ChartIconType.Diamond, D_Orange, Blueline[D_Orange], "orange");
For completeness sake the whole indicator modified take 2 is included below:
using System;
using cAlgo.API;
using cAlgo.API.Internals;
using cAlgo.API.Indicators;
using cAlgo.Indicators;

namespace cAlgo
{
    [Indicator(IsOverlay = false, TimeZone = TimeZones.UTC, AccessRights = AccessRights.None)]
    public class MDEv2I : Indicator
    {
        [Parameter("Source")]
        public DataSeries Source { get; set; }

        [Output("MACD", LineColor = "blue", Thickness = 3)]
        public IndicatorDataSeries Blueline { get; set; }
        [Output("Signal", LineColor = "red", Thickness = 3)]
        public IndicatorDataSeries Redline { get; set; }
        [Output("Histogram", IsHistogram = true, LineColor = "lightblue", Thickness = 4)]
        public IndicatorDataSeries Histogram { get; set; }

        #region declaring variables
        public MacdCrossOver Macd;
        public int Dr_last;
        public int Dr;
        public int Vg_last;
        public int Vg;
        public int D_Orange;
        public int D_Orange_Last;
        #endregion

        protected override void Initialize()
        {
            Macd = Indicators.MacdCrossOver(Source, 26, 12, 9);
            Dr = 0;
            Vg = 0;
            Dr_last = 0;
            Vg_last = 0;
            D_Orange = 0;
            D_Orange_Last = 0;
        }

        public override void Calculate(int index)
        {
            Blueline[index] = Macd.MACD[index];
            Redline[index] = Macd.Signal[index];
            Histogram[index] = Macd.Histogram[index];

            if (CalcHistZero() != 0)
            {
                D_Orange_Last = D_Orange;
                D_Orange = index;
                IndicatorArea.DrawIcon("orangedot" + index.ToString(), ChartIconType.Diamond, D_Orange, Blueline[D_Orange], "orange");
            }
            if (CalcMacdZeroCross() != 0)
            {
                Vg_last = Vg;
                Vg = index;
            }
        }

        public int CalcHistZero()
        {
            int tempindex = 5;
            int period = 0;
            if (Vg != 0 && D_Orange != 0)
            {
                tempindex = Math.Max(Vg, D_Orange);
            }
            period = Histogram.Count - tempindex;
            for (int calc = (Histogram.Count - 1); calc > (Histogram.Count - period); calc--)
            {
                if (Blueline[calc] > 0)
                {
                    if (Histogram[calc - 1] > 0 && Histogram[calc] < 0)
                        return calc;
                }
                if (Blueline[calc] < 0)
                {
                    if (Histogram[calc - 1] < 0 && Histogram[calc] > 0 || Histogram[calc - 1] > 0 && Histogram[calc] < 0)
                        return calc;
                }
            }
            return 0;
        }
        public int CalcMacdZeroCross()
        {
            int tempindex = 5;
            int period = 0;
            if (Vg != 0 && D_Orange != 0)
            {
                tempindex = Math.Max(Vg, D_Orange);
            }
            period = Histogram.Count - tempindex;
            for (int calc = Blueline.Count; calc > (Blueline.Count - period); calc--)
            {
                // crossing below zero line
                if (Blueline[calc] > 0)
                {
                    if (Blueline[calc - 1] > 0 && (Blueline[calc] > 0 && Blueline[calc + 1] < 0))
                    {
                        return calc;
                    }
                }
                // crossing above zero line
                if (Blueline[calc] < 0)
                {
                    if (Blueline[calc - 1] < 0 && (Blueline[calc] < 0 && Blueline[calc + 1] > 0))
                    {
                        return calc;
                    }
                }
            }
            return 0;
        }
      }
}
@calgodemo
calgodemo
14 Jun 2019, 08:09
RE: RE:
AndreaDev said:
admin said:
Robots do not support displaying the results of indicators for the time being. It may be implemented in the future.
Has this been implemented?
If yes, can you point me out some links, thanks in advance.
If no...well I will eventually open a vote to request it, even if it should be something basic to have in a bot.
I would upvote this.
@calgodemo
calgodemo
14 Jun 2019, 08:00
RE:
Panagiotis Charalampous said:
Hi calgodemo,
Can you share the cBot and Indicator code?
Best Regards,
Panagiotis
General question: How do I reference the Indicator's IndicatorArea?
When I run the indicator in backtesting or live without debugging I can see all the stuff drawn in the indicatorarea without issue. As soon as I go to debug it throws a nullreferenceexception on the indicatorarea when I want to do anything with it... the nullreference is thrown in the indicator code! I am debugging an instance of the cbot.
This is extremely frustrating - the Indicator isoverlay property is set to false as you can see from the code above - I have no idea how to get over this exception, where in the API does it say I have to instaniate an indicator area... in the indicator? Is that even possible, intellisense doesn't suggest so.
please help!
Thanks!
cAD
@calgodemo
calgodemo
09 Apr 2020, 18:04 ( Updated at: 21 Dec 2023, 09:22 )
RE:
PanagiotisCharalampous said:
Thank you both for your replies,
Panagiotis, will this affect any execution when my bots/indicators are set to EasternStandardTime? (in the topline with isOverlay etc...)
resetting the chart to UTC-6 will fix the time on the chart as you suggest, I understand why that is happening now, but since I use Bars.Opentime in my reporting, and my indicator/bots use timezone.EasternStandardTime, will my reporting be off by an hour (to my computer time)?? Can you help me understand the relationship between that setting in indicators and the chart display (since I can set it to anything really)
Thanks,
CaD
@calgodemo