Topics
Replies
firemyst
17 Jan 2022, 15:47
You have yet to mention the specs of the machine or VPS that you're running your cTrader on.
We also have no idea what your bot is doing. What people say vs what code actually does is two different things. For all we know, you could have a massive loop in there somewhere.
Also there is nothing wrong with having 2 isntances of the same bot running on the same symbol, correct?
Correct.
@firemyst
firemyst
14 Jan 2022, 17:04
( Updated at: 21 Dec 2023, 09:22 )
HAve you monitored the computer's performance at all? Eg, how much, if at all, does memory usage go up? CPU usage?
In Windows Task Manager you can "tick" the cTrader process and see exactly how much memory and CPU it's using:
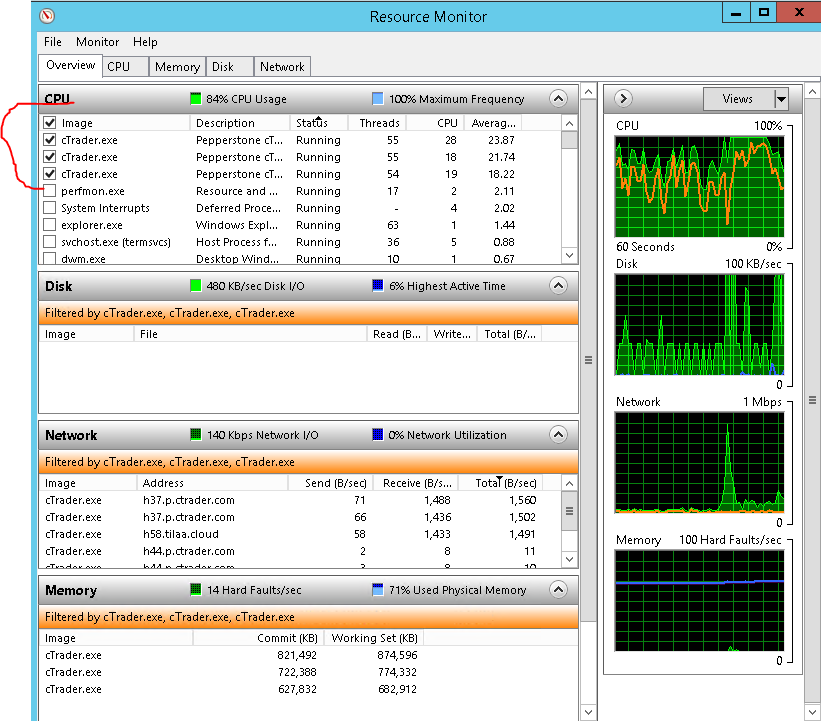
Does your bot or any indicators use a lot of "Print" statements that outputs to the logs? Those suck up lots of memory, which cannot be cleared except to close down cTrader and restart it.
@firemyst
firemyst
09 Jan 2022, 15:46
I'm not sure how you expect anyone to answer or reply to this when you haven't provided any information?
For instance, why do you think the stats are wrong? You say they "should", but you provide no explanation why.
If you're running a back test, you haven't provided any parameters, nor the code that you're running against, so someone can actually see what's going on and tell you why the numbers are as they are.
@firemyst
firemyst
09 Jan 2022, 15:43
A few questions:
1) have you looked in the "Log" tab when your bot is running to see what happens? If there's a crash or something?
2) Have you tried putting any "Print" statements in your code to output information to the log? for instance, how do you know all the following statements ever evaluate to "true" for the order to be opened?
if (UpHigh && UpTrend)
                    {
                        if (UpBreak || DownSpring)
                        {

                            if (UpKabuti)
                            {
                                Open_Buy_Order();
                                return;
                            }
                        }
                    }
For all you know, all those "if" statements may not be evaluating to true, and thus the "Open_Buy_Order" method is never executed.
So I would try putting in Print statements to log output, so you can see where the code is executing, and if it's even getting to the method to open an order.
@firemyst
firemyst
09 Jan 2022, 15:38
RE: RE:
triccomane said:
I made some progress. I succeeded in getting the two symbols on two different arrays, but I still cannot find a way to subtract each element of the first array to the second one
            for (int i = 0; i < Periods; i++)
            {
                double close_nasdaq = (MarketData.GetSeries(MarketData.GetSymbol("US TECH 100"), TimeFrame.Daily).Close.Last(i));
                Print("nasdaq close price: ", i, " ", close_nasdaq);
                double close_dowjones = (MarketData.GetSeries(MarketData.GetSymbol("US 30"), TimeFrame.Daily).Close.Last(i));
                Print("dowjones close price: ", i, " ", close_dowjones);

                double downas;
                downas[i] = close_dowjones[i] - close_nasdaq[i]; //I get an erorr on this line
You're receiving an error on that line because you're treating a variable declared as a "double" as an array.
This is what you need to change that line to:
downas = close_dowjones - close_nasdaq;
which will save the single value.
If you want to keep an array of all the values, then your code needs some work. Here's a rough draft as I'm not in front of an editor:
double[] close_nasdaq = new double[Periods];
double[] close_dowjones = new double[Periods];
double[] downas = new double[Periods];

 for (int i = 0; i < Periods; i++)
            {
close_nasdaq[i] = (MarketData.GetSeries(MarketData.GetSymbol("US TECH 100"), TimeFrame.Daily).Close.Last(i));
                Print("nasdaq close price: ", i, " ", close_nasdaq[i]);
                close_dowjones[i] = (MarketData.GetSeries(MarketData.GetSymbol("US 30"), TimeFrame.Daily).Close.Last(i));
                Print("dowjones close price: ", i, " ", close_dowjones[i]);

                downas[i] = close_dowjones[i] - close_nasdaq[i];
@firemyst

firemyst
29 Dec 2021, 14:49
RE:
PanagiotisCharalampous said:
Hi mh17462,
This is not possible at the moment but a cross broker cTrader is in our future plans.
Best Regards,
Panagiotis
As another follow up @Panagiotis, is it possible to use the same broker's cTrader on one computer with two different accounts (users) at the same time?
Ex: I log into one running version of cTrader from IC Markets on a computer; can my friend, on the exact same computer, launch another instance of cTrader and log into _their_ IC Markets account as well? So we have two instances of cTrader from the same broker, running with two different user logins?
@firemyst
firemyst
28 Dec 2021, 15:20
RE:
PanagiotisCharalampous said:
Hi firemyst,
Happy holidays! From the next update, there won't be any dependencies to the cTrader platform, therefore you will be able to use any IDE for .Net projects you wish.
Best Regards,
Panagiotis
That's awesome and fantastic news.
Thanks for the update @Panagiotis and thanks to your team for going down that route :-)
@firemyst
firemyst
28 Dec 2021, 12:13
RE:
PanagiotisCharalampous said:
Hi Sirinath,
cTrader currently uses .Net Framework 4.0/C# 4.0. It will be upgraded to .Net 6.0/C# 10 in the next update.
Best Regards,
Panagiotis
Happy Holidays @Panagiotis!
As a follow up, in the next update what's the latest version of Visual Studio that will be supported?
@firemyst
firemyst
26 Dec 2021, 14:19
Of course it crashed where it says it did :-)
Look at your code there:
private void NewTicks(TicksTickEventArgs obj)
        {
            Ticks ticks = obj.Ticks;
            string symbol = ticks.SymbolName;
            Print("New ticks: Event - {0}, Ticks - {1}, Symbol - {2}, Trader Type - {3}", obj, ticks, symbol);
        }
Look at your print statement. How many variables are you trying to print? And how many do you have listed as parameters?
:-)
@firemyst
firemyst
23 Dec 2021, 15:14
RE: RE: RE: RE:
amusleh said:
firemyst said:
amusleh said:
The clouds uses output color which user can change, the color is not hardcoded, the output names are.
How does a user change the output color?
I have several indicators with "clouds" on them and cannot see anywhere in the indicator properties to change the colors of the clouds between the lines -- only the "lines" that make up the indicator.
Nothing in the online API reference seems to indicate how either:
https://ctrader.com/api/reference/cloudattribute
Thank you
Hi,
If one output line goes above the other then the color change to that output line color. you don't have to provide the color for cloud attribute, that's optional.
Thank you! That helps! I think most programmers see that listed, so they put that in. At least, with all the cloud indicators i've downloaded I can't change any of those colors; the example in the API guide I found does.
@firemyst
firemyst
23 Dec 2021, 09:29
RE: RE:
amusleh said:
The clouds uses output color which user can change, the color is not hardcoded, the output names are.
How does a user change the output color?
I have several indicators with "clouds" on them and cannot see anywhere in the indicator properties to change the colors of the clouds between the lines -- only the "lines" that make up the indicator.
Nothing in the online API reference seems to indicate how either:
https://ctrader.com/api/reference/cloudattribute
Thank you
@firemyst
firemyst
22 Dec 2021, 10:10
Where do you call the indicator to get it's latest data?
OnBar? OnTick?
A submethod?
In there, you would put the call to get the latest data in a try-catch block. If there's an exception, you can either:
1) log it to the output and keep the cbot runnign
2) set a "flag" of some sort, stop the bot if the flag is set, or again just have it log to output.
It depends on what you need/want to happen.
@firemyst
firemyst
22 Dec 2021, 10:01
Well, I'lm not sure how/why you expect the indicator to work that you provided the link to. When I looked at the page, it has numerous parameters that it's expected other than "source":
[Parameter("Source", Group = "Base Settings", DefaultValue = "Close")]
public DataSeries Source { get; set; }
[Parameter("Oversold Level", DefaultValue = 20, MinValue = 1, Step = 1)]
public int Oversold { get; set; }
[Parameter("Overbought Level", DefaultValue = 80, MinValue = 1, Step = 1)]
public int Overbought { get; set; }
[Parameter("RSI Periods", DefaultValue = 14, MinValue = 2)]
public int RSIPeriod { get; set; }
[Parameter("Stochastic K%", DefaultValue = 3, Step = 1, MinValue = 2)]
public int StochK { get; set; }
[Parameter("Stochastic D%", DefaultValue = 3, Step = 1, MinValue = 2)]
public int StochD { get; set; }
[Parameter("Stochastic Periods", DefaultValue = 14, Step = 1, MinValue = 2)]
public int StochPeriods { get; set; }
If you expect to use that one in your cBot, you have to have it something like the following:
Indicators.GetIndicator<StochasticRSI>(Source, Oversold, Overbought, RSIPeriod, STochK, StochD, StochPeriods);
with values obviously for all the parameters you supply.
@firemyst
firemyst
10 Dec 2021, 02:28
RE:
PanagiotisCharalampous said:
Hi firemyst,
My suggestion is the followng
- In OnBar enable a timer with an interval e.g. 1 second
- On each timer interval execute your checks and logic. Between the intervals, the main thread is freed to update the information
- After your job is finished, stop the timer
Best Regards,
Panagiotis
Thanks @Panagiotis!
I tried the above, and it worked as I wanted. I set the interval for 10 seconds instead of 1 second because the spreads seem to be crazy for almost the full hour.
For everyone's info, here's a sample output showing just how crazily pip spreads occur during the "OnBar" event on the immediate bar(s) after the NY Session close. This is with the GBPNZD pair (with the latest time at the top). That spread is usually 3-4 pips during normal trading hours. The code used to calculate the spread at the time is the exact same code as my sample in my post above.
Time is UTC + 8:
10/12/2021 07:01:13.907 | OBTE02: Spread now 12.7999999999995 (pips) @ 12/10/2021 7:06:51 AM and OBTRA = 0. Skipping this round.
10/12/2021 07:01:03.892 | OBTE01: Waiting for the market and spread 15.5000000000016 (pips) to settle @ 12/10/2021 7:06:41 AM. Retries left: 0
10/12/2021 07:00:53.892 | OBTE01: Waiting for the market and spread 17.3000000000001 (pips) to settle @ 12/10/2021 7:06:31 AM. Retries left: 1
10/12/2021 07:00:43.892 | OBTE01: Waiting for the market and spread 18.2000000000015 (pips) to settle @ 12/10/2021 7:06:21 AM. Retries left: 2
10/12/2021 07:00:33.892 | OBTE01: Waiting for the market and spread 17.5999999999998 (pips) to settle @ 12/10/2021 7:06:11 AM. Retries left: 3
10/12/2021 07:00:23.876 | OBTE01: Waiting for the market and spread 15.1999999999997 (pips) to settle @ 12/10/2021 7:06:01 AM. Retries left: 4
10/12/2021 07:00:13.860 | OBTE01: Waiting for the market and spread 16.8999999999997 (pips) to settle @ 12/10/2021 7:05:51 AM. Retries left: 5
10/12/2021 07:00:03.845 | OBTE01: Waiting for the market and spread 23.9999999999996 (pips) to settle @ 12/10/2021 7:05:41 AM. Retries left: 6
10/12/2021 06:59:53.845 | OBTE01: Waiting for the market and spread 18.3 (pips) to settle @ 12/10/2021 7:05:31 AM. Retries left: 7
10/12/2021 06:59:43.845 | OBTE01: Waiting for the market and spread 18.3 (pips) to settle @ 12/10/2021 7:05:21 AM. Retries left: 8
10/12/2021 06:59:33.829 | OBTE01: Waiting for the market and spread 18.2000000000015 (pips) to settle @ 12/10/2021 7:05:11 AM. Retries left: 9
10/12/2021 06:59:23.813 | OBTE01: Waiting for the market and spread 18.9000000000017 (pips) to settle @ 12/10/2021 7:05:01 AM. Retries left: 10
10/12/2021 06:59:13.813 | OBTE01: Waiting for the market and spread 18.4999999999991 (pips) to settle @ 12/10/2021 7:04:51 AM. Retries left: 11
10/12/2021 06:59:03.798 | OBTE01: Waiting for the market and spread 18.4999999999991 (pips) to settle @ 12/10/2021 7:04:41 AM. Retries left: 12
10/12/2021 06:58:53.798 | OBTE01: Waiting for the market and spread 19.0000000000001 (pips) to settle @ 12/10/2021 7:04:31 AM. Retries left: 13
10/12/2021 06:58:43.798 | OBTE01: Waiting for the market and spread 19.0000000000001 (pips) to settle @ 12/10/2021 7:04:21 AM. Retries left: 14
10/12/2021 06:58:33.767 | OBTE01: Waiting for the market and spread 19.0000000000001 (pips) to settle @ 12/10/2021 7:04:11 AM. Retries left: 15
10/12/2021 06:58:23.767 | OBTE01: Waiting for the market and spread 18.4999999999991 (pips) to settle @ 12/10/2021 7:04:01 AM. Retries left: 16
10/12/2021 06:58:13.751 | OBTE01: Waiting for the market and spread 18.7000000000004 (pips) to settle @ 12/10/2021 7:03:51 AM. Retries left: 17
10/12/2021 06:58:03.751 | OBTE01: Waiting for the market and spread 19.6999999999981 (pips) to settle @ 12/10/2021 7:03:41 AM. Retries left: 18
10/12/2021 06:57:53.735 | OBTE01: Waiting for the market and spread 19.0999999999986 (pips) to settle @ 12/10/2021 7:03:31 AM. Retries left: 19
10/12/2021 06:57:43.673 | OBTE01: Waiting for the market and spread 18.8999999999995 (pips) to settle @ 12/10/2021 7:03:21 AM. Retries left: 20
10/12/2021 06:57:33.673 | OBTE01: Waiting for the market and spread 19.1000000000008 (pips) to settle @ 12/10/2021 7:03:11 AM. Retries left: 21
10/12/2021 06:57:23.657 | OBTE01: Waiting for the market and spread 19.1000000000008 (pips) to settle @ 12/10/2021 7:03:01 AM. Retries left: 22
10/12/2021 06:57:13.657 | OBTE01: Waiting for the market and spread 18.8999999999995 (pips) to settle @ 12/10/2021 7:02:51 AM. Retries left: 23
10/12/2021 06:57:03.657 | OBTE01: Waiting for the market and spread 19.2999999999999 (pips) to settle @ 12/10/2021 7:02:41 AM. Retries left: 24
10/12/2021 06:56:53.642 | OBTE01: Waiting for the market and spread 22.1000000000005 (pips) to settle @ 12/10/2021 7:02:31 AM. Retries left: 25
10/12/2021 06:56:43.642 | OBTE01: Waiting for the market and spread 21.9999999999998 (pips) to settle @ 12/10/2021 7:02:21 AM. Retries left: 26
10/12/2021 06:56:33.626 | OBTE01: Waiting for the market and spread 21.1000000000006 (pips) to settle @ 12/10/2021 7:02:11 AM. Retries left: 27
10/12/2021 06:56:23.626 | OBTE01: Waiting for the market and spread 21.4000000000003 (pips) to settle @ 12/10/2021 7:02:01 AM. Retries left: 28
10/12/2021 06:56:13.610 | OBTE01: Waiting for the market and spread 21.199999999999 (pips) to settle @ 12/10/2021 7:01:51 AM. Retries left: 29
10/12/2021 06:56:03.610 | OBTE01: Waiting for the market and spread 21.7000000000001 (pips) to settle @ 12/10/2021 7:01:41 AM. Retries left: 30
10/12/2021 06:55:53.595 | OBTE01: Waiting for the market and spread 21.9000000000014 (pips) to settle @ 12/10/2021 7:01:31 AM. Retries left: 31
10/12/2021 06:55:43.579 | OBTE01: Waiting for the market and spread 20.0999999999985 (pips) to settle @ 12/10/2021 7:01:21 AM. Retries left: 32
10/12/2021 06:55:33.547 | OBTE01: Waiting for the market and spread 20 (pips) to settle @ 12/10/2021 7:01:11 AM. Retries left: 33
10/12/2021 06:55:23.547 | OBTE01: Waiting for the market and spread 20.0999999999985 (pips) to settle @ 12/10/2021 7:01:01 AM. Retries left: 34
10/12/2021 06:55:13.547 | OBTE01: Waiting for the market and spread 20.9000000000015 (pips) to settle @ 12/10/2021 7:00:51 AM. Retries left: 35
10/12/2021 06:55:03.532 | OBTE01: Waiting for the market and spread 20.9999999999999 (pips) to settle @ 12/10/2021 7:00:41 AM. Retries left: 36
10/12/2021 06:54:53.532 | OBTE01: Waiting for the market and spread 20.9999999999999 (pips) to settle @ 12/10/2021 7:00:31 AM. Retries left: 37
10/12/2021 06:54:43.516 | OBTE01: Waiting for the market and spread 20.9999999999999 (pips) to settle @ 12/10/2021 7:00:21 AM. Retries left: 38
10/12/2021 06:54:33.501 | OBTE01: Waiting for the market and spread 21.0999999999983 (pips) to settle @ 12/10/2021 7:00:11 AM. Retries left: 39
10/12/2021 06:54:23.485 | OBTE01: Waiting for the market and spread 21.1000000000006 (pips) to settle @ 12/10/2021 7:00:01 AM. Retries left: 40
10/12/2021 06:54:13.485 | OBTE01: Waiting for the market and spread 25.5000000000005 (pips) to settle @ 12/10/2021 6:59:51 AM. Retries left: 41
10/12/2021 06:54:03.485 | OBTE01: Waiting for the market and spread 20.4000000000004 (pips) to settle @ 12/10/2021 6:59:41 AM. Retries left: 42
10/12/2021 06:53:53.469 | OBTE01: Waiting for the market and spread 20.1000000000007 (pips) to settle @ 12/10/2021 6:59:31 AM. Retries left: 43
10/12/2021 06:53:43.454 | OBTE01: Waiting for the market and spread 20.7000000000002 (pips) to settle @ 12/10/2021 6:59:21 AM. Retries left: 44
10/12/2021 06:53:33.454 | OBTE01: Waiting for the market and spread 20.7000000000002 (pips) to settle @ 12/10/2021 6:59:11 AM. Retries left: 45
10/12/2021 06:53:23.454 | OBTE01: Waiting for the market and spread 20.9999999999999 (pips) to settle @ 12/10/2021 6:59:01 AM. Retries left: 46
10/12/2021 06:53:13.454 | OBTE01: Waiting for the market and spread 20.7000000000002 (pips) to settle @ 12/10/2021 6:58:51 AM. Retries left: 47
10/12/2021 06:53:03.438 | OBTE01: Waiting for the market and spread 20.7000000000002 (pips) to settle @ 12/10/2021 6:58:41 AM. Retries left: 48
10/12/2021 06:52:53.423 | OBTE01: Waiting for the market and spread 21.199999999999 (pips) to settle @ 12/10/2021 6:58:31 AM. Retries left: 49
10/12/2021 06:52:43.423 | OBTE01: Waiting for the market and spread 21.2999999999997 (pips) to settle @ 12/10/2021 6:58:21 AM. Retries left: 50
10/12/2021 06:52:33.423 | OBTE01: Waiting for the market and spread 21.4000000000003 (pips) to settle @ 12/10/2021 6:58:11 AM. Retries left: 51
10/12/2021 06:52:23.407 | OBTE01: Waiting for the market and spread 21.4000000000003 (pips) to settle @ 12/10/2021 6:58:01 AM. Retries left: 52
10/12/2021 06:52:13.407 | OBTE01: Waiting for the market and spread 21.3000000000019 (pips) to settle @ 12/10/2021 6:57:51 AM. Retries left: 53
10/12/2021 06:52:03.392 | OBTE01: Waiting for the market and spread 20.9000000000015 (pips) to settle @ 12/10/2021 6:57:41 AM. Retries left: 54
10/12/2021 06:51:53.392 | OBTE01: Waiting for the market and spread 20.9000000000015 (pips) to settle @ 12/10/2021 6:57:31 AM. Retries left: 55
10/12/2021 06:51:43.376 | OBTE01: Waiting for the market and spread 20.7000000000002 (pips) to settle @ 12/10/2021 6:57:21 AM. Retries left: 56
10/12/2021 06:51:33.360 | OBTE01: Waiting for the market and spread 21.4000000000003 (pips) to settle @ 12/10/2021 6:57:11 AM. Retries left: 57
10/12/2021 06:51:23.363 | OBTE01: Waiting for the market and spread 21.4000000000003 (pips) to settle @ 12/10/2021 6:57:01 AM. Retries left: 58
10/12/2021 06:51:13.363 | OBTE01: Waiting for the market and spread 21.199999999999 (pips) to settle @ 12/10/2021 6:56:51 AM. Retries left: 59
10/12/2021 06:51:03.363 | OBTE01: Waiting for the market and spread 20.9999999999999 (pips) to settle @ 12/10/2021 6:56:41 AM. Retries left: 60
10/12/2021 06:50:53.348 | OBTE01: Waiting for the market and spread 20.9999999999999 (pips) to settle @ 12/10/2021 6:56:31 AM. Retries left: 61
10/12/2021 06:50:43.348 | OBTE01: Waiting for the market and spread 20.9999999999999 (pips) to settle @ 12/10/2021 6:56:21 AM. Retries left: 62
10/12/2021 06:50:33.332 | OBTE01: Waiting for the market and spread 21.2000000000012 (pips) to settle @ 12/10/2021 6:56:11 AM. Retries left: 63
10/12/2021 06:50:23.343 | OBTE01: Waiting for the market and spread 21.7000000000001 (pips) to settle @ 12/10/2021 6:56:01 AM. Retries left: 64
10/12/2021 06:50:13.343 | OBTE01: Waiting for the market and spread 22.4000000000002 (pips) to settle @ 12/10/2021 6:55:51 AM. Retries left: 65
10/12/2021 06:50:03.327 | OBTE01: Waiting for the market and spread 22.4000000000002 (pips) to settle @ 12/10/2021 6:55:41 AM. Retries left: 66
10/12/2021 06:49:53.327 | OBTE01: Waiting for the market and spread 21.8999999999991 (pips) to settle @ 12/10/2021 6:55:31 AM. Retries left: 67
10/12/2021 06:49:43.312 | OBTE01: Waiting for the market and spread 22.4000000000002 (pips) to settle @ 12/10/2021 6:55:21 AM. Retries left: 68
10/12/2021 06:49:33.296 | OBTE01: Waiting for the market and spread 22.4999999999986 (pips) to settle @ 12/10/2021 6:55:11 AM. Retries left: 69
10/12/2021 06:49:23.296 | OBTE01: Waiting for the market and spread 22.1999999999989 (pips) to settle @ 12/10/2021 6:55:01 AM. Retries left: 70
10/12/2021 06:49:13.296 | OBTE01: Waiting for the market and spread 22.2000000000011 (pips) to settle @ 12/10/2021 6:54:51 AM. Retries left: 71
10/12/2021 06:49:03.281 | OBTE01: Waiting for the market and spread 22.2000000000011 (pips) to settle @ 12/10/2021 6:54:41 AM. Retries left: 72
10/12/2021 06:48:53.265 | OBTE01: Waiting for the market and spread 22.899999999999 (pips) to settle @ 12/10/2021 6:54:31 AM. Retries left: 73
10/12/2021 06:48:43.249 | OBTE01: Waiting for the market and spread 22.899999999999 (pips) to settle @ 12/10/2021 6:54:21 AM. Retries left: 74
10/12/2021 06:48:33.249 | OBTE01: Waiting for the market and spread 22.6999999999999 (pips) to settle @ 12/10/2021 6:54:11 AM. Retries left: 75
10/12/2021 06:48:23.234 | OBTE01: Waiting for the market and spread 22.6999999999999 (pips) to settle @ 12/10/2021 6:54:01 AM. Retries left: 76
10/12/2021 06:48:13.218 | OBTE01: Waiting for the market and spread 22.6999999999999 (pips) to settle @ 12/10/2021 6:53:51 AM. Retries left: 77
10/12/2021 06:48:03.218 | OBTE01: Waiting for the market and spread 22.5999999999993 (pips) to settle @ 12/10/2021 6:53:41 AM. Retries left: 78
10/12/2021 06:47:53.218 | OBTE01: Waiting for the market and spread 22.4999999999986 (pips) to settle @ 12/10/2021 6:53:31 AM. Retries left: 79
10/12/2021 06:47:43.202 | OBTE01: Waiting for the market and spread 22.6999999999999 (pips) to settle @ 12/10/2021 6:53:21 AM. Retries left: 80
10/12/2021 06:47:33.187 | OBTE01: Waiting for the market and spread 23.6999999999998 (pips) to settle @ 12/10/2021 6:53:11 AM. Retries left: 81
10/12/2021 06:47:23.187 | OBTE01: Waiting for the market and spread 23.8999999999989 (pips) to settle @ 12/10/2021 6:53:01 AM. Retries left: 82
10/12/2021 06:47:13.171 | OBTE01: Waiting for the market and spread 23.6999999999998 (pips) to settle @ 12/10/2021 6:52:51 AM. Retries left: 83
10/12/2021 06:47:03.171 | OBTE01: Waiting for the market and spread 23.5999999999992 (pips) to settle @ 12/10/2021 6:52:41 AM. Retries left: 84
10/12/2021 06:46:53.156 | OBTE01: Waiting for the market and spread 23.5000000000007 (pips) to settle @ 12/10/2021 6:52:31 AM. Retries left: 85
10/12/2021 06:46:43.156 | OBTE01: Waiting for the market and spread 23.5000000000007 (pips) to settle @ 12/10/2021 6:52:21 AM. Retries left: 86
10/12/2021 06:46:33.156 | OBTE01: Waiting for the market and spread 23.2999999999994 (pips) to settle @ 12/10/2021 6:52:11 AM. Retries left: 87
10/12/2021 06:46:23.140 | OBTE01: Waiting for the market and spread 23.2999999999994 (pips) to settle @ 12/10/2021 6:52:01 AM. Retries left: 88
10/12/2021 06:46:13.140 | OBTE01: Waiting for the market and spread 22.7999999999984 (pips) to settle @ 12/10/2021 6:51:51 AM. Retries left: 89
10/12/2021 06:46:03.140 | OBTE01: Waiting for the market and spread 22.899999999999 (pips) to settle @ 12/10/2021 6:51:41 AM. Retries left: 90
10/12/2021 06:45:53.124 | OBTE01: Waiting for the market and spread 22.6999999999999 (pips) to settle @ 12/10/2021 6:51:31 AM. Retries left: 91
10/12/2021 06:45:43.109 | OBTE01: Waiting for the market and spread 23.8000000000005 (pips) to settle @ 12/10/2021 6:51:21 AM. Retries left: 92
10/12/2021 06:45:33.109 | OBTE01: Waiting for the market and spread 23.9999999999996 (pips) to settle @ 12/10/2021 6:51:11 AM. Retries left: 93
10/12/2021 06:45:23.107 | OBTE01: Waiting for the market and spread 24.2999999999993 (pips) to settle @ 12/10/2021 6:51:01 AM. Retries left: 94
10/12/2021 06:45:13.091 | OBTE01: Waiting for the market and spread 24.9999999999995 (pips) to settle @ 12/10/2021 6:50:50 AM. Retries left: 95
10/12/2021 06:45:03.091 | OBTE01: Waiting for the market and spread 24.2999999999993 (pips) to settle @ 12/10/2021 6:50:40 AM. Retries left: 96
10/12/2021 06:44:53.075 | OBTE01: Waiting for the market and spread 24.9999999999995 (pips) to settle @ 12/10/2021 6:50:30 AM. Retries left: 97
10/12/2021 06:44:43.060 | OBTE01: Waiting for the market and spread 24.9999999999995 (pips) to settle @ 12/10/2021 6:50:20 AM. Retries left: 98
10/12/2021 06:44:33.044 | OBTE01: Waiting for the market and spread 21.8999999999991 (pips) to settle @ 12/10/2021 6:50:10 AM. Retries left: 99
10/12/2021 06:44:23.078 | OBTE01: Waiting for the market and spread 21.8999999999991 (pips) to settle @ 12/10/2021 6:50:00 AM. Retries left: 100
10/12/2021 06:44:13.063 | OBTE01: Waiting for the market and spread 22.4000000000002 (pips) to settle @ 12/10/2021 6:49:50 AM. Retries left: 101
10/12/2021 06:44:03.047 | OBTE01: Waiting for the market and spread 23.8999999999989 (pips) to settle @ 12/10/2021 6:49:40 AM. Retries left: 102
10/12/2021 06:43:53.031 | OBTE01: Waiting for the market and spread 25.599999999999 (pips) to settle @ 12/10/2021 6:49:30 AM. Retries left: 103
10/12/2021 06:43:43.031 | OBTE01: Waiting for the market and spread 25.599999999999 (pips) to settle @ 12/10/2021 6:49:20 AM. Retries left: 104
10/12/2021 06:43:33.016 | OBTE01: Waiting for the market and spread 25.6999999999996 (pips) to settle @ 12/10/2021 6:49:10 AM. Retries left: 105
10/12/2021 06:43:23.016 | OBTE01: Waiting for the market and spread 25.3999999999999 (pips) to settle @ 12/10/2021 6:49:00 AM. Retries left: 106
10/12/2021 06:43:13.000 | OBTE01: Waiting for the market and spread 28.0999999999998 (pips) to settle @ 12/10/2021 6:48:50 AM. Retries left: 107
10/12/2021 06:43:02.984 | OBTE01: Waiting for the market and spread 26.1999999999984 (pips) to settle @ 12/10/2021 6:48:40 AM. Retries left: 108
10/12/2021 06:42:52.984 | OBTE01: Waiting for the market and spread 28.0999999999998 (pips) to settle @ 12/10/2021 6:48:30 AM. Retries left: 109
10/12/2021 06:42:42.984 | OBTE01: Waiting for the market and spread 28.0999999999998 (pips) to settle @ 12/10/2021 6:48:20 AM. Retries left: 110
10/12/2021 06:42:32.969 | OBTE01: Waiting for the market and spread 28.0999999999998 (pips) to settle @ 12/10/2021 6:48:10 AM. Retries left: 111
10/12/2021 06:42:22.969 | OBTE01: Waiting for the market and spread 28.0999999999998 (pips) to settle @ 12/10/2021 6:48:00 AM. Retries left: 112
10/12/2021 06:42:12.953 | OBTE01: Waiting for the market and spread 28.0999999999998 (pips) to settle @ 12/10/2021 6:47:50 AM. Retries left: 113
10/12/2021 06:42:02.938 | OBTE01: Waiting for the market and spread 28.0999999999998 (pips) to settle @ 12/10/2021 6:47:40 AM. Retries left: 114
10/12/2021 06:41:52.938 | OBTE01: Waiting for the market and spread 28.0999999999998 (pips) to settle @ 12/10/2021 6:47:30 AM. Retries left: 115
10/12/2021 06:41:42.938 | OBTE01: Waiting for the market and spread 28.0999999999998 (pips) to settle @ 12/10/2021 6:47:20 AM. Retries left: 116
10/12/2021 06:41:32.922 | OBTE01: Waiting for the market and spread 26.9999999999992 (pips) to settle @ 12/10/2021 6:47:10 AM. Retries left: 117
10/12/2021 06:41:22.922 | OBTE01: Waiting for the market and spread 26.9999999999992 (pips) to settle @ 12/10/2021 6:47:00 AM. Retries left: 118
10/12/2021 06:41:12.907 | OBTE01: Waiting for the market and spread 26.8999999999986 (pips) to settle @ 12/10/2021 6:46:50 AM. Retries left: 119
10/12/2021 06:41:02.891 | OBTE01: Waiting for the market and spread 27.2000000000006 (pips) to settle @ 12/10/2021 6:46:40 AM. Retries left: 120
10/12/2021 06:40:52.875 | OBTE01: Waiting for the market and spread 27.2000000000006 (pips) to settle @ 12/10/2021 6:46:30 AM. Retries left: 121
10/12/2021 06:40:42.875 | OBTE01: Waiting for the market and spread 27.5000000000003 (pips) to settle @ 12/10/2021 6:46:20 AM. Retries left: 122
10/12/2021 06:40:32.860 | OBTE01: Waiting for the market and spread 28.0999999999998 (pips) to settle @ 12/10/2021 6:46:10 AM. Retries left: 123
10/12/2021 06:40:22.844 | OBTE01: Waiting for the market and spread 28.0999999999998 (pips) to settle @ 12/10/2021 6:46:00 AM. Retries left: 124
10/12/2021 06:40:12.829 | OBTE01: Waiting for the market and spread 26.5000000000004 (pips) to settle @ 12/10/2021 6:45:50 AM. Retries left: 125
10/12/2021 06:40:02.813 | OBTE01: Waiting for the market and spread 24.6999999999997 (pips) to settle @ 12/10/2021 6:45:40 AM. Retries left: 126
10/12/2021 06:39:52.813 | OBTE01: Waiting for the market and spread 26.6999999999995 (pips) to settle @ 12/10/2021 6:45:30 AM. Retries left: 127
10/12/2021 06:39:42.797 | OBTE01: Waiting for the market and spread 26.5000000000004 (pips) to settle @ 12/10/2021 6:45:20 AM. Retries left: 128
10/12/2021 06:39:32.797 | OBTE01: Waiting for the market and spread 26.5999999999988 (pips) to settle @ 12/10/2021 6:45:10 AM. Retries left: 129
10/12/2021 06:39:22.797 | OBTE01: Waiting for the market and spread 26.6000000000011 (pips) to settle @ 12/10/2021 6:45:00 AM. Retries left: 130
10/12/2021 06:39:12.782 | OBTE01: Waiting for the market and spread 28.0999999999998 (pips) to settle @ 12/10/2021 6:44:50 AM. Retries left: 131
10/12/2021 06:39:02.766 | OBTE01: Waiting for the market and spread 28.0999999999998 (pips) to settle @ 12/10/2021 6:44:40 AM. Retries left: 132
10/12/2021 06:38:52.766 | OBTE01: Waiting for the market and spread 28.0999999999998 (pips) to settle @ 12/10/2021 6:44:30 AM. Retries left: 133
10/12/2021 06:38:42.750 | OBTE01: Waiting for the market and spread 28.0999999999998 (pips) to settle @ 12/10/2021 6:44:20 AM. Retries left: 134
10/12/2021 06:38:32.735 | OBTE01: Waiting for the market and spread 28.0999999999998 (pips) to settle @ 12/10/2021 6:44:10 AM. Retries left: 135
10/12/2021 06:38:22.720 | OBTE01: Waiting for the market and spread 28.0999999999998 (pips) to settle @ 12/10/2021 6:44:00 AM. Retries left: 136
10/12/2021 06:38:12.704 | OBTE01: Waiting for the market and spread 21.2999999999997 (pips) to settle @ 12/10/2021 6:43:50 AM. Retries left: 137
10/12/2021 06:38:02.704 | OBTE01: Waiting for the market and spread 21.2999999999997 (pips) to settle @ 12/10/2021 6:43:40 AM. Retries left: 138
10/12/2021 06:37:52.689 | OBTE01: Waiting for the market and spread 21.2999999999997 (pips) to settle @ 12/10/2021 6:43:30 AM. Retries left: 139
10/12/2021 06:37:42.673 | OBTE01: Waiting for the market and spread 21.500000000001 (pips) to settle @ 12/10/2021 6:43:20 AM. Retries left: 140
10/12/2021 06:37:32.673 | OBTE01: Waiting for the market and spread 20.8000000000008 (pips) to settle @ 12/10/2021 6:43:10 AM. Retries left: 141
10/12/2021 06:37:22.688 | OBTE01: Waiting for the market and spread 21.0000000000021 (pips) to settle @ 12/10/2021 6:43:00 AM. Retries left: 142
@firemyst
firemyst
09 Dec 2021, 09:45
RE:
PanagiotisCharalampous said:
Hi firemyst,
cBots run on the same thread as the UI, so when you put the thread to sleep, then the whole thread will sleep. Symbol informaton cannot be updated while the OnBar method is executed. To help you further, you wull need to explain to us what are you trying to achieve.
Best Regards,
Panagiotis
HI @Panagiotis:
I'm coding a day trading strategy that only opens positions or manages positions during the "OnBar". This means, after the NY session close. However, as you're aware, the pip spread during that time as the servers around the world reset for the next "trading day" can be HUGE. That is, what might normally be like a 3 pip spread can turn into a possible 17 pip spread temporarily.
So what I want to do is execute the logic when a new bar is formed, but if the spread is greater than say 3 pips (since most pairs are under 3 during normal hours), I want to wait until the spreads return back to some normality. Hence the "while loop" i have in my sample code above. I cannot check if the spread is > 3 and if so, skip until next bar, because it will happen again each day as each new "OnBar" event occurs and the spreads again become greater than normal.
Does that make sense?
Thank you.
@firemyst
firemyst
22 Nov 2021, 09:22
RE:
amusleh said:
Hi,
If you know what time zone your indicator/cBot is running on and on which time the New York session ends then you can check if the OnBar/OnTick event is triggered during that time.
To change the time zone of DateTime you can use .NET TimeZoneInfo: Converting times between time zones | Microsoft Docs
Thank you for your reply.
Because after the New York session close, the next OnTick/OnBar events for each forex pair happens at different times. So I can't just say, "check at x o'clock.
For example, if I was in New York, in an OnBar event within a bot, I'd have to check if it is occurring between 5:00pm - 5:05pm. And if I'm on a time frame that's less than 5 minutes, I'd have to have a flag to indicate that I've already checked for the first bar after the close of the session.
Is that how you would do it? Or do you have any other ideas?
Thanks again.
@firemyst
firemyst
28 Jan 2022, 03:56
RE:
PanagiotisCharalampous said:
@PanagiotisCharalampous:
Are there any plans for this?
We have a Panel control we place on the chart. This panel control can have multiple indicators that add their own button/checkbox/whatever to the panel. When the indicator is deleted from the chart, the whole Panel Control is removed as there appears to be no way to execute code when an indicator is deleted nor does there appear to be any sort of "indicatorremoved" event for the chart so we can tell our panel control to remove the child control that was added by the now-deleted indicator.
@firemyst