Topics
Replies
ctid362150
02 Sep 2019, 04:46
That's a good idea.
Also, TSL should be set as pips TRAILING the current price. NOT as PIPS FROM the initial buy price.
@ctid362150
ctid362150
03 Oct 2018, 17:36
Of course, with running trades, I have NO idea what's going on. Refreshing the page and/or logging out has no effect. It may or may not come back to a normal screen.
@ctid362150
ctid362150
24 Sep 2018, 17:48
The item listed above just cost me.
"...Candles stop appearing, even though the price lines are moving, the countdown clock is running and the screen moves to the next candle position. But no candles are appearing and it looks, at first glance, that the symbol isn't trading...."
UK100 was trading up, yet the S/L got taken out because the candles didn't move for several minutes. After the S/L got taken, I changed the screen from 1 minute, to 2 and back, and there were suddenly 4 extra candles.
FIX THESE ISSUES.
@ctid362150
ctid362150
22 Sep 2018, 07:33
Since the upgrade to Version 3 (cTrader Web on iMac) there are numerous problems
Platform will not respond to mouse-clicks when trying to close or modify position
Platform randomly 'restarts' and either reloads, reloads a wrong works space, or just sits there spinning the progress circles.
Candles stop appearing, even though the price lines are moving, the countdown clock is running and the screen moves to the next candle position. But no candles are appearing and it looks, at first glance, that the symbol isn't trading.
History disappears.
Orders that have been cancelled (before triggering) still appear on the screen as a pening order. Need to change timeframe and back again for the screen to redraw correctly. But if I look at another symbol (symbol B), and then return to symbol A, the cancelled orders appear back on the screen.
This happens in either Firefox or Safari (both latest version)
I think, until these issue are corrected, you should make Version 2 available again. (even if it's just by user choice) Not being able to close positions when you need to could get costly for some users.
Oh, and that dollar display format needs fixing.....
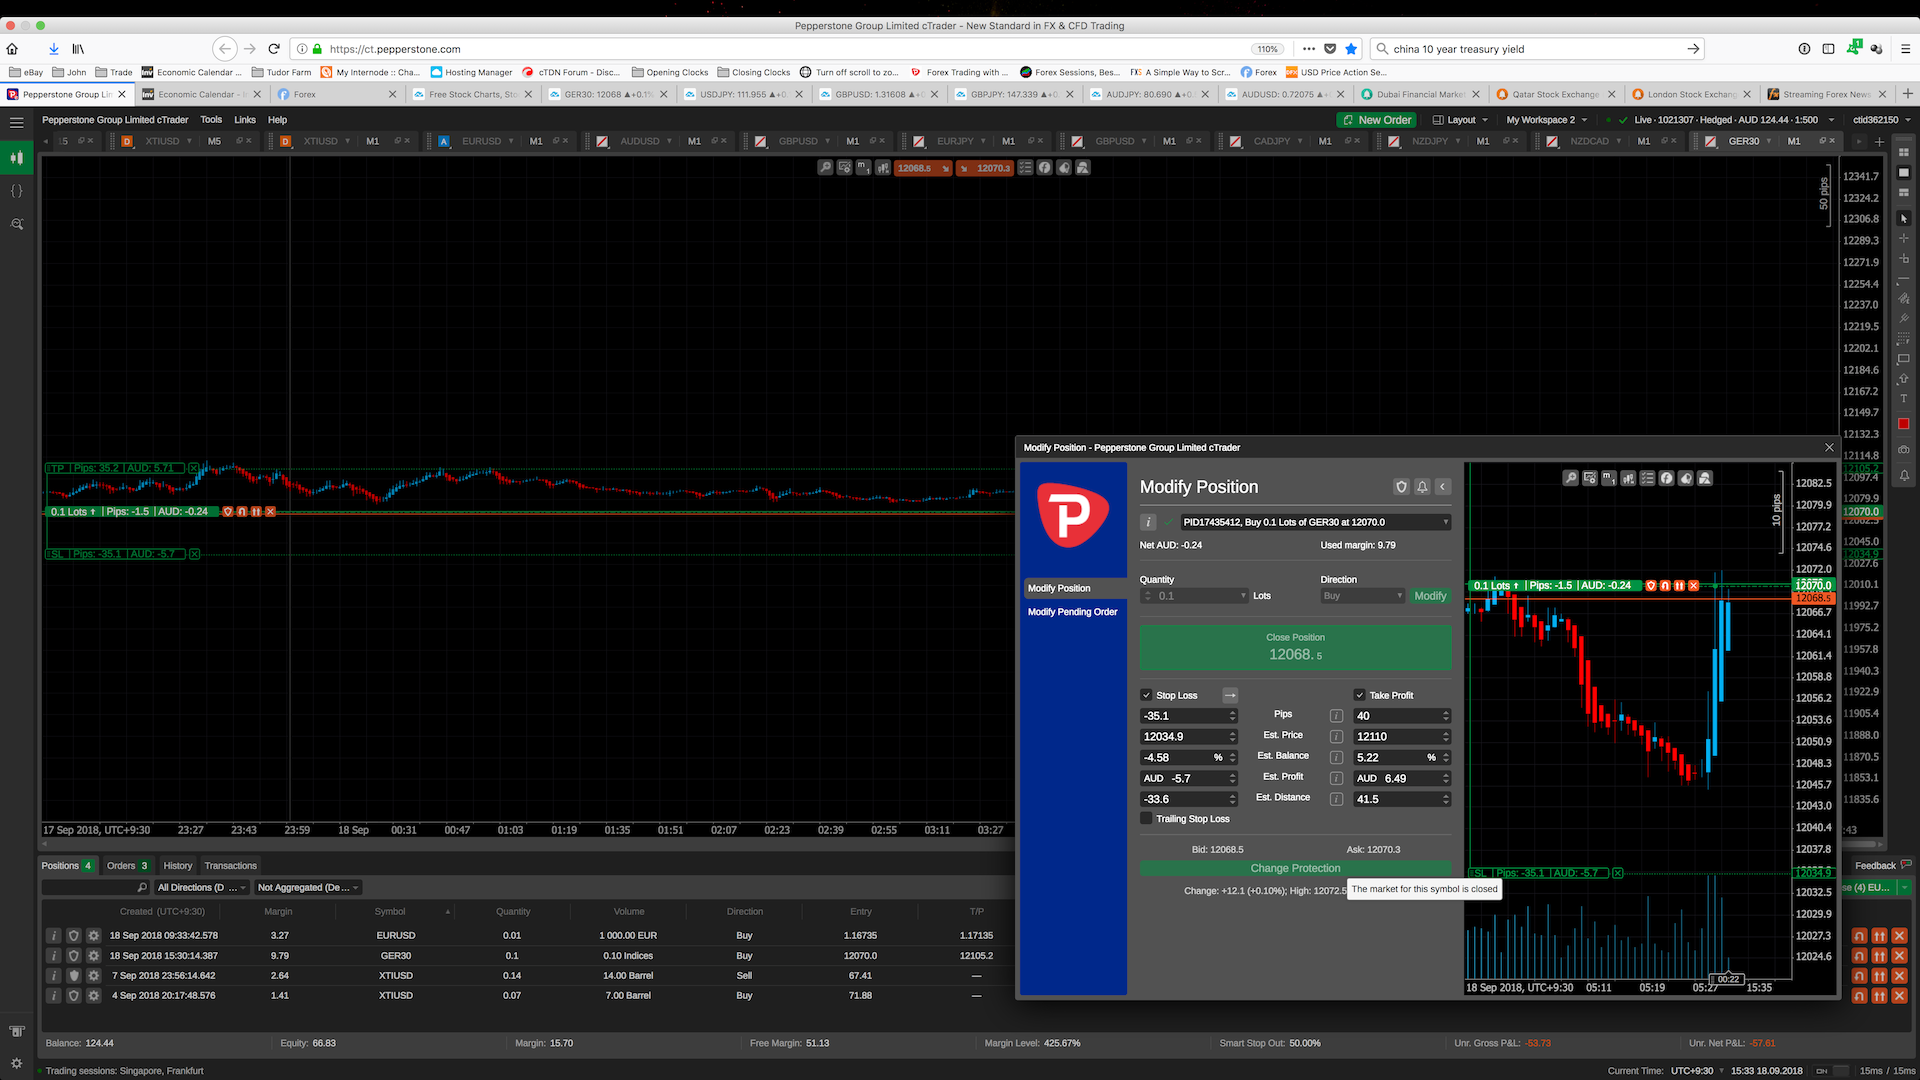
And the way we need to set a Trailing Stop is problematic.
See this post regarding that Trailing Stop Loss - Pips in trail.
Regards
John
@ctid362150
ctid362150
20 Sep 2018, 11:56
( Updated at: 21 Dec 2023, 09:20 )
Hi Panagiotis
Browser is Firefox version 62.0 or Safari version 12.0 it was happening on either of them
OS X 10.13.6 on latest iMac
Currently, it's displaying only today even though it's set for 'Current Month' It comes and goes.
Regards
John

@ctid362150
ctid362150
19 Sep 2018, 11:44
( Updated at: 21 Dec 2023, 09:20 )
I'm certain that if you re-read the post above, you'll see that the market was OPEN (15:30 local time) The pending order triggered 14 seconds AFTER opening. The, 3 minutes later, I got the error message.

@ctid362150
ctid362150
17 Sep 2018, 15:05
( Updated at: 21 Dec 2023, 09:20 )
Hi Panagiotis
In the bottom right corner of the Tradewatch area.

@ctid362150
ctid362150
17 Sep 2018, 11:57
( Updated at: 21 Dec 2023, 09:20 )
Hi Panagiotis
Is anyone (that matters) looking at these forums for possible issues? I'd have thought that with the release of a new version, they'd be watching here like a hawk to see if any bugs appear.
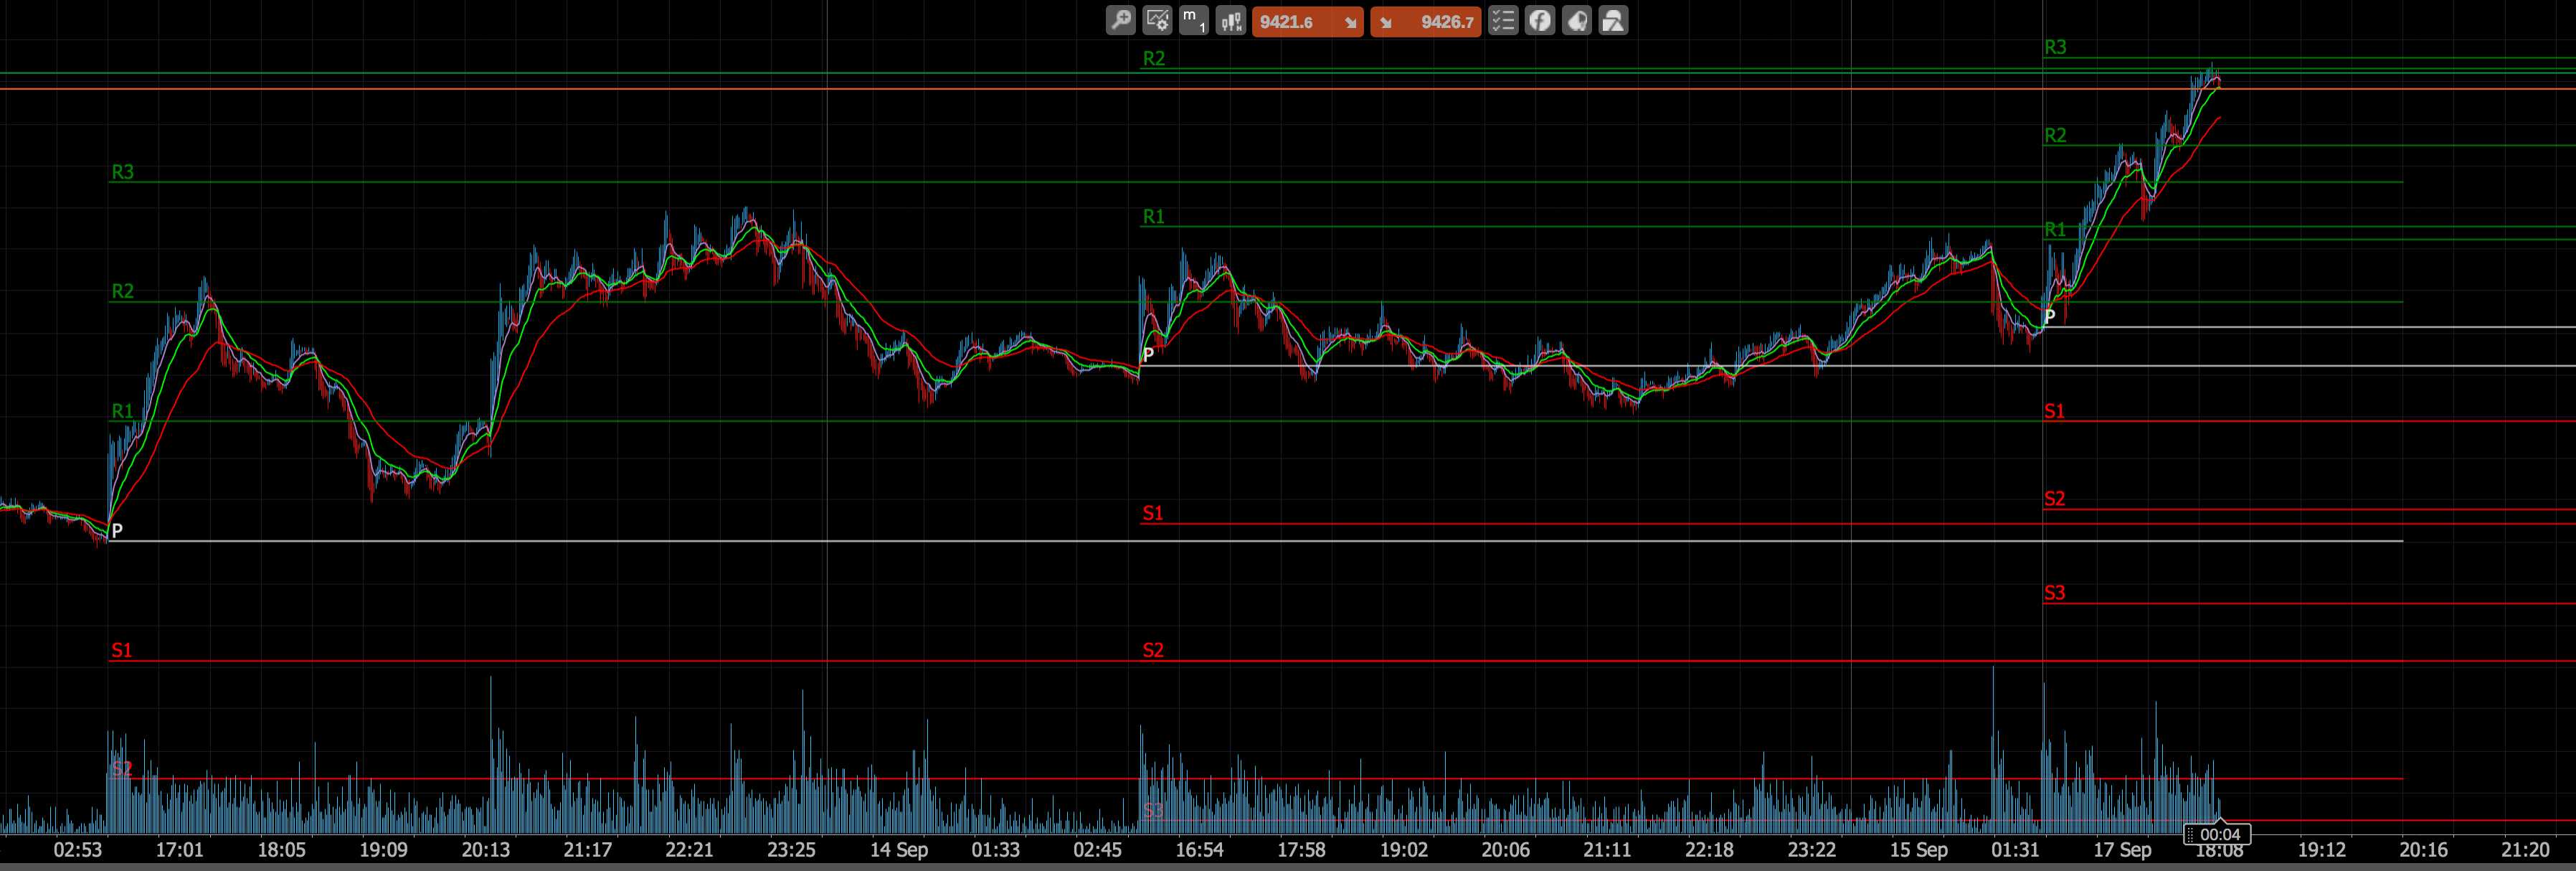
Well, this is still a problem. And it's extremely annoying. This is cTrader Web on an iMac. The IBEX here with daily Pivot points. You can see how they overlap. If the zoom level is anything wider than this, you end up wih a page of green and red smears as shown above. It makes the charts totally unusable. Unless it can be fixed, there should be an option to move back to the previous version.
Regards
John

@ctid362150
ctid362150
05 Sep 2018, 15:08
Hi Panagiotis
One thing that is blatantly missing is the account equity and balance. If it is there, I can't find it.
I'd be interested to know who trades using line or dot charts? If not many do, why them before the other charts (Heinkin Ashi for instance)
Regards
John
@ctid362150
ctid362150
16 Aug 2018, 14:47
My pivots don't show either on the one minute chart.
The two minute chart works just fine (as do any others above 1 minute)
I'm running the web version on an iMac.
Regards
John
@ctid362150
ctid362150
15 Aug 2018, 10:29
Panagiotis
It's counter intuative to use pips FROM the buy/sell price when setting a TSL (or even a normal SL)
A TSL is TRAILING and, as such, you should be able to set it to TRAIL by a number of pips.
If I'm 353.2 pips into profit, and want a TSL to trail by 50 pips, I shouldn't need to set it to PLUS 303.2 pips for that to happen.
It's even worse when you're setting one before into profit. I'm 75.6 into profit and want 100 pip TSL, I need to set the pip value to MINUS 24.4
All other platforms I've used, use the trailing pip value to invoke a TSL.
Regards
John
@ctid362150
ctid362150
13 Aug 2018, 11:47
Another thing I've noticed is that I can NOT colour lines in any of the indicators. In the previous IOS app, I'm able to colour indicator lines as needed.
@ctid362150
ctid362150
13 Aug 2018, 11:45
This crosshair time problem is also in the IOS version of the app.
I'm using it on iPhone 6S but still use the previous version on my iPad due to these issues and no HA candles. HA candles should have been coded in before dots or lines. I know no one that trades seriously with dot or line charts.
Regards
John
@ctid362150
ctid362150
03 Aug 2018, 16:46
USDCHF pair in current version requires margin of Au$270 for 1 lot.
In 3.0 Beta a 1 lot position of USDCHF is asking for a margin of Au$6,770.
Both accounts have the same Leverage settings.
@ctid362150
ctid362150
03 Aug 2018, 14:35
Also, I've just noticed when looking at currency pairs the following.
In the CURRENT version of cTrader the EURUSD pair for a 1 lot trade, there is NO commission required.
In the version 3.0 Beta, when I hover the mouse over the lot size (in the buy/sell box above the chart) there is no commission required. But when I hover the mouse over the lot size in the 'Active Symbol Panel' there is a commission required of Au$168.89 for the EURUSD symbol.
Regards
John
@ctid362150
ctid362150
03 Aug 2018, 14:22
With the Version 3.0 Beta, setting a Default template does NOT work for subsequent charts.
On the previous version, when I clicked on a trade in the 'Trade Watch' area (say USDJPY), the already open chart for that trade would become the focus of the screen. (even if I'm on another chart at the time (say EURUSD)).
With this version, if I'm on a chart (EURUSD) and click on a trade in Trade Watch (USDJPY), then THAT chart for EURUSD changes to the trade I just clicked USDJPY. Even if there is already a chart open for the USDJPY symbol. Therefore I then lose a chart for one symbol (EURUSD) and gain an extra chart for a symbol (USDJPY) I already have an open chart for.
Regards
John
PS
BTW, as an aside, on the CURRENT verion of cTrader Web setting a chart time (eg 1 minute) when creating a template does not carry through to subsequent chart openings.
@ctid362150
ctid362150
02 Sep 2019, 04:49
It is a trailing stop loss, so it should be set as pips TRAILING the spot price. Setting it as pips from the initial entry price is ridiculous. This is the only platform I've seen this on..
@ctid362150