Topics
Replies
applusplus
04 Oct 2024, 12:22
( Updated at: 04 Oct 2024, 12:24 )
RE: EMA and MACD lines on the same Chart mess up each others positions
sborisov said:
That is not a bug. Indicators that you use have different scales:
- EMA is has values in the same scale as its source 1.107… in your example
- MACD is measured in 0.000smth
So, these 2 indicators can't have the same Y scale.
When you combine lines of these indicators in the same indicator, the cTrader considers it as single indicator and finds minimum and maximum visible values from all indicator lines and scale them accordingly.
To be honest, I don't see any reason in putting MACD to the main chart, but if you want to do that you can do it by adding 2 separate indicators to the same chart and to the same Panel.
Thank you for your reply.
My idea was to make a custom Indicator, then use the Indicator in my cBot without replicating the same logic inside the bot.
Since the indicator suppose to create buy/sell signals based on EMA and MACD I wanted to draw all the lines, not only for better visualization but also so I can use all the Outputs from the custom indicator in the bot.
It's a real shame that I can't draw the same indicator in a panel and a chart at the same time or prevent “Output ”s from being drawn.
@applusplus
applusplus
03 Oct 2024, 15:19
( Updated at: 03 Oct 2024, 17:26 )
I just realized that my EMA is wrong. The Red line is my EMA from the code above. The Blue line is EMA 200 from default built-in indicator.
What is also extremely strange is that it changes when I move the chart, change the scale, etc.
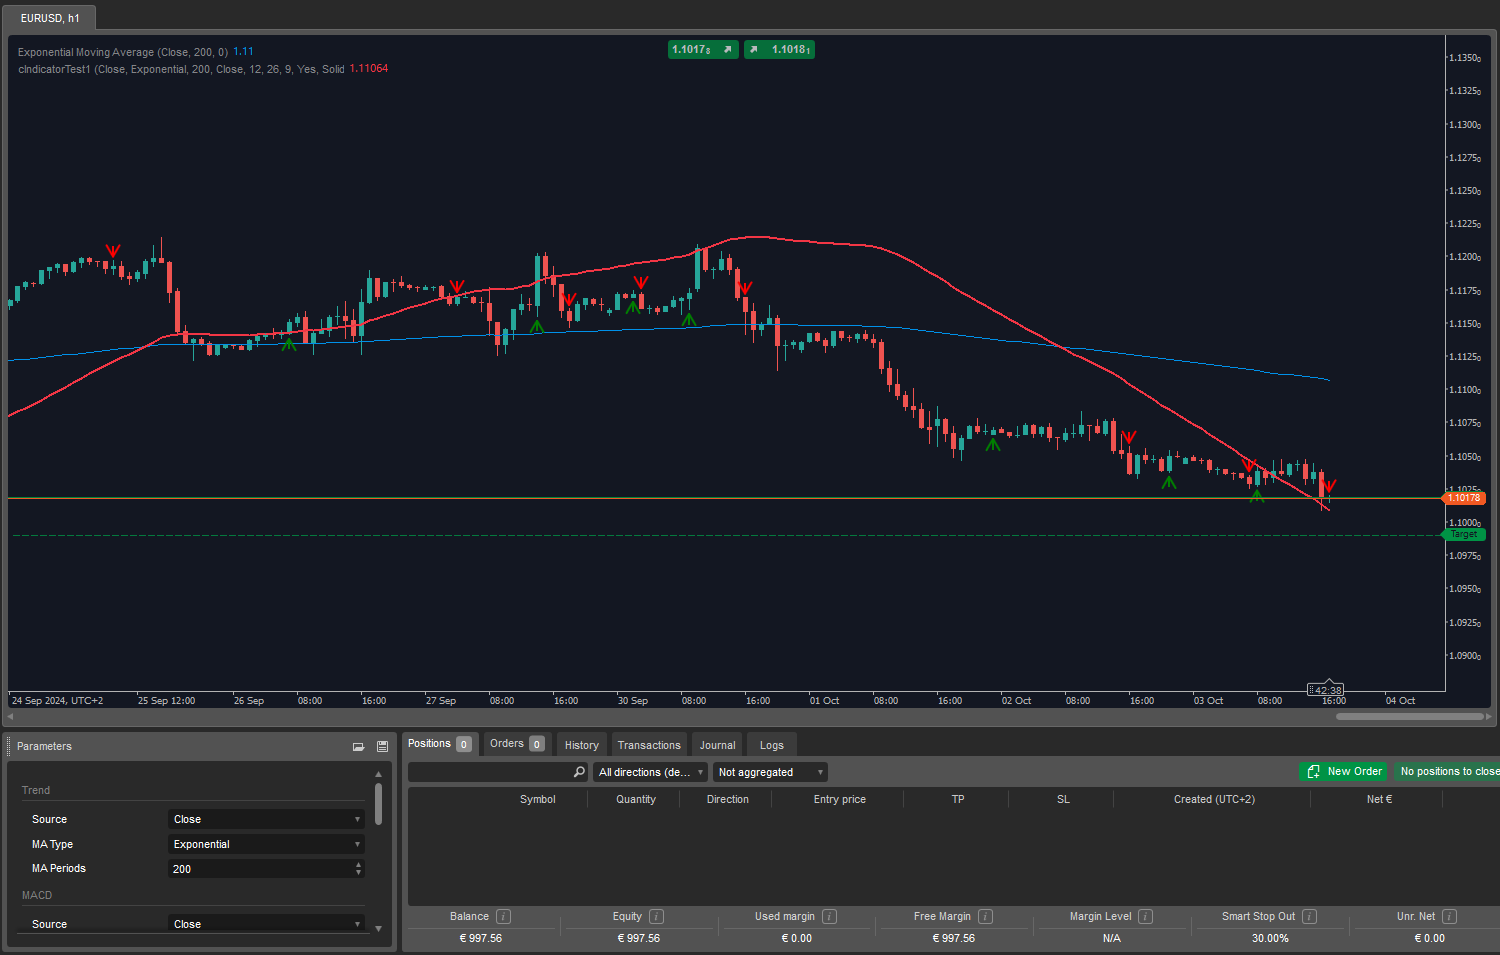
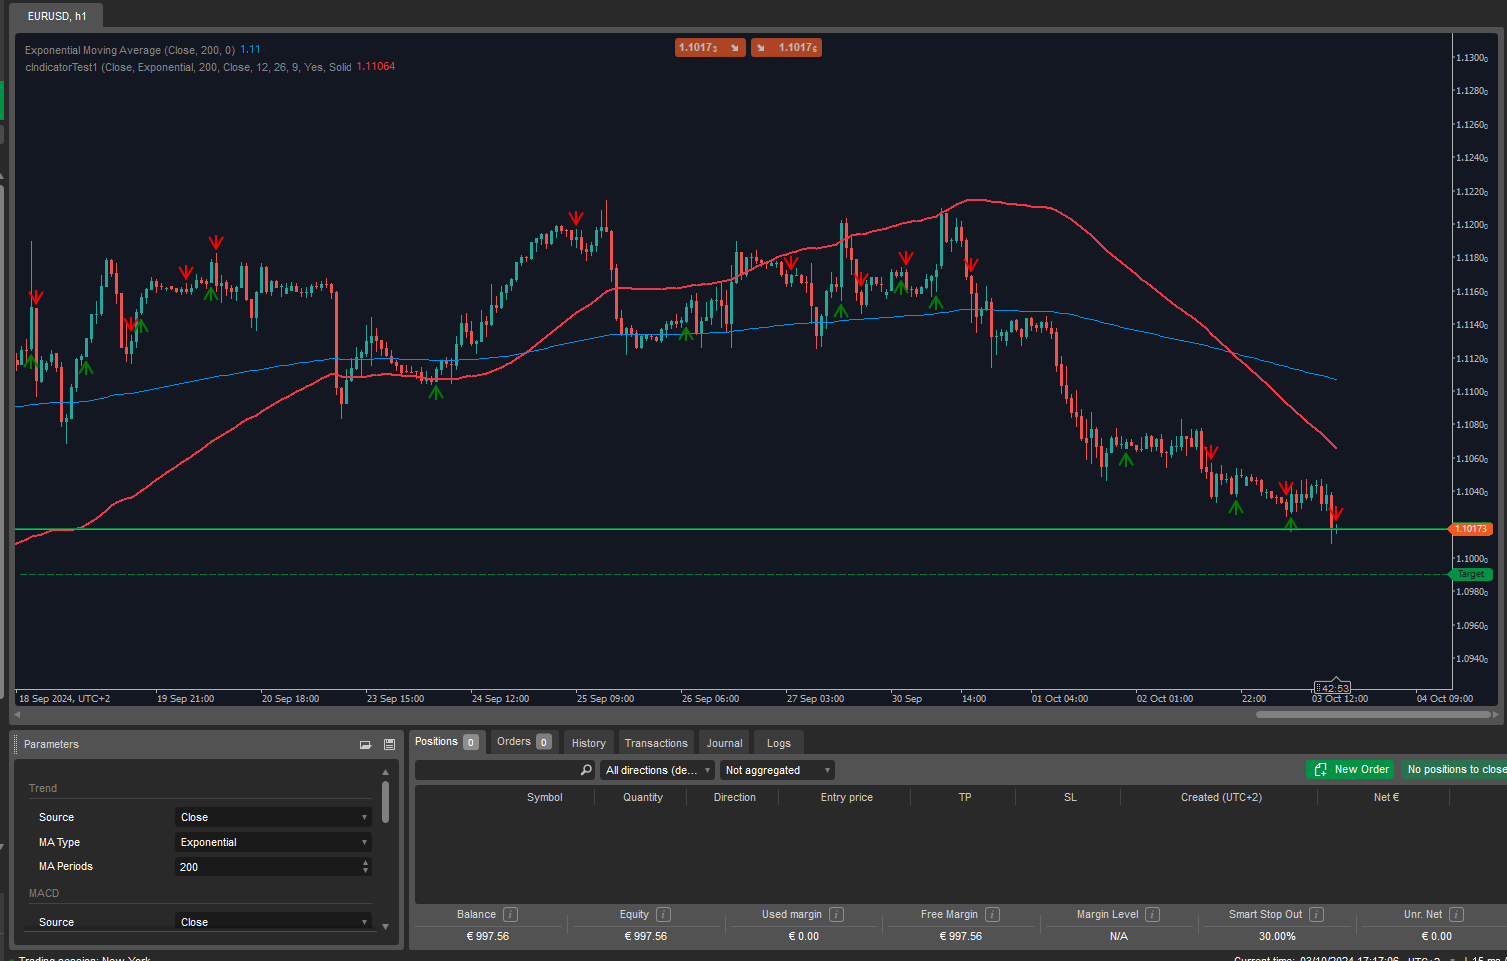
EDIT: I've fixed EMA by completely removing the Indicator and reinstalling it, but the problem from the first post still exists. I'm developing it in Visual Studio and the current cTrader version is 5.0.38.
@applusplus
applusplus
03 Oct 2024, 13:55
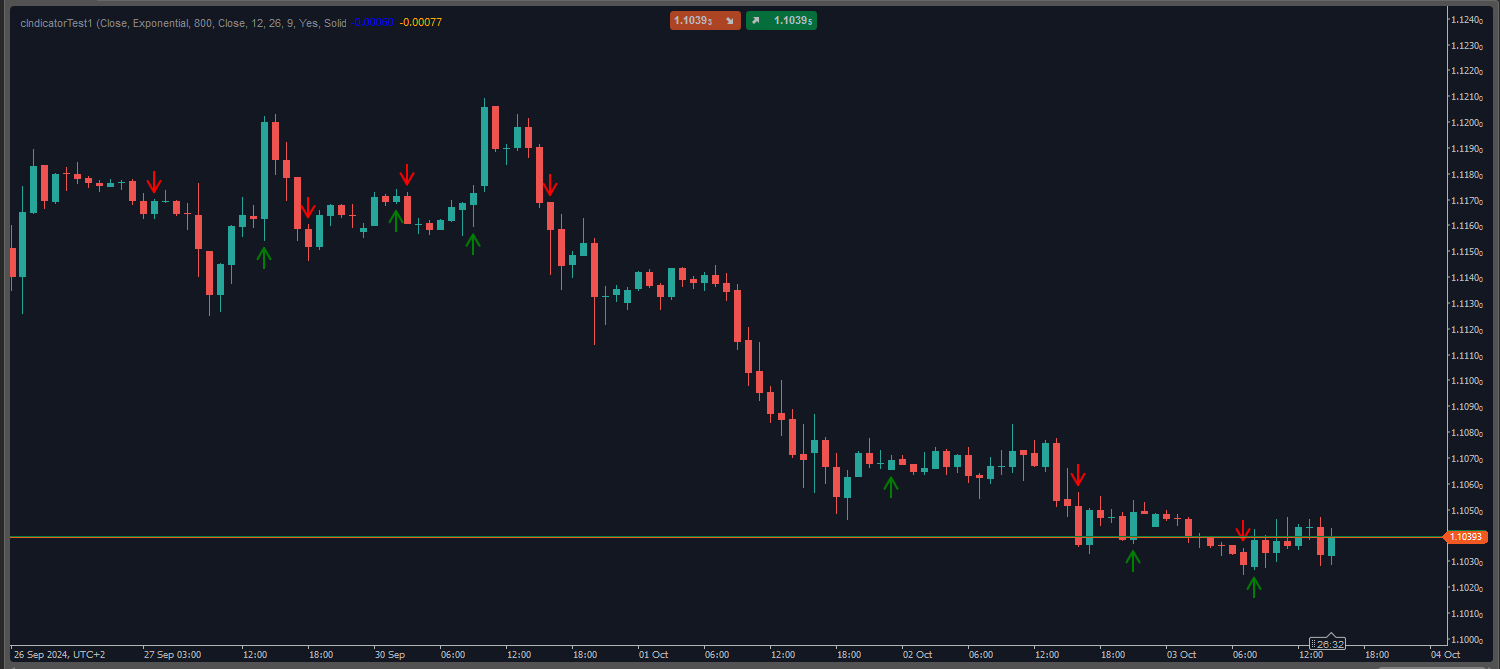
I just figured out how to draw arrows myself. To draw arrows like in picture below you have to do following:
private void DrawSignal(int index, bool bullish = true, double offset = 3)
{
    var length = SignalLength * 0.0001; // SignalLength is 8 to look like in the picture
    var name = "BullishSignal";
    var color = BullishSignalColor;
    double price;
    double y1;
    double y2;
    if (bullish)
    {
        price = Bars.LowPrices[index];
        y2 = price - Symbol.PipSize * offset;
        y1 = y2 - length;
    }
    else
    {
        color = BearishSignalColor;
        price = Bars.HighPrices[index];
        y2 = price + Symbol.PipSize * offset;
        y1 = y2 + length;
        name = "BearishSignal";
    }
    IndicatorArea.DrawArrow(name + index, index, y1, index, y2, color, 2, LineStyle.Solid);
}
The key part is y1, if y1 is greater than y2, the arrow points downwards, if it is smaller, it points upwards.
@applusplus
applusplus
03 Oct 2024, 12:12
( Updated at: 03 Oct 2024, 13:05 )
You can draw an “X” easily with two arrows. Or just use an arrow by itself.
Just a quick example:
var yPosition = Bars.MedianPrices[index];
IndicatorArea.DrawArrow("XFirstHalf" + index, index, yPosition + Symbol.PipSize, index, yPosition, Color.Red, 2);
IndicatorArea.DrawArrow("XSecondHalf" + index, index, yPosition - Symbol.PipSize, index, yPosition, Color.Red, 2);
@applusplus
applusplus
03 Oct 2024, 10:15
( Updated at: 03 Oct 2024, 13:05 )
For starters use Claude or ChatGPT, they do a decent job of writing code in cTrader.
You can literally ask them to convert the code. Obviously you will most likely have to test and correct it, but they still do a decent job in explaining what each function does etc.
@applusplus
applusplus
03 Oct 2024, 10:08
( Updated at: 03 Oct 2024, 13:05 )
Use
Chart.DrawTrendLine("line" + index, …to give each drawn object an unique name.
@applusplus
applusplus
04 Oct 2024, 12:32
RE: EMA and MACD lines on the same Chart mess up each others positions
sborisov said:
I understand. Thanks for clarification.
The issue is then settled. I'll change my approach.
@applusplus