
Topics
Replies
bart1
26 Jul 2019, 16:38
( Updated at: 21 Dec 2023, 09:21 )
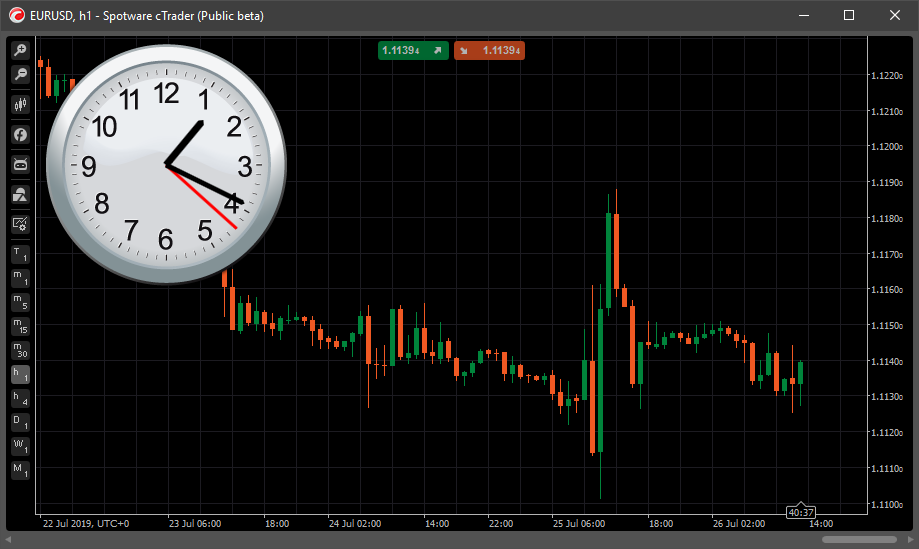
I don't know what for, but here you are. Analog clock on the chart
https://ctrader.com/algos/indicators/show/1975
@bart1
bart1
07 Mar 2019, 14:04
RE:
lec0456 said:
I would like to have some text appear on the chart when the mouse rolls over a chart object such as a Chart.DrawVerticalLine.
Is there a way to program this behavior?
Basically, I would think that there is some sort of event that couls be triggered to display a box of text.
The indicators do this by default now. When you rollover a chart object it displays a small popup that has the name of the indicator, its settings and its current value.
protected override void OnStart()
{
    Chart.ObjectHoverChanged += OnChartObjectHoverChanged;
}

void OnChartObjectHoverChanged(ChartObjectHoverChangedEventArgs obj)
{
    if (obj.IsObjectHovered)
        Chart.DrawStaticText("hoverText", obj.ChartObject.Name, VerticalAlignment.Top, HorizontalAlignment.Left, Chart.ColorSettings.ForegroundColor);
    else
        Chart.RemoveObject("hoverText");
}
@bart1
bart1
25 Feb 2019, 10:56
You can try to tweak your fitness function. Genetic optimization stops when there are no improvements after several iterations (fitness function return the same result). Which means you stuck at the local maximum.
Ideally it would be good to have a sim running on top 10 fitness bots infinately till stopped. (Trying to find better settings).
Don't do this, you will quickly find a local maximum without exploring other possibly more profitable areas.
Here is a very good video lecture from MIT about Genetic Algorithms.
https://www.youtube.com/watch?v=kHyNqSnzP8Y
Besides explaining how GA works, it shows simple examples of how you can stuck on a local maximum without exploring the whole area of possible outcomes.
Regards,
Bart
@bart1
bart1
14 Feb 2019, 12:19
RE: RE:
ctid863631 said:
Hi Bart,
Thanks for your help. do you also know what the buttons mean? been looking alover for it but no result.
This panel is for working with UI elements while developing WPF or other UI applications: selecting element, change its properties etc.
You can read about it here:
https://devblogs.microsoft.com/visualstudio/introducing-the-ui-debugging-tools-for-xaml/
@bart1
bart1
11 Feb 2019, 16:35
Take a look at http://quickfixn.org
It's a .Net port of a well known open source QuikFix engine: https://en.wikipedia.org/wiki/QuickFIX
@bart1
bart1
04 Feb 2019, 09:33
RE: RE:
So I need to query by cBot where the trendline stays (price) at the specified time or bar
CalculateY is doing exactly that.
From your screenshot, I assume that you might use horizontal lines. ChartHorizontalLine interface has Y property that doesn't change from bar to bar.
var lines = Chart.FindAllObjects<ChartHorizontalLine>();
foreach(var line in lines)
{
    Print(line.Y);
}
Cheers
@bart1
bart1
02 Feb 2019, 15:03
CalculetY is a method of ChartTrendLine interface:
var line = Chart.DrawTrendLine(...);
var price = CalculateY(someBarIndexOrTime);
Here is an example for drawing icon on each bar along with a trend line:
var line = Chart.DrawTrendLine("line", Chart.BarsTotal - 21, MarketSeries.High.Last(20), Chart.BarsTotal - 1, MarketSeries.High.Last(0), Color.Red);
foreach (var i in Enumerable.Range(-5, 30))
{
    var barIndex = Chart.BarsTotal - i;
    var price = line.CalculateY(barIndex);
    Chart.DrawIcon("icon" + i.ToString(), ChartIconType.Circle, barIndex, price, "#80FFFFFF");
}
@bart1
bart1
23 Nov 2018, 09:58
RE: RE: RE: RE:
stajefala said:
Never mind, the objects are "semi transparent" this code only changes if its fully transparent.. not the first time a cTrader update has caused so much pain!
I´ll just refix everything manually.
For semi transparent objects you can change line 17 to
var transparentObjects = Chart.Objects.Where(o => GetObjectColor(o).A < 255).ToList();
You need to run this cBot on every chart where you have transparent objects.
@bart1
bart1
22 Nov 2018, 18:42
RE: RE:
stajefala said:
Sorry but i have no idea on how to build, i just tried building it for 30mins.. could not figure it out.
- Go to Automate
- Create new cBot
- Replace all the text in code editor with example from above
- Build it
Then you can add this cBot to the chart with transparent objects and run it. Logs will have some info:
22/11/2018 15:51:47.321 | cBot "New cBot" was started successfully for EURUSD, h1.
22/11/2018 15:51:47.477 | 3 objects on the chart
22/11/2018 15:51:47.477 | 2 objects with transparent color
22/11/2018 15:51:47.477 | Colors fixed
@bart1
bart1
22 Nov 2018, 17:52
Try this code, it changes alpha channel for all transparent chart objects from 0 to 255:
using System;
using System.Collections.Generic;
using System.Linq;
using cAlgo.API;
using cAlgo.API.Indicators;
using cAlgo.API.Internals;
using cAlgo.Indicators;

namespace cAlgo.Robots
{
    [Robot(TimeZone = TimeZones.UTC, AccessRights = AccessRights.FullAccess)]
    public class NewcBot : Robot
    {
        protected override void OnStart()
        {
            Print("{0} objects on the chart", Chart.Objects.Count);
            var transparentObjects = Chart.Objects.Where(o => GetObjectColor(o).A == 0).ToList();
            Print("{0} objects with transparent color", transparentObjects.Count);
            if (transparentObjects.Any())
            {
                FixTransparentObjects(transparentObjects);
                Print("Colors fixed");
            }
            Stop();
        }

        private void FixTransparentObjects(List<ChartObject> transparentObjects)
        {
            foreach (var obj in transparentObjects)
            {
                var transparentColor = GetObjectColor(obj);
                var normalColor = Color.FromArgb(255, transparentColor);
                SetObjectColor(obj, normalColor);
            }
        }

        private Color GetObjectColor(ChartObject obj)
        {
            return (Color)obj.GetType().GetProperty("Color").GetValue(obj, null);
        }

        private void SetObjectColor(ChartObject obj, Color color)
        {
            obj.GetType().GetProperty("Color").SetValue(obj, color, null);
        }
    }
}
@bart1
bart1
03 Aug 2017, 11:56
After ClosePosition executed, Position.Pips is updated and have actual result. So you need to calculate close price using position.EntryPrice and position.Pips:
private double GetPositionClosePrice(Position position)
{
    var symbol = MarketData.GetSymbol(position.SymbolCode);
    var closePrice = position.EntryPrice + position.Pips * symbol.PipSize * (position.TradeType == TradeType.Buy ? 1 : -1);
    return closePrice;
}
@bart1
bart1
23 Oct 2019, 09:15 ( Updated at: 21 Dec 2023, 09:21 )
You can disable auto formatting in code editor using this setting:
@bart1