Topics
Replies
tuuguu177
21 Dec 2024, 06:44
( Updated at: 23 Dec 2024, 08:01 )
Cloud you pls advise to me?
@tuuguu177
tuuguu177
11 Nov 2024, 15:18
RE: RE: RE: RE: RE: lock buy sell button
PanagiotisCharalampous said:
tuuguu177 said:
PanagiotisCharalampous said:
tuuguu177 said:
PanagiotisCharalampous said:
Hi there,
Add
using System.Linq;in the namespaces you use
Best regards,
Panagiotis
I put it but it did not work
Please share the updated cBot code
using System;
using System.Collections.Generic;
using cAlgo.API;
using cAlgo.API.Internals;
using System.Linq;
using cAlgo.Indicators;
using cAlgo.API.Indicators;
namespace cAlgo
{
[Robot(TimeZone = TimeZones.UTC, AccessRights = AccessRights.None)]
public class SampleTradingPanel : Robot
{
[Parameter("Vertical Position", Group = "Panel alignment", DefaultValue = VerticalAlignment.Top)]
public VerticalAlignment PanelVerticalAlignment { get; set; }
[Parameter("Horizontal Position", Group = "Panel alignment", DefaultValue = HorizontalAlignment.Left)]
public HorizontalAlignment PanelHorizontalAlignment { get; set; }
[Parameter("Default Lots", Group = "Default trade parameters", DefaultValue = 0.01)]
public double DefaultLots { get; set; }
[Parameter("Default Take Profit (pips)", Group = "Default trade parameters", DefaultValue = 100)]
public double DefaultTakeProfitPips { get; set; }
[Parameter("Default Stop Loss (pips)", Group = "Default trade parameters", DefaultValue = 20)]
public double DefaultStopLossPips { get; set; }
protected override void OnStart()
{
var tradingPanel = new TradingPanel(this, Symbol, DefaultLots, DefaultStopLossPips, DefaultTakeProfitPips);
var border = new Border
{
VerticalAlignment = PanelVerticalAlignment,
HorizontalAlignment = PanelHorizontalAlignment,
Style = Styles.CreatePanelBackgroundStyle(),
Margin = "20 350 2 20",
Width = 145,
Child = tradingPanel
};
Chart.AddControl(border);
}
}
public class TradingPanel : CustomControl
{
private const string LotsInputKey = "LotsKey";
private const string TakeProfitInputKey = "TPKey";
private const string StopLossInputKey = "SLKey";
private readonly IDictionary<string, TextBox> _inputMap = new Dictionary<string, TextBox>();
private readonly Robot _robot;
private readonly Symbol _symbol;
public TradingPanel(Robot robot, Symbol symbol, double defaultLots, double defaultStopLossPips, double defaultTakeProfitPips)
{
_robot = robot;
_symbol = symbol;
AddChild(CreateTradingPanel(defaultLots, defaultStopLossPips, defaultTakeProfitPips));
}
private ControlBase CreateTradingPanel(double defaultLots, double defaultStopLossPips, double defaultTakeProfitPips)
{
var mainPanel = new StackPanel();
var header = CreateHeader();
mainPanel.AddChild(header);
var contentPanel = CreateContentPanel(defaultLots, defaultStopLossPips, defaultTakeProfitPips);
mainPanel.AddChild(contentPanel);
return mainPanel;
}
private ControlBase CreateHeader()
{
var headerBorder = new Border
{
BorderThickness = "0 0 0 1",
Style = Styles.CreateCommonBorderStyle()
};
var header = new TextBlock
{
Text = "Quick Trading Panel",
Margin = "10 7",
Style = Styles.CreateHeaderStyle()
};
headerBorder.Child = header;
return headerBorder;
}
private StackPanel CreateContentPanel(double defaultLots, double defaultStopLossPips, double defaultTakeProfitPips)
{
var contentPanel = new StackPanel
{
Margin = 10
};
var grid = new Grid(4, 3);
//var grid2 = new Grid(5, 3);
grid.Columns[1].SetWidthInPixels(5);
var sellButton = CreateTradeButton("SELL", Styles.CreateSellButtonStyle(), TradeType.Sell);
grid.AddChild(sellButton, 0, 0);
var buyButton = CreateTradeButton("BUY", Styles.CreateBuyButtonStyle(), TradeType.Buy);
grid.AddChild(buyButton, 0, 2);
var lotsInput = CreateInputWithLabel("Quantity (Lots)", defaultLots.ToString("F2"), LotsInputKey);
grid.AddChild(lotsInput, 1, 0, 1, 3);
var stopLossInput = CreateInputWithLabel("SL/Pips/", defaultStopLossPips.ToString("F1"), StopLossInputKey);
grid.AddChild(stopLossInput, 2, 0);
var takeProfitInput = CreateInputWithLabel("TP/Pips/", defaultTakeProfitPips.ToString("F1"), TakeProfitInputKey);
grid.AddChild(takeProfitInput, 2, 2);
var closeAllButton = CreateCloseAllButton();
var closeAllButton2 = CreateCloseAllButton2();
//grid.AddChild(closeAllButton, 3, 0, 1, 3);
//grid.AddChild(closeAllButton2, 3, 0, 1, 3);
grid.AddChild(closeAllButton, 3, 0);
grid.AddChild(closeAllButton2, 3, 2);
contentPanel.AddChild(grid);
return contentPanel;
}
private Button CreateTradeButton(string text, Style style, TradeType tradeType)
{
var tradeButton = new Button
{
Text = text,
Style = style,
Height = 25
};
tradeButton.Click += args => ExecuteMarketOrderAsync(tradeType);
return tradeButton;
}
private ControlBase CreateCloseAllButton()
{
var closeAllBorder = new Border
{
Margin = "0 20 0 0",
BorderThickness = "0 1 0 0",
Style = Styles.CreateCommonBorderStyle()
};
var closeButton = new Button
{
Style = Styles.CreateCloseButtonStyle(),
Text = "Close.A",
Margin = "0 20 0 0"
};
closeButton.Click += args => CloseAll();
closeAllBorder.Child = closeButton;
return closeAllBorder;
}
private ControlBase CreateCloseAllButton2()
{
var closeAllBorder2 = new Border
{
Margin = "0 20 0 0",
BorderThickness = "0 1 0 0",
Style = Styles.CreateCommonBorderStyle()
};
var closeButton2 = new Button
{
Style = Styles.CreateCloseButtonStyle(),
Text = "Close.P",
Margin = "0 20 0 0"
};
closeButton2.Click += args => ClosePart();
closeAllBorder2.Child = closeButton2;
return closeAllBorder2;
}
private Panel CreateInputWithLabel(string label, string defaultValue, string inputKey)
{
var stackPanel = new StackPanel
{
Orientation = Orientation.Vertical,
Margin = "0 10 0 0"
};
var textBlock = new TextBlock
{
Text = label
};
var input = new TextBox
{
Margin = "0 5 0 0",
Text = defaultValue,
Style = Styles.CreateInputStyle()
};
_inputMap.Add(inputKey, input);
stackPanel.AddChild(textBlock);
stackPanel.AddChild(input);
return stackPanel;
}
private void ExecuteMarketOrderAsync(TradeType tradeType)
{
var lots = GetValueFromInput(LotsInputKey, 0);
if (lots <= 0)
{
_robot.Print(string.Format("{0} failed, invalid Lots", tradeType));
return;
}
var stopLossPips = GetValueFromInput(StopLossInputKey, 0);
var takeProfitPips = GetValueFromInput(TakeProfitInputKey, 0);
_robot.Print(string.Format("Open position with: LotsParameter: {0}, StopLossPipsParameter: {1}, TakeProfitPipsParameter: {2}", lots, stopLossPips, takeProfitPips));
//var netProfit = Account.UnrealizedNetProfit;
//var PercentProfit = Math.Round(netProfit / Account.Balance * 100, 2);
var volume = _symbol.QuantityToVolumeInUnits(lots);
if (Account.Equity < Account.Balance * ((100 - maxDrawDown) / 100))
{
//foreach (var position in Positions)
//ClosePositionAsync(position);
}
_robot.ExecuteMarketOrderAsync(tradeType, _symbol.Name, volume, "Trade Panel Sample", stopLossPips, takeProfitPips);
}
private double GetValueFromInput(string inputKey, double defaultValue)
{
double value;
return double.TryParse(_inputMap[inputKey].Text, out value) ? value : defaultValue;
}
private void CloseAll()
{
foreach (var position in _robot.Positions)
_robot.ClosePositionAsync(position);
}
private void ClosePart()
{
foreach (var position in _robot.Positions)
{
_robot.ClosePosition(position, 5);
}
}
}
public static class Styles
{
public static Style CreatePanelBackgroundStyle()
{
var style = new Style();
style.Set(ControlProperty.CornerRadius, 3);
style.Set(ControlProperty.BackgroundColor, GetColorWithOpacity(Color.FromHex("#292929"), 0.10m), ControlState.DarkTheme);
style.Set(ControlProperty.BackgroundColor, GetColorWithOpacity(Color.FromHex("#FFFFFF"), 0.10m), ControlState.LightTheme);
style.Set(ControlProperty.BorderColor, Color.FromHex("#3C3C3C"), ControlState.DarkTheme);
style.Set(ControlProperty.BorderColor, Color.FromHex("#C3C3C3"), ControlState.LightTheme);
style.Set(ControlProperty.BorderThickness, new Thickness(1));
return style;
}
public static Style CreateCommonBorderStyle()
{
var style = new Style();
style.Set(ControlProperty.BorderColor, GetColorWithOpacity(Color.FromHex("#FFFFFF"), 0.12m), ControlState.DarkTheme);
style.Set(ControlProperty.BorderColor, GetColorWithOpacity(Color.FromHex("#000000"), 0.12m), ControlState.LightTheme);
return style;
}
public static Style CreateHeaderStyle()
{
var style = new Style();
style.Set(ControlProperty.ForegroundColor, GetColorWithOpacity("#FFFFFF", 0.70m), ControlState.DarkTheme);
style.Set(ControlProperty.ForegroundColor, GetColorWithOpacity("#000000", 0.65m), ControlState.LightTheme);
return style;
}
public static Style CreateInputStyle()
{
var style = new Style(DefaultStyles.TextBoxStyle);
style.Set(ControlProperty.BackgroundColor, Color.FromHex("#1A1A1A"), ControlState.DarkTheme);
style.Set(ControlProperty.BackgroundColor, Color.FromHex("#111111"), ControlState.DarkTheme | ControlState.Hover);
style.Set(ControlProperty.BackgroundColor, Color.FromHex("#E7EBED"), ControlState.LightTheme);
style.Set(ControlProperty.BackgroundColor, Color.FromHex("#D6DADC"), ControlState.LightTheme | ControlState.Hover);
style.Set(ControlProperty.CornerRadius, 3);
return style;
}
public static Style CreateBuyButtonStyle()
{
return CreateButtonStyle(Color.FromHex("#009345"), Color.FromHex("#10A651"));
}
public static Style CreateSellButtonStyle()
{
return CreateButtonStyle(Color.FromHex("#F05824"), Color.FromHex("#FF6C36"));
}
public static Style CreateCloseButtonStyle()
{
return CreateButtonStyle(Color.FromHex("#F05824"), Color.FromHex("#FF6C36"));
}
private static Style CreateButtonStyle(Color color, Color hoverColor)
{
var style = new Style(DefaultStyles.ButtonStyle);
style.Set(ControlProperty.BackgroundColor, color, ControlState.DarkTheme);
style.Set(ControlProperty.BackgroundColor, color, ControlState.LightTheme);
style.Set(ControlProperty.BackgroundColor, hoverColor, ControlState.DarkTheme | ControlState.Hover);
style.Set(ControlProperty.BackgroundColor, hoverColor, ControlState.LightTheme | ControlState.Hover);
style.Set(ControlProperty.ForegroundColor, Color.FromHex("#FFFFFF"), ControlState.DarkTheme);
style.Set(ControlProperty.ForegroundColor, Color.FromHex("#FFFFFF"), ControlState.LightTheme);
return style;
}
private static Color GetColorWithOpacity(Color baseColor, decimal opacity)
{
var alpha = (int)Math.Round(byte.MaxValue * opacity, MidpointRounding.AwayFromZero);
return Color.FromArgb(alpha, baseColor);
}
}
}
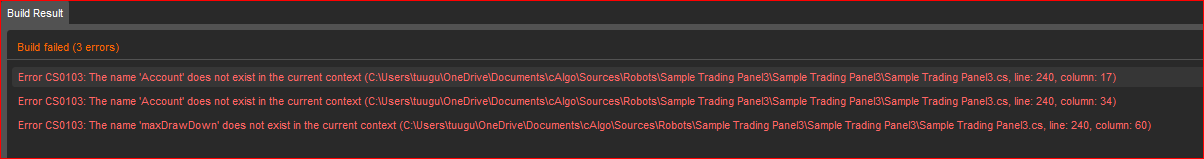
Hi there,
The errors are different this time and they are self explanatory. You are using variables that are not defined anywhere.
Best regards,
Panagiotis
could you please give me the code?
@tuuguu177
tuuguu177
11 Nov 2024, 11:32
RE: RE: RE: lock buy sell button
PanagiotisCharalampous said:
tuuguu177 said:
PanagiotisCharalampous said:
Hi there,
Add
using System.Linq;in the namespaces you use
Best regards,
Panagiotis
I put it but it did not work
Please share the updated cBot code
using System;
using System.Collections.Generic;
using cAlgo.API;
using cAlgo.API.Internals;
using System.Linq;
using cAlgo.Indicators;
using cAlgo.API.Indicators;
namespace cAlgo
{
[Robot(TimeZone = TimeZones.UTC, AccessRights = AccessRights.None)]
public class SampleTradingPanel : Robot
{
[Parameter("Vertical Position", Group = "Panel alignment", DefaultValue = VerticalAlignment.Top)]
public VerticalAlignment PanelVerticalAlignment { get; set; }
[Parameter("Horizontal Position", Group = "Panel alignment", DefaultValue = HorizontalAlignment.Left)]
public HorizontalAlignment PanelHorizontalAlignment { get; set; }
[Parameter("Default Lots", Group = "Default trade parameters", DefaultValue = 0.01)]
public double DefaultLots { get; set; }
[Parameter("Default Take Profit (pips)", Group = "Default trade parameters", DefaultValue = 100)]
public double DefaultTakeProfitPips { get; set; }
[Parameter("Default Stop Loss (pips)", Group = "Default trade parameters", DefaultValue = 20)]
public double DefaultStopLossPips { get; set; }
protected override void OnStart()
{
var tradingPanel = new TradingPanel(this, Symbol, DefaultLots, DefaultStopLossPips, DefaultTakeProfitPips);
var border = new Border
{
VerticalAlignment = PanelVerticalAlignment,
HorizontalAlignment = PanelHorizontalAlignment,
Style = Styles.CreatePanelBackgroundStyle(),
Margin = "20 350 2 20",
Width = 145,
Child = tradingPanel
};
Chart.AddControl(border);
}
}
public class TradingPanel : CustomControl
{
private const string LotsInputKey = "LotsKey";
private const string TakeProfitInputKey = "TPKey";
private const string StopLossInputKey = "SLKey";
private readonly IDictionary<string, TextBox> _inputMap = new Dictionary<string, TextBox>();
private readonly Robot _robot;
private readonly Symbol _symbol;
public TradingPanel(Robot robot, Symbol symbol, double defaultLots, double defaultStopLossPips, double defaultTakeProfitPips)
{
_robot = robot;
_symbol = symbol;
AddChild(CreateTradingPanel(defaultLots, defaultStopLossPips, defaultTakeProfitPips));
}
private ControlBase CreateTradingPanel(double defaultLots, double defaultStopLossPips, double defaultTakeProfitPips)
{
var mainPanel = new StackPanel();
var header = CreateHeader();
mainPanel.AddChild(header);
var contentPanel = CreateContentPanel(defaultLots, defaultStopLossPips, defaultTakeProfitPips);
mainPanel.AddChild(contentPanel);
return mainPanel;
}
private ControlBase CreateHeader()
{
var headerBorder = new Border
{
BorderThickness = "0 0 0 1",
Style = Styles.CreateCommonBorderStyle()
};
var header = new TextBlock
{
Text = "Quick Trading Panel",
Margin = "10 7",
Style = Styles.CreateHeaderStyle()
};
headerBorder.Child = header;
return headerBorder;
}
private StackPanel CreateContentPanel(double defaultLots, double defaultStopLossPips, double defaultTakeProfitPips)
{
var contentPanel = new StackPanel
{
Margin = 10
};
var grid = new Grid(4, 3);
//var grid2 = new Grid(5, 3);
grid.Columns[1].SetWidthInPixels(5);
var sellButton = CreateTradeButton("SELL", Styles.CreateSellButtonStyle(), TradeType.Sell);
grid.AddChild(sellButton, 0, 0);
var buyButton = CreateTradeButton("BUY", Styles.CreateBuyButtonStyle(), TradeType.Buy);
grid.AddChild(buyButton, 0, 2);
var lotsInput = CreateInputWithLabel("Quantity (Lots)", defaultLots.ToString("F2"), LotsInputKey);
grid.AddChild(lotsInput, 1, 0, 1, 3);
var stopLossInput = CreateInputWithLabel("SL/Pips/", defaultStopLossPips.ToString("F1"), StopLossInputKey);
grid.AddChild(stopLossInput, 2, 0);
var takeProfitInput = CreateInputWithLabel("TP/Pips/", defaultTakeProfitPips.ToString("F1"), TakeProfitInputKey);
grid.AddChild(takeProfitInput, 2, 2);
var closeAllButton = CreateCloseAllButton();
var closeAllButton2 = CreateCloseAllButton2();
//grid.AddChild(closeAllButton, 3, 0, 1, 3);
//grid.AddChild(closeAllButton2, 3, 0, 1, 3);
grid.AddChild(closeAllButton, 3, 0);
grid.AddChild(closeAllButton2, 3, 2);
contentPanel.AddChild(grid);
return contentPanel;
}
private Button CreateTradeButton(string text, Style style, TradeType tradeType)
{
var tradeButton = new Button
{
Text = text,
Style = style,
Height = 25
};
tradeButton.Click += args => ExecuteMarketOrderAsync(tradeType);
return tradeButton;
}
private ControlBase CreateCloseAllButton()
{
var closeAllBorder = new Border
{
Margin = "0 20 0 0",
BorderThickness = "0 1 0 0",
Style = Styles.CreateCommonBorderStyle()
};
var closeButton = new Button
{
Style = Styles.CreateCloseButtonStyle(),
Text = "Close.A",
Margin = "0 20 0 0"
};
closeButton.Click += args => CloseAll();
closeAllBorder.Child = closeButton;
return closeAllBorder;
}
private ControlBase CreateCloseAllButton2()
{
var closeAllBorder2 = new Border
{
Margin = "0 20 0 0",
BorderThickness = "0 1 0 0",
Style = Styles.CreateCommonBorderStyle()
};
var closeButton2 = new Button
{
Style = Styles.CreateCloseButtonStyle(),
Text = "Close.P",
Margin = "0 20 0 0"
};
closeButton2.Click += args => ClosePart();
closeAllBorder2.Child = closeButton2;
return closeAllBorder2;
}
private Panel CreateInputWithLabel(string label, string defaultValue, string inputKey)
{
var stackPanel = new StackPanel
{
Orientation = Orientation.Vertical,
Margin = "0 10 0 0"
};
var textBlock = new TextBlock
{
Text = label
};
var input = new TextBox
{
Margin = "0 5 0 0",
Text = defaultValue,
Style = Styles.CreateInputStyle()
};
_inputMap.Add(inputKey, input);
stackPanel.AddChild(textBlock);
stackPanel.AddChild(input);
return stackPanel;
}
private void ExecuteMarketOrderAsync(TradeType tradeType)
{
var lots = GetValueFromInput(LotsInputKey, 0);
if (lots <= 0)
{
_robot.Print(string.Format("{0} failed, invalid Lots", tradeType));
return;
}
var stopLossPips = GetValueFromInput(StopLossInputKey, 0);
var takeProfitPips = GetValueFromInput(TakeProfitInputKey, 0);
_robot.Print(string.Format("Open position with: LotsParameter: {0}, StopLossPipsParameter: {1}, TakeProfitPipsParameter: {2}", lots, stopLossPips, takeProfitPips));
//var netProfit = Account.UnrealizedNetProfit;
//var PercentProfit = Math.Round(netProfit / Account.Balance * 100, 2);
var volume = _symbol.QuantityToVolumeInUnits(lots);
if (Account.Equity < Account.Balance * ((100 - maxDrawDown) / 100))
{
//foreach (var position in Positions)
//ClosePositionAsync(position);
}
_robot.ExecuteMarketOrderAsync(tradeType, _symbol.Name, volume, "Trade Panel Sample", stopLossPips, takeProfitPips);
}
private double GetValueFromInput(string inputKey, double defaultValue)
{
double value;
return double.TryParse(_inputMap[inputKey].Text, out value) ? value : defaultValue;
}
private void CloseAll()
{
foreach (var position in _robot.Positions)
_robot.ClosePositionAsync(position);
}
private void ClosePart()
{
foreach (var position in _robot.Positions)
{
_robot.ClosePosition(position, 5);
}
}
}
public static class Styles
{
public static Style CreatePanelBackgroundStyle()
{
var style = new Style();
style.Set(ControlProperty.CornerRadius, 3);
style.Set(ControlProperty.BackgroundColor, GetColorWithOpacity(Color.FromHex("#292929"), 0.10m), ControlState.DarkTheme);
style.Set(ControlProperty.BackgroundColor, GetColorWithOpacity(Color.FromHex("#FFFFFF"), 0.10m), ControlState.LightTheme);
style.Set(ControlProperty.BorderColor, Color.FromHex("#3C3C3C"), ControlState.DarkTheme);
style.Set(ControlProperty.BorderColor, Color.FromHex("#C3C3C3"), ControlState.LightTheme);
style.Set(ControlProperty.BorderThickness, new Thickness(1));
return style;
}
public static Style CreateCommonBorderStyle()
{
var style = new Style();
style.Set(ControlProperty.BorderColor, GetColorWithOpacity(Color.FromHex("#FFFFFF"), 0.12m), ControlState.DarkTheme);
style.Set(ControlProperty.BorderColor, GetColorWithOpacity(Color.FromHex("#000000"), 0.12m), ControlState.LightTheme);
return style;
}
public static Style CreateHeaderStyle()
{
var style = new Style();
style.Set(ControlProperty.ForegroundColor, GetColorWithOpacity("#FFFFFF", 0.70m), ControlState.DarkTheme);
style.Set(ControlProperty.ForegroundColor, GetColorWithOpacity("#000000", 0.65m), ControlState.LightTheme);
return style;
}
public static Style CreateInputStyle()
{
var style = new Style(DefaultStyles.TextBoxStyle);
style.Set(ControlProperty.BackgroundColor, Color.FromHex("#1A1A1A"), ControlState.DarkTheme);
style.Set(ControlProperty.BackgroundColor, Color.FromHex("#111111"), ControlState.DarkTheme | ControlState.Hover);
style.Set(ControlProperty.BackgroundColor, Color.FromHex("#E7EBED"), ControlState.LightTheme);
style.Set(ControlProperty.BackgroundColor, Color.FromHex("#D6DADC"), ControlState.LightTheme | ControlState.Hover);
style.Set(ControlProperty.CornerRadius, 3);
return style;
}
public static Style CreateBuyButtonStyle()
{
return CreateButtonStyle(Color.FromHex("#009345"), Color.FromHex("#10A651"));
}
public static Style CreateSellButtonStyle()
{
return CreateButtonStyle(Color.FromHex("#F05824"), Color.FromHex("#FF6C36"));
}
public static Style CreateCloseButtonStyle()
{
return CreateButtonStyle(Color.FromHex("#F05824"), Color.FromHex("#FF6C36"));
}
private static Style CreateButtonStyle(Color color, Color hoverColor)
{
var style = new Style(DefaultStyles.ButtonStyle);
style.Set(ControlProperty.BackgroundColor, color, ControlState.DarkTheme);
style.Set(ControlProperty.BackgroundColor, color, ControlState.LightTheme);
style.Set(ControlProperty.BackgroundColor, hoverColor, ControlState.DarkTheme | ControlState.Hover);
style.Set(ControlProperty.BackgroundColor, hoverColor, ControlState.LightTheme | ControlState.Hover);
style.Set(ControlProperty.ForegroundColor, Color.FromHex("#FFFFFF"), ControlState.DarkTheme);
style.Set(ControlProperty.ForegroundColor, Color.FromHex("#FFFFFF"), ControlState.LightTheme);
return style;
}
private static Color GetColorWithOpacity(Color baseColor, decimal opacity)
{
var alpha = (int)Math.Round(byte.MaxValue * opacity, MidpointRounding.AwayFromZero);
return Color.FromArgb(alpha, baseColor);
}
}
}
@tuuguu177
tuuguu177
10 Nov 2024, 14:30
RE: lock buy sell button
PanagiotisCharalampous said:
Hi there,
Add
using System.Linq;in the namespaces you use
Best regards,
Panagiotis
Could you please provide code of if live profit is greater than -10% then it disables trade button?
@tuuguu177
tuuguu177
10 Nov 2024, 14:22
RE: lock buy sell button
PanagiotisCharalampous said:
Hi there,
Add
using System.Linq;in the namespaces you use
Best regards,
Panagiotis
I put it but it did not work
@tuuguu177
tuuguu177
04 Sep 2024, 12:06
RE: RE: RE: Very simple issue
PanagiotisCharalampous said:
tuuguu177 said:
PanagiotisCharalampous said:
Hi there,
No this is not possible at the moment.
Best regards,
Panagiotis
Hello
How to make line into transparent at coding?
Hi there,
You need to set make your line's color transparent by setting the alpha to 0. See below
var color = Color.FromArgb(0,255,0,0);Best regards,
Panagiotis
Color.FromArgb(0,255,0,0)
Is 4th transparency value? I changed 4th value with 0 and 90. But there is not any change of line transparency
@tuuguu177
tuuguu177
03 Sep 2024, 13:24
RE: Very simple issue
PanagiotisCharalampous said:
Hi there,
No this is not possible at the moment.
Best regards,
Panagiotis
Hello
How to make line into transparent at coding?
@tuuguu177
tuuguu177
03 Sep 2024, 13:23
RE: Very simple issue
PanagiotisCharalampous said:
Hi there,
No this is not possible at the moment.
Best regards,
Panagiotis
Hello
How to make line into transparent at coding?
@tuuguu177
tuuguu177
25 Jul 2024, 06:09
RE: RE: RE: RE: RE: RE: RE: how to extend trendline to right?
PanagiotisCharalampous said:
tuuguu177 said:
PanagiotisCharalampous said:
tuuguu177 said:
PanagiotisCharalampous said:
tuuguu177 said:
PanagiotisCharalampous said:
Hi there,
I added the indicator on a chart but I see no error. Can you please explain what error do you get and how we can reproduce it?
Best regards,
Panagiotis
are you there?
You did not answer my question therefore I am not able to help you further at the moment.
This error occurred. I only want extend trend lines. That is all. I can not find right structure of extended trend line codes.
Please share the code that reproduces these error messages
Code is:
using System;
using cAlgo.API;
using cAlgo.API.Internals;
using cAlgo.API.Indicators;
using cAlgo.Indicators;
using System.Collections.Generic;
#pragma warning disable
namespace cAlgo.Indicators
{
[Indicator(IsOverlay = true, AccessRights = AccessRights.None)]
public class LinearRegressionChannel : Indicator
{
[Parameter("Projection Length", DefaultValue = 0)]
public int ProjLength { get; set; }
[Parameter("Center", DefaultValue = true)]
public bool ShowCenter { get; set; }
[Parameter("Channel", DefaultValue = true)]
public bool ShowChannel { get; set; }
[Parameter("Standard deviation", DefaultValue = true)]
public bool ShowDeviantion { get; set; }
public Dictionary<string, LR> LRs = new Dictionary<string, LR>();
protected override void Initialize()
{
///Add the button in the topleft corner
Border border = new Border
{
VerticalAlignment = VerticalAlignment.Top,
HorizontalAlignment = HorizontalAlignment.Right,
Margin = "20 40 20 20",
Width = 50,
Child = new Toolbar(this)
};
Chart.AddControl(border);
///Events for calculating and drawing
Chart.ObjectUpdated += OnChartObjectUpdated;
Chart.ObjectRemoved += OnChartObjectRemoved;
foreach (ChartObject o in Chart.Objects)
if (o.Name.Length > 24 && o.Name.Substring(0, 24) == "LinearRegressionChannel " && o.IsInteractive && o.ObjectType == ChartObjectType.TrendLine)
{
LRs.Add(o.Name, new LR((ChartTrendLine)o));
o.IsInteractive = false;
o.IsInteractive = true;
}
}
void OnChartObjectRemoved(ChartObjectRemovedEventArgs obj)
{
try
{
if (IsCleaning)
return;
RemoveAllObjectsConnectedWith(obj.ChartObject);
if (LRs.ContainsKey(obj.ChartObject.Name))
LRs.Remove(obj.ChartObject.Name);
} catch (Exception e)
{
Print(e);
Print("Errore nella rimozione dell'oggetto");
}
}
bool IsCleaning = false;
void RemoveAllObjectsConnectedWith(ChartObject o)
{
if (LRs.ContainsKey(o.Name))
{
IsCleaning = true;
for (int i = 0; i < LRs[o.Name].Children.Count; ++i)
{
try
{
Chart.RemoveObject(LRs[o.Name].Children[i].Name);
} catch (Exception e)
{
Print(e);
continue;
}
}
}
LRs[o.Name].Children.Clear();
IsCleaning = false;
}
public override void Calculate(int index)
{
}
void OnChartObjectUpdated(ChartObjectUpdatedEventArgs obj)
{
try
{
RemoveAllObjectsConnectedWith(obj.ChartObject);
///Check if object is a rectangle and if it's part of this indicator
if (!LRs.ContainsKey(obj.ChartObject.Name))
return;
ChartTrendLine lr = (ChartTrendLine)obj.ChartObject;
// Linear regresion
double sum_x = 0, sum_x2 = 0, sum_y = 0, sum_xy = 0, x_avg=0, x=0,x_sum_squared=0,stdDeviation=0;
int start = Bars.OpenTimes.GetIndexByTime(lr.Time1);
int end = Bars.OpenTimes.GetIndexByTime(lr.Time2);
int length = Math.Abs(end - start);
if (start > end)
{
start = Bars.OpenTimes.GetIndexByTime(lr.Time2);
end = Bars.OpenTimes.GetIndexByTime(lr.Time1);
}
for (int i = start; i < end; i++)
{
sum_x += 1.0 * i;
sum_x2 += 1.0 * i * i;
sum_y += Bars[i].Close;
sum_xy += Bars[i].Close * i;
}
double a = (length * sum_xy - sum_x * sum_y) / (length * sum_x2 - sum_x * sum_x);
double b = (sum_y - a * sum_x) / length;
// Calculate maximum and standard devaitions
double maxUpperDeviation = 0, maxLowerDeviation = 0;
double sumDevation = 0;
for (int i = start; i < end; i++)
{
double price = a * i + b;
x = Math.Abs(Bars[i].Close - price);
x_avg=(x_avg+x)/i;
x_sum_squared += (x - x_avg) * (x - x_avg);
maxUpperDeviation = Math.Max(Bars[i].Close - price, maxUpperDeviation);
maxLowerDeviation = Math.Min(Bars[i].Close - price, maxLowerDeviation);
stdDeviation=Math.Sqrt(x_sum_squared/(length - 1));
}
//double stdDeviation = Math.Sqrt(sumDevation / (length - 1));
// draw in future
//end += (int)(length * 0.01 * ProjLength);
double pr1 = a * start + b;
double pr2 = a * end + b;
if (ShowCenter)
{
//LRs[lr.Name].Children.Add(Chart.DrawTrendLine("Center " + lr.Name, start, pr1, end, pr2, Color.Blue, 1, LineStyle.DotsRare));
var line LRs[lr.Name].Children.Add(Chart.DrawTrendLine("Center " + lr.Name, start, pr1, end, pr2, Color.Blue, 1, LineStyle.DotsRare));
line .ExtendToInfinity = true;
}
if (ShowChannel)
{
LRs[lr.Name].Children.Add(Chart.DrawTrendLine("Top " + lr.Name, start, pr1 + stdDeviation*2, end, pr2 + stdDeviation*2, Color.Blue, 1, LineStyle.DotsRare));
LRs[lr.Name].Children.Add(Chart.DrawTrendLine("Bottom " + lr.Name, start, pr1 - stdDeviation*2, end, pr2 - stdDeviation*2, Color.Blue, 1, LineStyle.DotsRare));
}
if (ShowDeviantion)
{
LRs[lr.Name].Children.Add(Chart.DrawTrendLine("Dev-Top " + lr.Name, start, pr1 + stdDeviation, end, pr2 + stdDeviation, Color.Blue, 1, LineStyle.DotsRare));
LRs[lr.Name].Children.Add(Chart.DrawTrendLine("Dev-Bottom " + lr.Name, start, pr1 - stdDeviation, end, pr2 - stdDeviation, Color.Blue, 1, LineStyle.DotsRare));
}
} catch (Exception)
{
}
}
}
public class Toolbar : CustomControl
{
LinearRegressionChannel LR;
public Toolbar(LinearRegressionChannel lr)
{
LR = lr;
var AddButton = new Button
{
Text = "Add",
Style = new Style(DefaultStyles.ButtonStyle),
Height = 25
};
AddButton.Click += AddArea;
AddChild(AddButton);
}
void AddArea(ButtonClickEventArgs e)
{
double Y = (LR.Chart.TopY - LR.Chart.BottomY) * 0.6 + LR.Chart.BottomY;
string name = "LinearRegressionChannel " + LR.Time;
LR.LRs.Add(name, new LR(LR.Chart.DrawTrendLine(name, LR.Chart.LastVisibleBarIndex - 2, Y, (int)(LR.Chart.LastVisibleBarIndex - (LR.Chart.LastVisibleBarIndex - LR.Chart.FirstVisibleBarIndex) * 0.2), Y, Color.DarkSlateGray)));
LR.LRs[name].Parent.IsInteractive = true;
}
}
public class LR
{
public ChartTrendLine Parent;
public List<ChartTrendLine> Children = new List<ChartTrendLine>();
public LR(ChartTrendLine cr)
{
Parent = cr;
}
}
}Your problem is this line of code. This is not correct C#
var line LRs[lr.Name].Children.Add(Chart.DrawTrendLine("Center " + lr.Name, start, pr1, end, pr2, Color.Blue, 1, LineStyle.DotsRare));Maybe you are trying to do this?
var line = Chart.DrawTrendLine("Center " + lr.Name, start, pr1, end, pr2, Color.Blue, 1, LineStyle.DotsRare); line .ExtendToInfinity = true; LRs[lr.Name].Children.Add(line);
OMG it is working :-), Thank you very much my friend.
@tuuguu177
tuuguu177
24 Jul 2024, 11:05
RE: RE: RE: RE: RE: how to extend trendline to right?
PanagiotisCharalampous said:
tuuguu177 said:
PanagiotisCharalampous said:
tuuguu177 said:
PanagiotisCharalampous said:
Hi there,
I added the indicator on a chart but I see no error. Can you please explain what error do you get and how we can reproduce it?
Best regards,
Panagiotis
are you there?
You did not answer my question therefore I am not able to help you further at the moment.
This error occurred. I only want extend trend lines. That is all. I can not find right structure of extended trend line codes.
Please share the code that reproduces these error messages
Code is:
using System;
using cAlgo.API;
using cAlgo.API.Internals;
using cAlgo.API.Indicators;
using cAlgo.Indicators;
using System.Collections.Generic;
#pragma warning disable
namespace cAlgo.Indicators
{
[Indicator(IsOverlay = true, AccessRights = AccessRights.None)]
public class LinearRegressionChannel : Indicator
{
[Parameter("Projection Length", DefaultValue = 0)]
public int ProjLength { get; set; }
[Parameter("Center", DefaultValue = true)]
public bool ShowCenter { get; set; }
[Parameter("Channel", DefaultValue = true)]
public bool ShowChannel { get; set; }
[Parameter("Standard deviation", DefaultValue = true)]
public bool ShowDeviantion { get; set; }
public Dictionary<string, LR> LRs = new Dictionary<string, LR>();
protected override void Initialize()
{
///Add the button in the topleft corner
Border border = new Border
{
VerticalAlignment = VerticalAlignment.Top,
HorizontalAlignment = HorizontalAlignment.Right,
Margin = "20 40 20 20",
Width = 50,
Child = new Toolbar(this)
};
Chart.AddControl(border);
///Events for calculating and drawing
Chart.ObjectUpdated += OnChartObjectUpdated;
Chart.ObjectRemoved += OnChartObjectRemoved;
foreach (ChartObject o in Chart.Objects)
if (o.Name.Length > 24 && o.Name.Substring(0, 24) == "LinearRegressionChannel " && o.IsInteractive && o.ObjectType == ChartObjectType.TrendLine)
{
LRs.Add(o.Name, new LR((ChartTrendLine)o));
o.IsInteractive = false;
o.IsInteractive = true;
}
}
void OnChartObjectRemoved(ChartObjectRemovedEventArgs obj)
{
try
{
if (IsCleaning)
return;
RemoveAllObjectsConnectedWith(obj.ChartObject);
if (LRs.ContainsKey(obj.ChartObject.Name))
LRs.Remove(obj.ChartObject.Name);
} catch (Exception e)
{
Print(e);
Print("Errore nella rimozione dell'oggetto");
}
}
bool IsCleaning = false;
void RemoveAllObjectsConnectedWith(ChartObject o)
{
if (LRs.ContainsKey(o.Name))
{
IsCleaning = true;
for (int i = 0; i < LRs[o.Name].Children.Count; ++i)
{
try
{
Chart.RemoveObject(LRs[o.Name].Children[i].Name);
} catch (Exception e)
{
Print(e);
continue;
}
}
}
LRs[o.Name].Children.Clear();
IsCleaning = false;
}
public override void Calculate(int index)
{
}
void OnChartObjectUpdated(ChartObjectUpdatedEventArgs obj)
{
try
{
RemoveAllObjectsConnectedWith(obj.ChartObject);
///Check if object is a rectangle and if it's part of this indicator
if (!LRs.ContainsKey(obj.ChartObject.Name))
return;
ChartTrendLine lr = (ChartTrendLine)obj.ChartObject;
// Linear regresion
double sum_x = 0, sum_x2 = 0, sum_y = 0, sum_xy = 0, x_avg=0, x=0,x_sum_squared=0,stdDeviation=0;
int start = Bars.OpenTimes.GetIndexByTime(lr.Time1);
int end = Bars.OpenTimes.GetIndexByTime(lr.Time2);
int length = Math.Abs(end - start);
if (start > end)
{
start = Bars.OpenTimes.GetIndexByTime(lr.Time2);
end = Bars.OpenTimes.GetIndexByTime(lr.Time1);
}
for (int i = start; i < end; i++)
{
sum_x += 1.0 * i;
sum_x2 += 1.0 * i * i;
sum_y += Bars[i].Close;
sum_xy += Bars[i].Close * i;
}
double a = (length * sum_xy - sum_x * sum_y) / (length * sum_x2 - sum_x * sum_x);
double b = (sum_y - a * sum_x) / length;
// Calculate maximum and standard devaitions
double maxUpperDeviation = 0, maxLowerDeviation = 0;
double sumDevation = 0;
for (int i = start; i < end; i++)
{
double price = a * i + b;
x = Math.Abs(Bars[i].Close - price);
x_avg=(x_avg+x)/i;
x_sum_squared += (x - x_avg) * (x - x_avg);
maxUpperDeviation = Math.Max(Bars[i].Close - price, maxUpperDeviation);
maxLowerDeviation = Math.Min(Bars[i].Close - price, maxLowerDeviation);
stdDeviation=Math.Sqrt(x_sum_squared/(length - 1));
}
//double stdDeviation = Math.Sqrt(sumDevation / (length - 1));
// draw in future
//end += (int)(length * 0.01 * ProjLength);
double pr1 = a * start + b;
double pr2 = a * end + b;
if (ShowCenter)
{
//LRs[lr.Name].Children.Add(Chart.DrawTrendLine("Center " + lr.Name, start, pr1, end, pr2, Color.Blue, 1, LineStyle.DotsRare));
var line LRs[lr.Name].Children.Add(Chart.DrawTrendLine("Center " + lr.Name, start, pr1, end, pr2, Color.Blue, 1, LineStyle.DotsRare));
line .ExtendToInfinity = true;
}
if (ShowChannel)
{
LRs[lr.Name].Children.Add(Chart.DrawTrendLine("Top " + lr.Name, start, pr1 + stdDeviation*2, end, pr2 + stdDeviation*2, Color.Blue, 1, LineStyle.DotsRare));
LRs[lr.Name].Children.Add(Chart.DrawTrendLine("Bottom " + lr.Name, start, pr1 - stdDeviation*2, end, pr2 - stdDeviation*2, Color.Blue, 1, LineStyle.DotsRare));
}
if (ShowDeviantion)
{
LRs[lr.Name].Children.Add(Chart.DrawTrendLine("Dev-Top " + lr.Name, start, pr1 + stdDeviation, end, pr2 + stdDeviation, Color.Blue, 1, LineStyle.DotsRare));
LRs[lr.Name].Children.Add(Chart.DrawTrendLine("Dev-Bottom " + lr.Name, start, pr1 - stdDeviation, end, pr2 - stdDeviation, Color.Blue, 1, LineStyle.DotsRare));
}
} catch (Exception)
{
}
}
}
public class Toolbar : CustomControl
{
LinearRegressionChannel LR;
public Toolbar(LinearRegressionChannel lr)
{
LR = lr;
var AddButton = new Button
{
Text = "Add",
Style = new Style(DefaultStyles.ButtonStyle),
Height = 25
};
AddButton.Click += AddArea;
AddChild(AddButton);
}
void AddArea(ButtonClickEventArgs e)
{
double Y = (LR.Chart.TopY - LR.Chart.BottomY) * 0.6 + LR.Chart.BottomY;
string name = "LinearRegressionChannel " + LR.Time;
LR.LRs.Add(name, new LR(LR.Chart.DrawTrendLine(name, LR.Chart.LastVisibleBarIndex - 2, Y, (int)(LR.Chart.LastVisibleBarIndex - (LR.Chart.LastVisibleBarIndex - LR.Chart.FirstVisibleBarIndex) * 0.2), Y, Color.DarkSlateGray)));
LR.LRs[name].Parent.IsInteractive = true;
}
}
public class LR
{
public ChartTrendLine Parent;
public List<ChartTrendLine> Children = new List<ChartTrendLine>();
public LR(ChartTrendLine cr)
{
Parent = cr;
}
}
}
@tuuguu177
tuuguu177
24 Jul 2024, 09:20
RE: RE: RE: how to extend trendline to right?
PanagiotisCharalampous said:
tuuguu177 said:
PanagiotisCharalampous said:
Hi there,
I added the indicator on a chart but I see no error. Can you please explain what error do you get and how we can reproduce it?
Best regards,
Panagiotis
are you there?
You did not answer my question therefore I am not able to help you further at the moment.
This error occurred. I only want extend trend lines. That is all. I can not find right structure of extended trend line codes.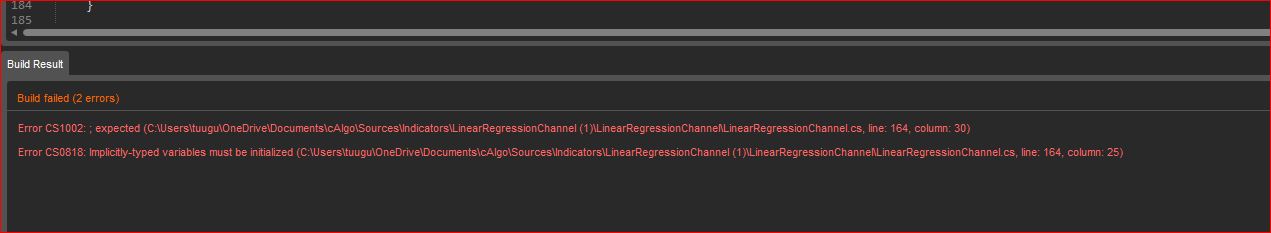
@tuuguu177
tuuguu177
14 Jul 2024, 10:24
RE: how to extend trendline to right?
PanagiotisCharalampous said:
Hi there,
I added the indicator on a chart but I see no error. Can you please explain what error do you get and how we can reproduce it?
Best regards,
Panagiotis
are you there?
@tuuguu177
tuuguu177
14 Jul 2024, 07:09
RE: how to extend trendline to right?
PanagiotisCharalampous said:
Hi there,
I added the indicator on a chart but I see no error. Can you please explain what error do you get and how we can reproduce it?
Best regards,
Panagiotis
Hello, This indicator draws 5 trend lines. I want to draw it with right ray(extension). Now it draws without right ray. I found code(.ExtendToInfinity=true). but it does not work. How to fix it?
Thank you
@tuuguu177
tuuguu177
14 Jul 2024, 03:08
RE: how to move button of close position to right side of window?
PanagiotisCharalampous said:
Hi there,
Can you share a screenshot of the button you are talking about?
Best regards,
Panagiotis
Hi My friend I need your help at one thing? Please read my last message about right ray of trend line?
@tuuguu177
tuuguu177
07 Jul 2024, 16:07
( Updated at: 08 Jul 2024, 04:51 )
RE: solve line slope issue?
firemyst said:
Have you tried looking at the code to any indicators that are already available?
https://ctrader.com/algos/search/indicators?query=linear+regression+channel
Hello, yes of course. I modified one of them. Code looks like big. Do not worry
It has little slope coefficient calculation problem on it. I can not find it.
I attached picture of modified indicator.
Thank you
@tuuguu177
tuuguu177
28 May 2024, 07:36
RE: how to move button of close position to right side of window?
PanagiotisCharalampous said:
Hi there,
Can you share a screenshot of the button you are talking about?
Best regards,
Panagiotis
thank very much my friend i found it
@tuuguu177
tuuguu177
23 May 2024, 12:17
( Updated at: 23 May 2024, 12:59 )
RE: How to create dynamic horizontal line
ncel01 said:
Hello,
You should call Chart.DrawHorizontalLine() inside Calculate() and use the current price (Symbol.Bid or Symbol.Ask) as reference. See below.
I hope it helps.
using cAlgo.API;namespace cAlgo{ [Indicator(AccessRights = AccessRights.None)] public class dynamic_HLine : Indicator { protected override void Initialize() { } public override void Calculate(int index) { var distanceInPips = 200; var highPrice = Symbol.Bid + distanceInPips * Symbol.PipSize; var lowPrice = Symbol.Bid - distanceInPips * Symbol.PipSize; Chart.DrawHorizontalLine("horizontalLineAbove", highPrice, Color.Blue); Chart.DrawHorizontalLine("horizontalLineBelow", lowPrice, Color.Red); } }}
OH, hello thank you thank you I love you bro
@tuuguu177
tuuguu177
23 Dec 2024, 10:36
RE: lock trade button
PanagiotisCharalampous said:
I think it is possible at coding. For example only drawdown below certain level it possible to trade command.
This is very simply coding i think. But can not do it myself
Thank you
@tuuguu177