Topics
Replies
mihlali700
21 Feb 2024, 08:19
RE: RE: Does Bars.ClosePrices give me the actual close price of a bar ?
mihlali700 said:
PanagiotisCharalampous said:
Hi there,
As far as I can see, the trade was taken three bars ago. Therefore these are the bars you should be looking at
I have been changing the code and testing it in the back tester and as far as I can tell for some reason the trades are entered late after the pattern has appeared and I'm not understanding why .
Even just using this code :
// returns true if bullish pullback
private bool IsBullishPullBack() {
double AClose4 = Bars.ClosePrices.Last(4);
double AClose3 = Bars.ClosePrices.Last(3);
double ALow3 = Bars.LowPrices.Last(3);
double AOpen3 = Bars.OpenPrices.Last(3);
double AOpen2 = Bars.OpenPrices.Last(2);
double AClose2 = Bars.ClosePrices.Last(2);
double AOpen1 = Bars.OpenPrices.Last(1);
double AClose1 = Bars.ClosePrices.Last(1);
if (
(AClose3 < AClose4) &&
(AClose3 < AOpen2 && AOpen2 > ALow3 && AClose2 >= AOpen3 ) &&
AOpen1 >= AOpen2 && AClose1 >=AClose2
)
{
return false;
}
return true;
}
And nothing else when looking to open trades it still enters the trades late
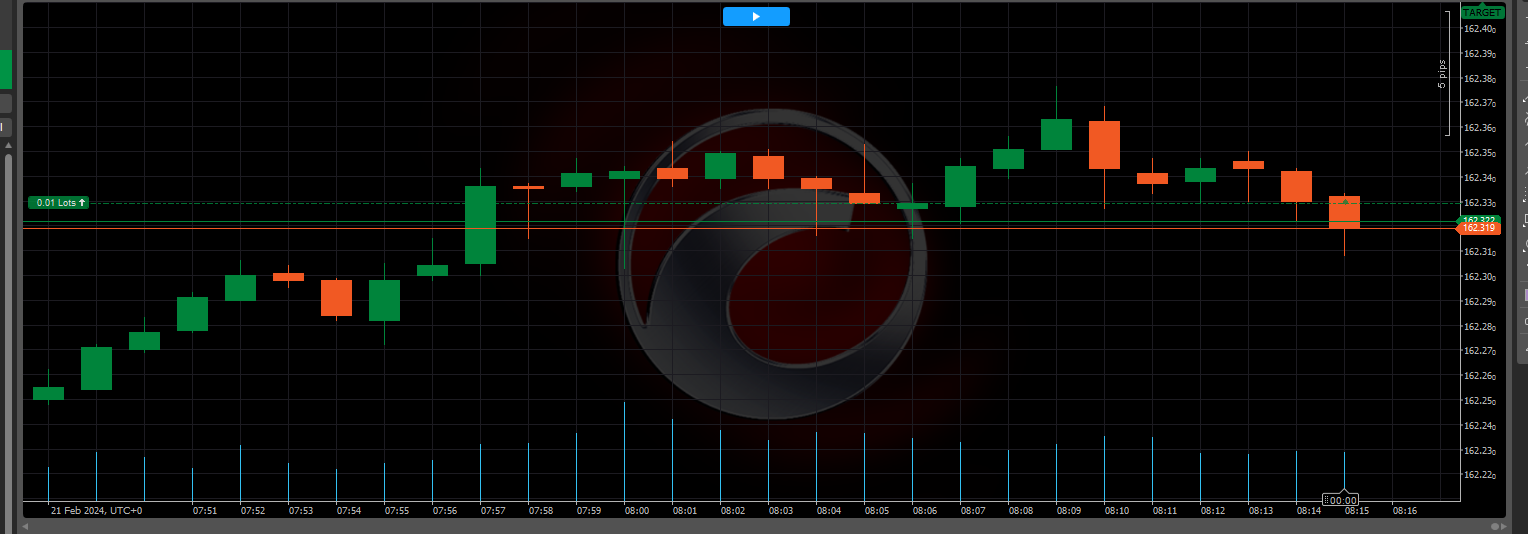
Here is an example on the live market , why did it take this trade ? I don't understand cause the pattern isn't there . Whats going on ? This order was made on 8:15 so I know that the pattern isn't there during that time and that its not possible for it to be an old oder.
@mihlali700
mihlali700
21 Feb 2024, 08:04
RE: Does Bars.ClosePrices give me the actual close price of a bar ?
PanagiotisCharalampous said:
Hi there,
As far as I can see, the trade was taken three bars ago. Therefore these are the bars you should be looking at
I have been changing the code and testing it in the back tester and as far as I can tell for some reason the trades are entered late after the pattern has appeared and I'm not understanding why .
Even just using this code :
// returns true if bullish pullback
private bool IsBullishPullBack() {
double AClose4 = Bars.ClosePrices.Last(4);
double AClose3 = Bars.ClosePrices.Last(3);
double ALow3 = Bars.LowPrices.Last(3);
double AOpen3 = Bars.OpenPrices.Last(3);
double AOpen2 = Bars.OpenPrices.Last(2);
double AClose2 = Bars.ClosePrices.Last(2);
double AOpen1 = Bars.OpenPrices.Last(1);
double AClose1 = Bars.ClosePrices.Last(1);
if (
(AClose3 < AClose4) &&
(AClose3 < AOpen2 && AOpen2 > ALow3 && AClose2 >= AOpen3 ) &&
AOpen1 >= AOpen2 && AClose1 >=AClose2
)
{
return false;
}
return true;
}
And nothing else when looking to open trades it still enters the trades late
@mihlali700
mihlali700
21 Feb 2024, 04:01
RE: Does Bars.ClosePrices give me the actual close price of a bar ?
firemyst said:
I don't understand what you're saying. Read that sentence outloud to yourself, especially the italics part:
“You can see here although in the code the close of bar 2 should be greater than or equal to the open of bar 3 but in this pic its tell yet the Bot still took the trade .”
In the screen capture you provided, the close of 2 bars back is greater than the close of the 3rd bar back from the current bar.
Not the close price the open price , the close of 2 bars back should be greater or equal to the open of the third bar back.
Its in the code :
if (
(AClose3 < AClose4) &&
(AClose3 < AOpen2 && AOpen2 > ALow3 && AClose2 >= AOpen3 ) &&
AOpen1 >= AOpen2
)
“ Aclose2 > = Aopen3” This isn't true yet the bot still took the trade and i don't know why.
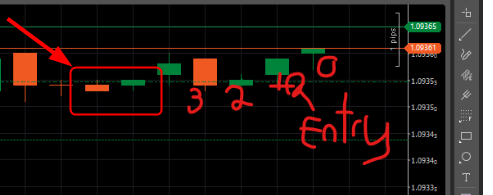
The point is to find this pattern : 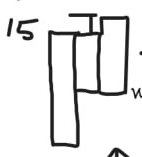
@mihlali700
mihlali700
29 Jan 2024, 12:58
RE: Modify Positions is modiying takeprofit when it shouldn't
ctrader.guru said:
Try changing in the foreach statement the return; with the continue;
The Trailing stop is working, what im trying to figure out is why I get a stop loss thats more than 1k pips away .
@mihlali700
mihlali700
22 Jan 2024, 07:49
RE: How to get OHLC prices of different timeframes in a CBOT
PanagiotisCharalampous said:
Hi there,
Can you explain clearly what are you trying to do and why do you thing the result is wrong?
Best regards,
Panagiotis
I want to get the Open,Close,High,Low prices of bars from different timeframes .
@mihlali700
mihlali700
18 Jan 2024, 14:48
RE: IsLastBar is not working correctly
Leonardo.Ciaccio said:
I have already given you the solution; I have written you a complete and working indicator.
Oh , thank you
@mihlali700
mihlali700
18 Jan 2024, 14:48
RE: IsLastBar is not working correctly
Leonardo.Ciaccio said:
I have already given you the solution; I have written you a complete and working indicator.
Oh , thank you
@mihlali700
mihlali700
18 Jan 2024, 14:17
RE: IsLastBar is not working correctly
Leonardo.Ciaccio said:
It is not clear what you want to achieve, but I would make a distinction between indicators and cbot, indicators do not have OnBar() event, let's try this approach with an indicator:
using System;using cAlgo.API;using cAlgo.API.Internals;namespace cAlgo{ [Indicator(AccessRights = AccessRights.None)] public class SPAlerts : Indicator { Bars BarsDaily; double AlertPips; int lastIndex; protected override void Initialize() { BarsDaily = MarketData.GetBars(TimeFrame.Daily); AlertPips = 0.5; lastIndex = -1; } public override void Calculate(int index) { // cbot have OnBar event indicators no if (index != lastIndex) { lastIndex = index; OnBar(index); } } private void StandardPivotAlerts(int index) { // If it is not the last bar I will not display any alert if (!IsLastBar) return; var barsDailyIndex = BarsDaily.OpenTimes.GetIndexByTime(Bars.OpenTimes[index]); // Calculate pivot points for the current day double HighValue = BarsDaily.HighPrices[barsDailyIndex]; double LowValue = BarsDaily.LowPrices[barsDailyIndex]; double CloseValue = BarsDaily.ClosePrices[barsDailyIndex]; double PPValue = (HighValue + LowValue + CloseValue) / 3; double S1Value = (PPValue * 2) - HighValue; double S2Value = PPValue - (HighValue - LowValue); double S3Value = LowValue - 2 * (HighValue - PPValue); double R1Value = (PPValue * 2) - LowValue; double R2Value = PPValue + (HighValue - LowValue); double R3Value = HighValue + 2 * (PPValue - LowValue); var currentprice = Bars.ClosePrices[index - 1]; var PPPips = Math.Abs((currentprice - PPValue) / Symbol.PipSize); var S1Pips = Math.Abs((currentprice - S1Value) / Symbol.PipSize); var S2Pips = Math.Abs((currentprice - S2Value) / Symbol.PipSize); var S3Pips = Math.Abs((currentprice - S3Value) / Symbol.PipSize); var R1Pips = Math.Abs((currentprice - R1Value) / Symbol.PipSize); var R2Pips = Math.Abs((currentprice - R2Value) / Symbol.PipSize); var R3Pips = Math.Abs((currentprice - R3Value) / Symbol.PipSize); if (S1Pips <= AlertPips && currentprice > S1Value) { Notify("Price Is Close to S1"); } if (S2Pips <= AlertPips && currentprice > S2Value) { Notify("Price Is Close to S2"); } if (S3Pips <= AlertPips && currentprice > S3Value) { Notify("Price Is Close to S3"); } if (R1Pips <= AlertPips && currentprice < R1Value) { Notify("Price Is Close to R1"); } if (R2Pips <= AlertPips && currentprice < R2Value) { Notify("Price Is Close to R2"); } if (R3Pips <= AlertPips && currentprice < R3Value) { Notify("Price Is Close to R3"); } } private void OnBar(int index) { // Remember, you may be on a different timeframe than daily, such as 5 minutes // so you have to manage it StandardPivotAlerts(index); } private void Notify(string message) { // TODO } }}
I posted this thread in the indicator section so I assumed everyone would know I was talking about an indicator but yes this is indicator code meant to run in an indicator and not a Cbot. As someone already mentioned in this thread isLastBar doesn't stop the code from running every tick but I want the code to run once every new bar.
Is there a reference I can call that will give me the current time of the current bar. Something like iTime from mql4/5 so that I can just translate this to ctrader // Returns true if the first call after a new bar opened bool NewBar () { datetime currentTime = iTime(Symbol(), Period(), 0); static datetime previousTime = 0; // set to currentTime to avoid processing on current bar on start if (currentTime == previousTime) return (false); previousTime = currentTime; return (true) ; }
@mihlali700
mihlali700
18 Jan 2024, 14:07
RE: IsLastBar is not working correctly
PanagiotisCharalampous said:
Hi there,
IsLastBar is just a boolean indicating if the Calculate() method is executing on the last bar of the chart. Calculate() is called once for every historical bar and on every tick for the current bar.
Best regards,
Panagiotis
I am looking for a way to have it called once every single new bar , having this called every tick of the current bar means I'm going to be notified every single second and I don't want that.
@mihlali700
mihlali700
08 Jan 2024, 08:04
RE: RE: RE: Why does printing this give me random number ?
PanagiotisCharalampous said:
mihlali700 said:
PanagiotisCharalampous said:
Hi again,
The values you provided are not for each tick but for each bar since the Calculate() method is called for every bar for historical bars. At the moment I see nothing wrong.
Best regards,
Panagiotis
I just want the value of just 1 bar , that either being the current or previous , how do I achieve that ?
Hi there,
I am a bit confused about what the issue is now. You said that the values do not make sense to you but they seem to make sense to. I have ask for an explanation of what exact value would you expect instead of the ones you see printed and how that value is calculated but you did not provide it (e.g. the value printed at 12:00 is 1 but I would expect it to be 2 because a, b, c….). It is hard to help you further without this information.
Best regards,
Panagiotis
When I run this :
var currentprice = Bars.ClosePrices[index-1];
I just expect to get the value of the currentprice or the price of the bar before that but as you are saying its giving me the value of every single bar starting from bar 1 , I don't want that , I just want the price of the previous bar so that I can minus it with Something Like S1 and get a pip value which is the distance between the current price and S1
@mihlali700
mihlali700
06 Jan 2024, 10:26
RE: Why does printing this give me random number ?
PanagiotisCharalampous said:
Hi again,
The values you provided are not for each tick but for each bar since the Calculate() method is called for every bar for historical bars. At the moment I see nothing wrong.
Best regards,
Panagiotis
I just want the value of just 1 bar , that either being the current or previous , how do I achieve that ?
@mihlali700
mihlali700
06 Jan 2024, 08:38
RE: RE: RE: Why does printing this give me random number ?
PanagiotisCharalampous said:
mihlali700 said:
PanagiotisCharalampous said:
Hi there,
The close price changes on every tick therefore it is expected that the results would change. Can you explain to us what your expectation is?
Best regards,
Panagiotis
No I understand why it would be different at every tick but the way its different makes I unusable , I expect the numbers printing to be somewhat close to each other instead they are not, they are widely different with it even printing “NaN”
It's obviously a logical bug on your side but it's hard to tell by a code snippet. We are just guessing. You would need to provide more information in order to get more help. Post at least the following
- The full indicator code
- Screenshots of the values you get.
- The values you would expect to get instead and an explanation why you expect them.
What I'm trying to print out is the difference of pips between two prices , which is PPValue and the currentprice which gives Pppips but since it prints out like this I cant really nail down why theres a huge variance in the values printed 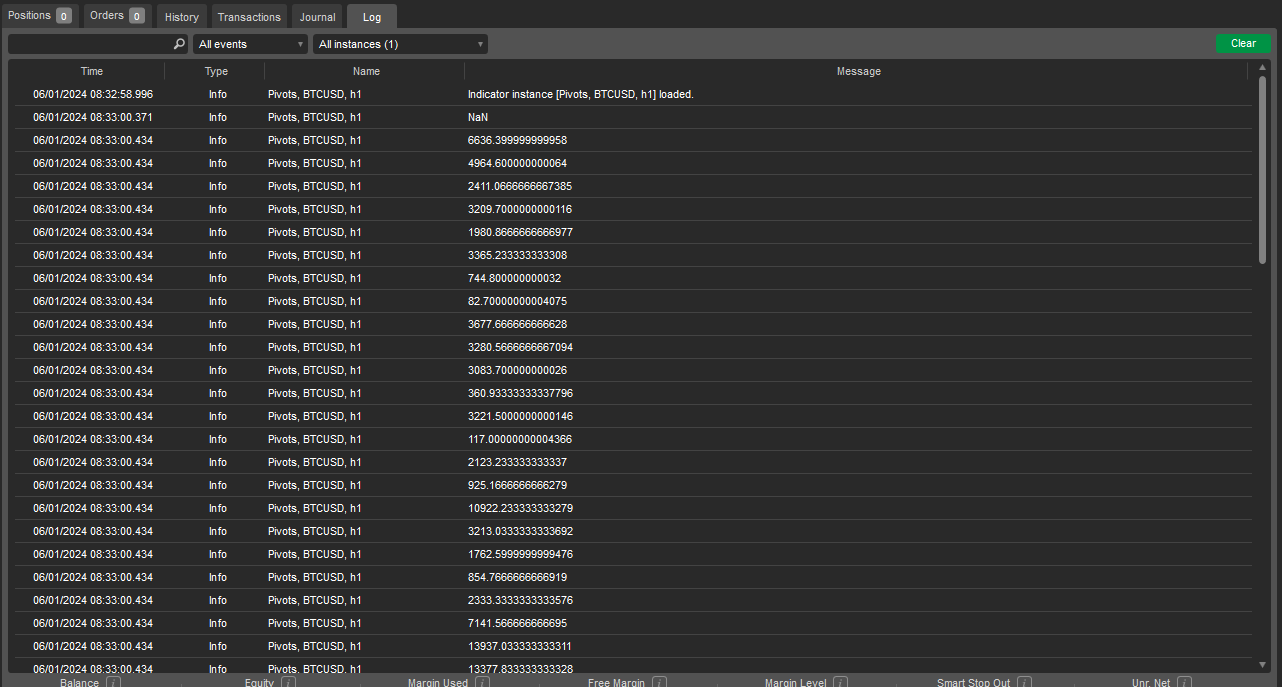
Here is the full code :
namespace cAlgo
{
    [Indicator(IsOverlay = true, TimeZone = TimeZones.UTC, AutoRescale = false, AccessRights = AccessRights.None)]
    public class Pivots : Indicator
    {

        [Parameter(DefaultValue = 10)]
        public int AlertPips { get; set; }

        [Parameter("Pivot Calculation Method", DefaultValue = PivotCalculationMethod.Standard)]
        public PivotCalculationMethod CalculationMethod { get; set; }

        public enum PivotCalculationMethod
        {
        Standard,
        Fibonacci,
        Woodie,
         }

        private Bars BarsDaily;

        protected override void Initialize()
        {

        BarsDaily = MarketData.GetBars(TimeFrame.Daily);

        }

        public override void Calculate(int index)
        {
                switch (CalculationMethod)
                {
                    case PivotCalculationMethod.Standard:
                   //  Standard
                   Standardpivotformula(index);
                    break;
                    case PivotCalculationMethod.Fibonacci:
                    FibonacciPivotformula(index);
                    break;
                    case PivotCalculationMethod.Woodie:
                    // Woodie  forumla
                    WoodiePivotFormula(index);
                    break;
                 }


        }

         private void DrawHorizontalLine(string name, DateTime startTime, double startY, DateTime endTime, double endY, Color color)
        {
            var trendLine = Chart.DrawTrendLine(name, startTime, startY, endTime, endY, color, 2, LineStyle.Solid);
            trendLine.IsInteractive = true;
        }

        private void Standardpivotformula(int index)
        {

          if (Bars.OpenTimes[index].Date != Bars.OpenTimes[index - 1].Date)
            {
                var barsDailyIndex = BarsDaily.OpenTimes.GetIndexByTime(Bars.OpenTimes[index]);
                // Find the start and end of the current day using Bars
                DateTime startOfDay = Bars.OpenTimes[index].Date;
                DateTime endOfDay = startOfDay.AddHours(23).AddMinutes(59).AddSeconds(59);

                // Calculate pivot points for the current day
                double HighValue = BarsDaily.HighPrices[barsDailyIndex];
                double LowValue = BarsDaily.LowPrices[barsDailyIndex];
                double CloseValue = BarsDaily.ClosePrices[barsDailyIndex];

                double PPValue = (HighValue + LowValue + CloseValue) / 3;
                double S1Value = (PPValue * 2) - HighValue;
                double S2Value = PPValue - (HighValue - LowValue);
                double S3Value = LowValue - 2 * (HighValue - PPValue);
                double R1Value = (PPValue * 2) - LowValue;
                double R2Value = PPValue + (HighValue - LowValue);
                double R3Value = HighValue + 2 * (PPValue - LowValue);

                var currentprice = Bars.ClosePrices[index-1];
                var PPPips = Math.Abs((currentprice - PPValue) / Symbol.PipSize);
                var S1Pips = Math.Abs((currentprice - S1Value) / Symbol.PipSize);
                var S2Pips = Math.Abs((currentprice - S2Value) / Symbol.PipSize);
                var S3Pips = Math.Abs((currentprice - S3Value) / Symbol.PipSize);
                var R1Pips = Math.Abs((currentprice - R1Value) / Symbol.PipSize);
                var R2Pips = Math.Abs((currentprice - R2Value) / Symbol.PipSize);
                var R3Pips = Math.Abs((currentprice - R3Value) / Symbol.PipSize);


                Print(PPPips);

                if ( PPPips <= AlertPips ) {

                Print("Price is above or below PPPis");

                }


                // Draw trendlines at pivot levels
                DrawHorizontalLine("PP Line", startOfDay, PPValue, endOfDay, PPValue, Color.Yellow);
                DrawHorizontalLine("S1 Line", startOfDay, S1Value, endOfDay, S1Value, Color.Red);
                DrawHorizontalLine("S2 Line", startOfDay, S2Value, endOfDay, S2Value, Color.Red);
                DrawHorizontalLine("S3 Line", startOfDay, S3Value, endOfDay, S3Value, Color.Red);
                DrawHorizontalLine("R1 Line", startOfDay, R1Value, endOfDay, R1Value, Color.Green);
                DrawHorizontalLine("R2 Line", startOfDay, R2Value, endOfDay, R2Value, Color.Green);
                DrawHorizontalLine("R3 Line", startOfDay, R3Value, endOfDay, R3Value, Color.Green);
            }


        }

        private void WoodiePivotFormula(int index)
        {
          if (Bars.OpenTimes[index].Date != Bars.OpenTimes[index - 1].Date)
            {
                var barsDailyIndex = BarsDaily.OpenTimes.GetIndexByTime(Bars.OpenTimes[index]);
                // Find the start and end of the current day using Bars
                DateTime startOfDay = Bars.OpenTimes[index].Date;
                DateTime endOfDay = startOfDay.AddHours(23).AddMinutes(59).AddSeconds(59);

                // Calculate pivot points for the current day
                double prevHigh = BarsDaily.HighPrices[barsDailyIndex - 1];
                double prevLow = BarsDaily.LowPrices[barsDailyIndex - 1];
                double todayOpen = BarsDaily.OpenPrices[barsDailyIndex];
                double prevRange = prevHigh - prevLow;

                double PPValue = (prevHigh + prevLow + (todayOpen * 2)) / 4;
                double R1Value = (PPValue * 2) - prevLow;
                double R2Value = PPValue + prevRange;
                double S1Value = (PPValue * 2) - prevHigh;
                double S2Value = PPValue - prevRange;
                double S3Value = (prevLow - 2 * (prevHigh - PPValue));
                double S4Value = (S3Value - prevRange);
                double R3Value = (prevHigh + 2 * (PPValue - prevLow));
                double R4Value = (R3Value + prevRange);


                // Draw trendlines at pivot levels
                DrawHorizontalLine("PP Line", startOfDay, PPValue, endOfDay, PPValue, Color.Yellow);
                DrawHorizontalLine("S1 Line", startOfDay, S1Value, endOfDay, S1Value, Color.Red);
                DrawHorizontalLine("S2 Line", startOfDay, S2Value, endOfDay, S2Value, Color.Red);
                DrawHorizontalLine("S3 Line", startOfDay, S3Value, endOfDay, S3Value, Color.Red);
                DrawHorizontalLine("R1 Line", startOfDay, R1Value, endOfDay, R1Value, Color.Green);
                DrawHorizontalLine("R2 Line", startOfDay, R2Value, endOfDay, R2Value, Color.Green);
                DrawHorizontalLine("R3 Line", startOfDay, R3Value, endOfDay, R3Value, Color.Green);
            }

        }


         public void FibonacciPivotformula(int index)
            {
               if (Bars.OpenTimes[index].Date != Bars.OpenTimes[index - 1].Date)
            {
                var barsDailyIndex = BarsDaily.OpenTimes.GetIndexByTime(Bars.OpenTimes[index]);
                double prevHigh = BarsDaily.HighPrices[barsDailyIndex - 1];
                double prevLow = BarsDaily.LowPrices[barsDailyIndex - 1];
                double prevClose = BarsDaily.ClosePrices[barsDailyIndex - 1];
                double prevRange = prevHigh - prevLow;

                double Pivot = (prevHigh + prevLow + prevClose) / 3;
                double R38 = Pivot + (prevRange * 0.382);
                double R61 = Pivot + (prevRange * 0.618);
                double R78 = Pivot + (prevRange * 0.786);
                double R100 = Pivot + (prevRange * 1.000);
                double R138 = Pivot + (prevRange * 1.382);
                double R161 = Pivot + (prevRange * 1.618);
                double R200 = Pivot + (prevRange * 2.000);
                double S38 = Pivot - (prevRange * 0.382);
                double S61 = Pivot - (prevRange * 0.618);
                double S78 = Pivot - (prevRange * 0.786);
                double S100 = Pivot - (prevRange * 1.000);
                double S138 = Pivot - (prevRange * 1.382);
                double S161 = Pivot - (prevRange * 1.618);
                double S200 = Pivot - (prevRange * 2.000);

                DateTime startOfDay = Bars.OpenTimes[index].Date;
                DateTime endOfDay = startOfDay.AddHours(23).AddMinutes(59).AddSeconds(59);

                // Draw trendlines at pivot levels
                DrawHorizontalLine("Pivot Line", startOfDay, Pivot, endOfDay, Pivot, Color.Yellow);
                DrawHorizontalLine("R38 Line", startOfDay, R38, endOfDay, R38, Color.Red);
                DrawHorizontalLine("R61 Line", startOfDay, R61, endOfDay, R61, Color.Red);
                DrawHorizontalLine("R78 Line", startOfDay, R78, endOfDay, R78, Color.Red);
                DrawHorizontalLine("R100 Line", startOfDay, R100, endOfDay, R100, Color.Green);
                DrawHorizontalLine("R138 Line", startOfDay, R138, endOfDay, R138, Color.Green);
                DrawHorizontalLine("R161 Line", startOfDay, R161, endOfDay, R161, Color.Green);
                DrawHorizontalLine("R200 Line", startOfDay, R200, endOfDay, R200, Color.Green);
                DrawHorizontalLine("S38 Line", startOfDay, S38, endOfDay, S38, Color.Red);
                DrawHorizontalLine("S61 Line", startOfDay, S61, endOfDay, S61, Color.Red);
                DrawHorizontalLine("S78 Line", startOfDay, S78, endOfDay, S78, Color.Red);
                DrawHorizontalLine("S100 Line", startOfDay, S100, endOfDay, S100, Color.Blue);
                DrawHorizontalLine("S138 Line", startOfDay, S138, endOfDay, S138, Color.Blue);
                DrawHorizontalLine("S161 Line", startOfDay, S161, endOfDay, S161, Color.Blue);
                DrawHorizontalLine("S200 Line", startOfDay, S200, endOfDay, S200, Color.Blue);
            }


            }

    }
}
@mihlali700
mihlali700
06 Jan 2024, 08:38
RE: RE: RE: Why does printing this give me random number ?
PanagiotisCharalampous said:
mihlali700 said:
PanagiotisCharalampous said:
Hi there,
The close price changes on every tick therefore it is expected that the results would change. Can you explain to us what your expectation is?
Best regards,
Panagiotis
No I understand why it would be different at every tick but the way its different makes I unusable , I expect the numbers printing to be somewhat close to each other instead they are not, they are widely different with it even printing “NaN”
It's obviously a logical bug on your side but it's hard to tell by a code snippet. We are just guessing. You would need to provide more information in order to get more help. Post at least the following
- The full indicator code
- Screenshots of the values you get.
- The values you would expect to get instead and an explanation why you expect them.
What I'm trying to print out is the difference of pips between two prices , which is PPValue and the currentprice which gives Pppips but since it prints out like this I cant really nail down why theres a huge variance in the values printed
Here is the full code :
namespace cAlgo
{
    [Indicator(IsOverlay = true, TimeZone = TimeZones.UTC, AutoRescale = false, AccessRights = AccessRights.None)]
    public class Pivots : Indicator
    {

        [Parameter(DefaultValue = 10)]
        public int AlertPips { get; set; }

        [Parameter("Pivot Calculation Method", DefaultValue = PivotCalculationMethod.Standard)]
        public PivotCalculationMethod CalculationMethod { get; set; }

        public enum PivotCalculationMethod
        {
        Standard,
        Fibonacci,
        Woodie,
         }

        private Bars BarsDaily;

        protected override void Initialize()
        {

        BarsDaily = MarketData.GetBars(TimeFrame.Daily);

        }

        public override void Calculate(int index)
        {
                switch (CalculationMethod)
                {
                    case PivotCalculationMethod.Standard:
                   //  Standard
                   Standardpivotformula(index);
                    break;
                    case PivotCalculationMethod.Fibonacci:
                    FibonacciPivotformula(index);
                    break;
                    case PivotCalculationMethod.Woodie:
                    // Woodie  forumla
                    WoodiePivotFormula(index);
                    break;
                 }


        }

         private void DrawHorizontalLine(string name, DateTime startTime, double startY, DateTime endTime, double endY, Color color)
        {
            var trendLine = Chart.DrawTrendLine(name, startTime, startY, endTime, endY, color, 2, LineStyle.Solid);
            trendLine.IsInteractive = true;
        }

        private void Standardpivotformula(int index)
        {

          if (Bars.OpenTimes[index].Date != Bars.OpenTimes[index - 1].Date)
            {
                var barsDailyIndex = BarsDaily.OpenTimes.GetIndexByTime(Bars.OpenTimes[index]);
                // Find the start and end of the current day using Bars
                DateTime startOfDay = Bars.OpenTimes[index].Date;
                DateTime endOfDay = startOfDay.AddHours(23).AddMinutes(59).AddSeconds(59);

                // Calculate pivot points for the current day
                double HighValue = BarsDaily.HighPrices[barsDailyIndex];
                double LowValue = BarsDaily.LowPrices[barsDailyIndex];
                double CloseValue = BarsDaily.ClosePrices[barsDailyIndex];

                double PPValue = (HighValue + LowValue + CloseValue) / 3;
                double S1Value = (PPValue * 2) - HighValue;
                double S2Value = PPValue - (HighValue - LowValue);
                double S3Value = LowValue - 2 * (HighValue - PPValue);
                double R1Value = (PPValue * 2) - LowValue;
                double R2Value = PPValue + (HighValue - LowValue);
                double R3Value = HighValue + 2 * (PPValue - LowValue);

                var currentprice = Bars.ClosePrices[index-1];
                var PPPips = Math.Abs((currentprice - PPValue) / Symbol.PipSize);
                var S1Pips = Math.Abs((currentprice - S1Value) / Symbol.PipSize);
                var S2Pips = Math.Abs((currentprice - S2Value) / Symbol.PipSize);
                var S3Pips = Math.Abs((currentprice - S3Value) / Symbol.PipSize);
                var R1Pips = Math.Abs((currentprice - R1Value) / Symbol.PipSize);
                var R2Pips = Math.Abs((currentprice - R2Value) / Symbol.PipSize);
                var R3Pips = Math.Abs((currentprice - R3Value) / Symbol.PipSize);


                Print(PPPips);

                if ( PPPips <= AlertPips ) {

                Print("Price is above or below PPPis");

                }


                // Draw trendlines at pivot levels
                DrawHorizontalLine("PP Line", startOfDay, PPValue, endOfDay, PPValue, Color.Yellow);
                DrawHorizontalLine("S1 Line", startOfDay, S1Value, endOfDay, S1Value, Color.Red);
                DrawHorizontalLine("S2 Line", startOfDay, S2Value, endOfDay, S2Value, Color.Red);
                DrawHorizontalLine("S3 Line", startOfDay, S3Value, endOfDay, S3Value, Color.Red);
                DrawHorizontalLine("R1 Line", startOfDay, R1Value, endOfDay, R1Value, Color.Green);
                DrawHorizontalLine("R2 Line", startOfDay, R2Value, endOfDay, R2Value, Color.Green);
                DrawHorizontalLine("R3 Line", startOfDay, R3Value, endOfDay, R3Value, Color.Green);
            }


        }

        private void WoodiePivotFormula(int index)
        {
          if (Bars.OpenTimes[index].Date != Bars.OpenTimes[index - 1].Date)
            {
                var barsDailyIndex = BarsDaily.OpenTimes.GetIndexByTime(Bars.OpenTimes[index]);
                // Find the start and end of the current day using Bars
                DateTime startOfDay = Bars.OpenTimes[index].Date;
                DateTime endOfDay = startOfDay.AddHours(23).AddMinutes(59).AddSeconds(59);

                // Calculate pivot points for the current day
                double prevHigh = BarsDaily.HighPrices[barsDailyIndex - 1];
                double prevLow = BarsDaily.LowPrices[barsDailyIndex - 1];
                double todayOpen = BarsDaily.OpenPrices[barsDailyIndex];
                double prevRange = prevHigh - prevLow;

                double PPValue = (prevHigh + prevLow + (todayOpen * 2)) / 4;
                double R1Value = (PPValue * 2) - prevLow;
                double R2Value = PPValue + prevRange;
                double S1Value = (PPValue * 2) - prevHigh;
                double S2Value = PPValue - prevRange;
                double S3Value = (prevLow - 2 * (prevHigh - PPValue));
                double S4Value = (S3Value - prevRange);
                double R3Value = (prevHigh + 2 * (PPValue - prevLow));
                double R4Value = (R3Value + prevRange);


                // Draw trendlines at pivot levels
                DrawHorizontalLine("PP Line", startOfDay, PPValue, endOfDay, PPValue, Color.Yellow);
                DrawHorizontalLine("S1 Line", startOfDay, S1Value, endOfDay, S1Value, Color.Red);
                DrawHorizontalLine("S2 Line", startOfDay, S2Value, endOfDay, S2Value, Color.Red);
                DrawHorizontalLine("S3 Line", startOfDay, S3Value, endOfDay, S3Value, Color.Red);
                DrawHorizontalLine("R1 Line", startOfDay, R1Value, endOfDay, R1Value, Color.Green);
                DrawHorizontalLine("R2 Line", startOfDay, R2Value, endOfDay, R2Value, Color.Green);
                DrawHorizontalLine("R3 Line", startOfDay, R3Value, endOfDay, R3Value, Color.Green);
            }

        }


         public void FibonacciPivotformula(int index)
            {
               if (Bars.OpenTimes[index].Date != Bars.OpenTimes[index - 1].Date)
            {
                var barsDailyIndex = BarsDaily.OpenTimes.GetIndexByTime(Bars.OpenTimes[index]);
                double prevHigh = BarsDaily.HighPrices[barsDailyIndex - 1];
                double prevLow = BarsDaily.LowPrices[barsDailyIndex - 1];
                double prevClose = BarsDaily.ClosePrices[barsDailyIndex - 1];
                double prevRange = prevHigh - prevLow;

                double Pivot = (prevHigh + prevLow + prevClose) / 3;
                double R38 = Pivot + (prevRange * 0.382);
                double R61 = Pivot + (prevRange * 0.618);
                double R78 = Pivot + (prevRange * 0.786);
                double R100 = Pivot + (prevRange * 1.000);
                double R138 = Pivot + (prevRange * 1.382);
                double R161 = Pivot + (prevRange * 1.618);
                double R200 = Pivot + (prevRange * 2.000);
                double S38 = Pivot - (prevRange * 0.382);
                double S61 = Pivot - (prevRange * 0.618);
                double S78 = Pivot - (prevRange * 0.786);
                double S100 = Pivot - (prevRange * 1.000);
                double S138 = Pivot - (prevRange * 1.382);
                double S161 = Pivot - (prevRange * 1.618);
                double S200 = Pivot - (prevRange * 2.000);

                DateTime startOfDay = Bars.OpenTimes[index].Date;
                DateTime endOfDay = startOfDay.AddHours(23).AddMinutes(59).AddSeconds(59);

                // Draw trendlines at pivot levels
                DrawHorizontalLine("Pivot Line", startOfDay, Pivot, endOfDay, Pivot, Color.Yellow);
                DrawHorizontalLine("R38 Line", startOfDay, R38, endOfDay, R38, Color.Red);
                DrawHorizontalLine("R61 Line", startOfDay, R61, endOfDay, R61, Color.Red);
                DrawHorizontalLine("R78 Line", startOfDay, R78, endOfDay, R78, Color.Red);
                DrawHorizontalLine("R100 Line", startOfDay, R100, endOfDay, R100, Color.Green);
                DrawHorizontalLine("R138 Line", startOfDay, R138, endOfDay, R138, Color.Green);
                DrawHorizontalLine("R161 Line", startOfDay, R161, endOfDay, R161, Color.Green);
                DrawHorizontalLine("R200 Line", startOfDay, R200, endOfDay, R200, Color.Green);
                DrawHorizontalLine("S38 Line", startOfDay, S38, endOfDay, S38, Color.Red);
                DrawHorizontalLine("S61 Line", startOfDay, S61, endOfDay, S61, Color.Red);
                DrawHorizontalLine("S78 Line", startOfDay, S78, endOfDay, S78, Color.Red);
                DrawHorizontalLine("S100 Line", startOfDay, S100, endOfDay, S100, Color.Blue);
                DrawHorizontalLine("S138 Line", startOfDay, S138, endOfDay, S138, Color.Blue);
                DrawHorizontalLine("S161 Line", startOfDay, S161, endOfDay, S161, Color.Blue);
                DrawHorizontalLine("S200 Line", startOfDay, S200, endOfDay, S200, Color.Blue);
            }


            }

    }
}
@mihlali700
mihlali700
05 Mar 2024, 07:06
RE: Run code Once Per new bar
firemyst said:
So its going through the entire index once per bar ?
What if I just want data from the latest index and only starting from that index ? Like I want to print the value of the indicator but only for the latest bar
@mihlali700