Topics
Replies
cortes.br
24 Jul 2024, 11:46
I want to plot on the chart points that represent quantities calculated during the execution of the robot, such as limit and stop prices. I need the ability to draw values on the chart for debugging and visualization purposes. Specifically, I am looking for a function equivalent to PlotTimeSeries found in WealthLab.
PlotTimeSeries
public void PlotTimeSeries(TimeSeries ts, string name, string paneTag, WLColor color = default(WLColor), PlotStyles plotStyle = PlotStyle.Line, bool suppressLabels = false)
Plots a TimeSeries on the chart. The ts parameter is a TimeSeries instance. PlotTimeSeries is useful when plotting the results of mathematical operations on indicators and other TimeSeries. These operations always return instances of the TimeSeries class.
The name parameter should be a descriptive name of the data being plotted. This appears in the pane label.
The paneTag specifies which chart pane to plot the data in. You can specify Price for the price pane, Volume for the volume pane, or some other string value for a custom pane.
The color parameter is optional. If not provided, WealthLab will use a default color.
The plotStyle parameter is also optional, and is a member of the PlotStyle enum. If not specified, WealthLab will use PlotStyle.Line.
The suppressLabels parameter lets you disable to indicator pane labels and the value markers along the chart's right margin for this plot.
@cortes.br
cortes.br
23 Jul 2024, 11:22
( Updated at: 23 Jul 2024, 12:25 )
It worked very well! Thank you. 👌🙌
using System;
using System.Collections.Generic;
using cAlgo.API;
using cAlgo.API.Indicators;
using cAlgo.API.Internals;

namespace cAlgo
{
    [Indicator(AccessRights = AccessRights.None, IsOverlay = true, AutoRescale = false)]
    public class VCM_MovingAverageMultipleTimeframes : Indicator
    {
        private static readonly int NumTimeframes = 4;
        private MovingAverage[] slowMAs = new MovingAverage[NumTimeframes];
        private MovingAverage[] fastMAs = new MovingAverage[NumTimeframes];
        private IndicatorDataSeries[] slowResults = new IndicatorDataSeries[NumTimeframes];
        private IndicatorDataSeries[] fastResults = new IndicatorDataSeries[NumTimeframes];
        private Bars[] timeframes = new Bars[NumTimeframes];
        private int[] barOpenTimeIndices = new int[NumTimeframes];

        //* ----------------------------------- MA1 ---------------------------------- */
        [Parameter("Timeframe 1", DefaultValue = "H1", Group = "Timeframe 1")]
        public TimeFrame Timeframe1 { get; set; }

        [Parameter(
            "Fast MA Type 1",
            DefaultValue = MovingAverageType.Exponential,
            Group = "Timeframe 1"
        )]
        public MovingAverageType MAType1_Fast { get; set; }

        [Parameter(
            "Slow MA Type 1",
            DefaultValue = MovingAverageType.Exponential,
            Group = "Timeframe 1"
        )]
        public MovingAverageType MAType1_Slow { get; set; }

        [Parameter(
            "Fast MA Period 1",
            DefaultValue = 14,
            Group = "Timeframe 1",
            MinValue = 5,
            MaxValue = 50
        )]
        public int MAPeriod1_Fast { get; set; }

        [Parameter(
            "Slow MA Period 1",
            DefaultValue = 28,
            Group = "Timeframe 1",
            MinValue = 10,
            MaxValue = 200,
            Step = 10
        )]
        public int MAPeriod1_Slow { get; set; }

        [Output("MA1 Fast", LineColor = "Blue", Thickness = 1, PlotType = PlotType.Points)]
        public IndicatorDataSeries MA1_Fast { get; set; }

        [Output("MA1 Slow", LineColor = "Blue", Thickness = 1)]
        public IndicatorDataSeries MA1_Slow { get; set; }

        //* ----------------------------------- MA2 ---------------------------------- */
        [Parameter("Timeframe 2", DefaultValue = "H4", Group = "Timeframe 2")]
        public TimeFrame Timeframe2 { get; set; }

        [Parameter(
            "Fast MA Type 2",
            DefaultValue = MovingAverageType.Simple,
            Group = "Timeframe 2"
        )]
        public MovingAverageType MAType2_Fast { get; set; }

        [Parameter(
            "Slow MA Type 2",
            DefaultValue = MovingAverageType.Simple,
            Group = "Timeframe 2"
        )]
        public MovingAverageType MAType2_Slow { get; set; }

        [Parameter(
            "Fast MA Period 2",
            DefaultValue = 14,
            Group = "Timeframe 2",
            MinValue = 5,
            MaxValue = 50
        )]
        public int MAPeriod2_Fast { get; set; }

        [Parameter(
            "Slow MA Period 2",
            DefaultValue = 28,
            Group = "Timeframe 2",
            MinValue = 10,
            MaxValue = 200,
            Step = 10
        )]
        public int MAPeriod2_Slow { get; set; }

        [Output("MA2 Fast", LineColor = "Red", Thickness = 2, PlotType = PlotType.Points)]
        public IndicatorDataSeries MA2_Fast { get; set; }

        [Output("MA2 Slow", LineColor = "Red", Thickness = 2)]
        public IndicatorDataSeries MA2_Slow { get; set; }

        //* ----------------------------------- MA3 ---------------------------------- */
        [Parameter("Timeframe 3", DefaultValue = "D1", Group = "Timeframe 3")]
        public TimeFrame Timeframe3 { get; set; }

        [Parameter(
            "Fast MA Type 3",
            DefaultValue = MovingAverageType.Weighted,
            Group = "Timeframe 3"
        )]
        public MovingAverageType MAType3_Fast { get; set; }

        [Parameter(
            "Slow MA Type 3",
            DefaultValue = MovingAverageType.Weighted,
            Group = "Timeframe 3"
        )]
        public MovingAverageType MAType3_Slow { get; set; }

        [Parameter(
            "Fast MA Period 3",
            DefaultValue = 14,
            Group = "Timeframe 3",
            MinValue = 5,
            MaxValue = 50
        )]
        public int MAPeriod3_Fast { get; set; }

        [Parameter(
            "Slow MA Period 3",
            DefaultValue = 28,
            Group = "Timeframe 3",
            MinValue = 10,
            MaxValue = 200,
            Step = 10
        )]
        public int MAPeriod3_Slow { get; set; }

        [Output("MA3 Fast", LineColor = "Green", Thickness = 3, PlotType = PlotType.Points)]
        public IndicatorDataSeries MA3_Fast { get; set; }

        [Output("MA3 Slow", LineColor = "Green", Thickness = 3)]
        public IndicatorDataSeries MA3_Slow { get; set; }

        //* ----------------------------------- MA4 ---------------------------------- */
        [Parameter("Timeframe 4", DefaultValue = "W1", Group = "Timeframe 4")]
        public TimeFrame Timeframe4 { get; set; }

        [Parameter(
            "Fast MA Type 4",
            DefaultValue = MovingAverageType.Triangular,
            Group = "Timeframe 4"
        )]
        public MovingAverageType MAType4_Fast { get; set; }

        [Parameter(
            "Slow MA Type 4",
            DefaultValue = MovingAverageType.Triangular,
            Group = "Timeframe 4"
        )]
        public MovingAverageType MAType4_Slow { get; set; }

        [Parameter(
            "Fast MA Period 4",
            DefaultValue = 14,
            Group = "Timeframe 4",
            MinValue = 5,
            MaxValue = 50
        )]
        public int MAPeriod4_Fast { get; set; }

        [Parameter(
            "Slow MA Period 4",
            DefaultValue = 28,
            Group = "Timeframe 4",
            MinValue = 10,
            MaxValue = 200,
            Step = 10
        )]
        public int MAPeriod4_Slow { get; set; }

        [Output("MA4 Fast", LineColor = "Orange", Thickness = 4, PlotType = PlotType.Points)]
        public IndicatorDataSeries MA4_Fast { get; set; }

        [Output("MA4 Slow", LineColor = "Orange", Thickness = 4)]
        public IndicatorDataSeries MA4_Slow { get; set; }

        //* -------------------------------------------------------------------------- */
        public Dictionary<int, bool> AllAligned = new Dictionary<int, bool>();
        public Dictionary<int, bool> ThreeAligned = new Dictionary<int, bool>();
        public Dictionary<int, Trend> Trends = new Dictionary<int, Trend>();

        public static object[] Series(
            TimeFrame Timeframe1,
            MovingAverageType MAType1_Fast,
            MovingAverageType MAType1_Slow,
            int MAPeriod1_Fast,
            int MAPeriod1_Slow,
            TimeFrame Timeframe2,
            MovingAverageType MAType2_Fast,
            MovingAverageType MAType2_Slow,
            int MAPeriod2_Fast,
            int MAPeriod2_Slow,
            TimeFrame Timeframe3,
            MovingAverageType MAType3_Fast,
            MovingAverageType MAType3_Slow,
            int MAPeriod3_Fast,
            int MAPeriod3_Slow,
            TimeFrame Timeframe4,
            MovingAverageType MAType4_Fast,
            MovingAverageType MAType4_Slow,
            int MAPeriod4_Fast,
            int MAPeriod4_Slow
        )
        {
            return new object[]
            {
                Timeframe1,
                MAType1_Fast,
                MAType1_Slow,
                MAPeriod1_Fast,
                MAPeriod1_Slow,
                Timeframe2,
                MAType2_Fast,
                MAType2_Slow,
                MAPeriod2_Fast,
                MAPeriod2_Slow,
                Timeframe3,
                MAType3_Fast,
                MAType3_Slow,
                MAPeriod3_Fast,
                MAPeriod3_Slow,
                Timeframe4,
                MAType4_Fast,
                MAType4_Slow,
                MAPeriod4_Fast,
                MAPeriod4_Slow
            };
        }

        protected override void Initialize()
        {
#if DEBUG_NO
            if (System.Diagnostics.Debugger.IsAttached == false)
            {
                // Debugging
                var result = System.Diagnostics.Debugger.Launch();
                if (result is false)
                {
                    Print("Debugger not launched");
                }
            }
#endif
            InitializeBars();
            InitializeMovingAverages();
        }

        private void InitializeBars()
        {
            timeframes[0] = MarketData.GetBars(Timeframe1);
            timeframes[1] = MarketData.GetBars(Timeframe2);
            timeframes[2] = MarketData.GetBars(Timeframe3);
            timeframes[3] = MarketData.GetBars(Timeframe4);
        }

        private void InitializeMovingAverages()
        {
            var maTypesFast = new[] { MAType1_Fast, MAType2_Fast, MAType3_Fast, MAType4_Fast };
            var maTypesSlow = new[] { MAType1_Slow, MAType2_Slow, MAType3_Slow, MAType4_Slow };
            var maPeriodsFast = new[]
            {
                MAPeriod1_Fast,
                MAPeriod2_Fast,
                MAPeriod3_Fast,
                MAPeriod4_Fast
            };
            var maPeriodsSlow = new[]
            {
                MAPeriod1_Slow,
                MAPeriod2_Slow,
                MAPeriod3_Slow,
                MAPeriod4_Slow
            };
            var fastResults = new[] { MA1_Fast, MA2_Fast, MA3_Fast, MA4_Fast };
            var slowResults = new[] { MA1_Slow, MA2_Slow, MA3_Slow, MA4_Slow };

            for (int i = 0; i < NumTimeframes; i++)
            {
                slowMAs[i] = Indicators.MovingAverage(
                    timeframes[i].ClosePrices,
                    maPeriodsSlow[i],
                    maTypesSlow[i]
                );
                fastMAs[i] = Indicators.MovingAverage(
                    timeframes[i].ClosePrices,
                    maPeriodsFast[i],
                    maTypesFast[i]
                );
                this.slowResults[i] = slowResults[i];
                this.fastResults[i] = fastResults[i];
            }
        }

        public override void Calculate(int index)
        {
            UpdateBarOpenTimeIndices(index);
            UpdateMovingAverages(index);
            CheckAlignments(index);
        }

        private void UpdateBarOpenTimeIndices(int index)
        {
            var barOpenTime = Bars.OpenTimes[index];
            for (var i = 0; i < NumTimeframes; i++)
            {
                barOpenTimeIndices[i] = timeframes[i].OpenTimes.GetIndexByTime(barOpenTime);
                if (barOpenTimeIndices[i] < 0)
                {
                    timeframes[i].LoadMoreHistory();
                    barOpenTimeIndices[i] = timeframes[i].OpenTimes.GetIndexByTime(barOpenTime);
                }
            }
        }

        private void UpdateMovingAverages(int index)
        {
            for (var i = 0; i < NumTimeframes; i++)
            {
                if (barOpenTimeIndices[i] >= 0)
                {
                    slowResults[i][index] = slowMAs[i].Result[barOpenTimeIndices[i]];
                    fastResults[i][index] = fastMAs[i].Result[barOpenTimeIndices[i]];
                }
            }
        }

        private void CheckAlignments(int index)
        {
            var allAlignedNow = AreAllAligned();
            var threeAlignedNow = AreThreeAligned();

            if (index > 0)
            {
                if (allAlignedNow && !AllAligned[index - 1])
                {
                    Chart.DrawIcon(
                        "Arrow" + index,
                        ChartIconType.UpArrow,
                        index,
                        Bars.ClosePrices[index],
                        Color.Yellow
                    );
                }
                else if (threeAlignedNow && !ThreeAligned[index - 1])
                {
                    Chart.DrawIcon(
                        "ArrowWeak" + index,
                        ChartIconType.UpArrow,
                        index,
                        Bars.ClosePrices[index],
                        Color.LightYellow
                    );
                }
            }

            AllAligned[index] = allAlignedNow;
            ThreeAligned[index] = threeAlignedNow;
            Trends[index] = GetTrend();
        }

        private bool AreAllAligned()
        {
            for (var i = 1; i < NumTimeframes; i++)
            {
                if (
                    (
                        fastMAs[i].Result[barOpenTimeIndices[i]]
                        > slowMAs[i].Result[barOpenTimeIndices[i]]
                    )
                    != (
                        fastMAs[0].Result[barOpenTimeIndices[0]]
                        > slowMAs[0].Result[barOpenTimeIndices[0]]
                    )
                )
                {
                    return false;
                }
            }
            return true;
        }

        private bool AreThreeAligned()
        {
            for (var i = 1; i < 3; i++)
            {
                if (
                    (
                        fastMAs[i].Result[barOpenTimeIndices[i]]
                        > slowMAs[i].Result[barOpenTimeIndices[i]]
                    )
                    != (
                        fastMAs[0].Result[barOpenTimeIndices[0]]
                        > slowMAs[0].Result[barOpenTimeIndices[0]]
                    )
                )
                {
                    return false;
                }
            }
            return true;
        }

        private Trend GetTrend()
        {
            if (fastMAs[0].Result.LastValue > slowMAs[0].Result.LastValue)
            {
                return Trend.Up;
            }
            else if (fastMAs[0].Result.LastValue < slowMAs[0].Result.LastValue)
            {
                return Trend.Down;
            }
            else
            {
                return Trend.Neutral;
            }
        }

        public enum Trend
        {
            Up,
            Down,
            Neutral
        }
    }
}
@cortes.br
cortes.br
22 Jul 2024, 23:10
( Updated at: 23 Jul 2024, 05:15 )
Hi everyone,
I'm encountering an issue with my custom indicator on cTrader. When I scroll the chart to the left to view past dates, the indicator stops drawing lines. This issue first occurs with the H1 timeframe and then affects higher timeframes as I continue to scroll back. I've attached an image and the code for the indicator below for reference. In the image, you can see the red line stops being drawn, and the same happens with other lines as I scroll further back.
What I've Tried:
- Subscribing to chart scroll events.
- Recalculating the total number of bars and calling the Initialize method again.
Unfortunately, none of these attempts have been successful.
I'm relatively new to cTrader and might be missing something simple. I've searched the forum but couldn't find a solution. I apologize if this issue has been addressed before.
Any help or guidance would be greatly appreciated!
Attached:
- Code of the indicator
- Screenshot showing the issue
Thanks in advance!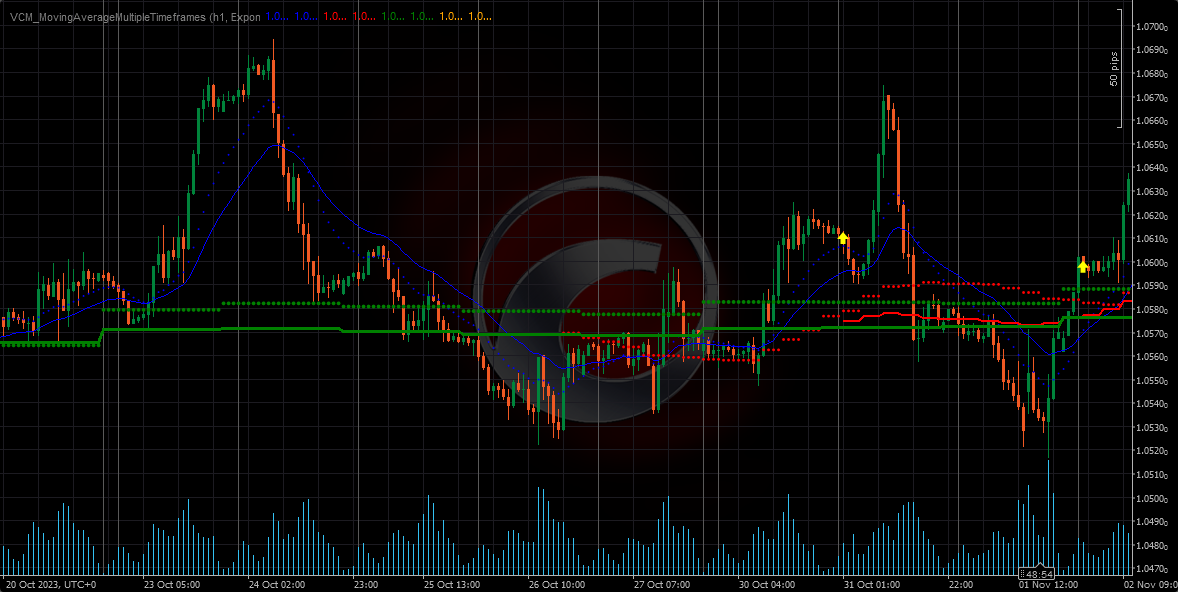
using System;
using System.Collections.Generic;
using cAlgo.API;
using cAlgo.API.Indicators;
using cAlgo.API.Internals;

namespace cAlgo
{
    [Indicator(AccessRights = AccessRights.None, IsOverlay = true, AutoRescale = false)]
    public class VCM_MovingAverageMultipleTimeframes : Indicator
    {
        //* ----------------------------------- MA1 ---------------------------------- */
        [Parameter("Timeframe 1", DefaultValue = "H1", Group = "Timeframe 1")]
        public TimeFrame Timeframe1 { get; set; }

        [Parameter(
            "Fast MA Type 1",
            DefaultValue = MovingAverageType.Exponential,
            Group = "Timeframe 1"
        )]
        public MovingAverageType MAType1_Fast { get; set; }

        [Parameter(
            "Slow MA Type 1",
            DefaultValue = MovingAverageType.Exponential,
            Group = "Timeframe 1"
        )]
        public MovingAverageType MAType1_Slow { get; set; }

        [Parameter(
            "Fast MA Period 1",
            DefaultValue = 14,
            Group = "Timeframe 1",
            MinValue = 5,
            MaxValue = 50
        )]
        public int MAPeriod1_Fast { get; set; }

        [Parameter(
            "Slow MA Period 1",
            DefaultValue = 28,
            Group = "Timeframe 1",
            MinValue = 10,
            MaxValue = 200,
            Step = 10
        )]
        public int MAPeriod1_Slow { get; set; }
        MovingAverage ma1_Slow;
        MovingAverage ma1_Fast;

        [Output("MA1 Fast", LineColor = "Blue", Thickness = 1, PlotType = PlotType.Points)]
        public IndicatorDataSeries MA1_Fast { get; set; }

        [Output("MA1 Slow", LineColor = "Blue", Thickness = 1)]
        public IndicatorDataSeries MA1_Slow { get; set; }
        Bars barsTimeframe1;

        //* ----------------------------------- MA2 ---------------------------------- */
        [Parameter("Timeframe 2", DefaultValue = "H4", Group = "Timeframe 2")]
        public TimeFrame Timeframe2 { get; set; }

        [Parameter(
            "Fast MA Type 2",
            DefaultValue = MovingAverageType.Simple,
            Group = "Timeframe 2"
        )]
        public MovingAverageType MAType2_Fast { get; set; }

        [Parameter(
            "Slow MA Type 2",
            DefaultValue = MovingAverageType.Simple,
            Group = "Timeframe 2"
        )]
        public MovingAverageType MAType2_Slow { get; set; }

        [Parameter(
            "Fast MA Period 2",
            DefaultValue = 14,
            Group = "Timeframe 2",
            MinValue = 5,
            MaxValue = 50
        )]
        public int MAPeriod2_Fast { get; set; }

        [Parameter(
            "Slow MA Period 2",
            DefaultValue = 28,
            Group = "Timeframe 2",
            MinValue = 10,
            MaxValue = 200,
            Step = 10
        )]
        public int MAPeriod2_Slow { get; set; }
        MovingAverage ma2_Slow;
        MovingAverage ma2_Fast;

        [Output("MA2 Fast", LineColor = "Red", Thickness = 2, PlotType = PlotType.Points)]
        public IndicatorDataSeries MA2_Fast { get; set; }

        [Output("MA2 Slow", LineColor = "Red", Thickness = 2)]
        public IndicatorDataSeries MA2_Slow { get; set; }
        Bars barsTimeframe2;

        //* ----------------------------------- MA3 ---------------------------------- */
        [Parameter("Timeframe 3", DefaultValue = "D1", Group = "Timeframe 3")]
        public TimeFrame Timeframe3 { get; set; }

        [Parameter(
            "Fast MA Type 3",
            DefaultValue = MovingAverageType.Weighted,
            Group = "Timeframe 3"
        )]
        public MovingAverageType MAType3_Fast { get; set; }

        [Parameter(
            "Slow MA Type 3",
            DefaultValue = MovingAverageType.Weighted,
            Group = "Timeframe 3"
        )]
        public MovingAverageType MAType3_Slow { get; set; }

        [Parameter(
            "Fast MA Period 3",
            DefaultValue = 14,
            Group = "Timeframe 3",
            MinValue = 5,
            MaxValue = 50
        )]
        public int MAPeriod3_Fast { get; set; }

        [Parameter(
            "Slow MA Period 3",
            DefaultValue = 28,
            Group = "Timeframe 3",
            MinValue = 10,
            MaxValue = 200,
            Step = 10
        )]
        public int MAPeriod3_Slow { get; set; }
        MovingAverage ma3_Slow;
        MovingAverage ma3_Fast;

        [Output("MA3 Fast", LineColor = "Green", Thickness = 3, PlotType = PlotType.Points)]
        public IndicatorDataSeries MA3_Fast { get; set; }

        [Output("MA3 Slow", LineColor = "Green", Thickness = 3)]
        public IndicatorDataSeries MA3_Slow { get; set; }
        Bars barsTimeframe3;

        //* ----------------------------------- MA4 ---------------------------------- */
        [Parameter("Timeframe 4", DefaultValue = "W1", Group = "Timeframe 4")]
        public TimeFrame Timeframe4 { get; set; }

        [Parameter(
            "Fast MA Type 4",
            DefaultValue = MovingAverageType.Triangular,
            Group = "Timeframe 4"
        )]
        public MovingAverageType MAType4_Fast { get; set; }

        [Parameter(
            "Slow MA Type 4",
            DefaultValue = MovingAverageType.Triangular,
            Group = "Timeframe 4"
        )]
        public MovingAverageType MAType4_Slow { get; set; }

        [Parameter(
            "Fast MA Period 4",
            DefaultValue = 14,
            Group = "Timeframe 4",
            MinValue = 5,
            MaxValue = 50
        )]
        public int MAPeriod4_Fast { get; set; }

        [Parameter(
            "Slow MA Period 4",
            DefaultValue = 28,
            Group = "Timeframe 4",
            MinValue = 10,
            MaxValue = 200,
            Step = 10
        )]
        public int MAPeriod4_Slow { get; set; }
        MovingAverage ma4_Slow;
        MovingAverage ma4_Fast;

        [Output("MA4 Fast", LineColor = "Orange", Thickness = 4, PlotType = PlotType.Points)]
        public IndicatorDataSeries MA4_Fast { get; set; }

        [Output("MA4 Slow", LineColor = "Orange", Thickness = 4)]
        public IndicatorDataSeries MA4_Slow { get; set; }
        Bars barsTimeframe4;


        public Dictionary<int, bool> AllAligned = new Dictionary<int, bool>();
        public Dictionary<int, bool> ThreeAligned = new Dictionary<int, bool>();
        public Dictionary<int, Trend> Trends = new Dictionary<int, Trend>();

        public static object[] Series(
            TimeFrame Timeframe1,
            MovingAverageType MAType1_Fast,
            MovingAverageType MAType1_Slow,
            int MAPeriod1_Fast,
            int MAPeriod1_Slow,
            TimeFrame Timeframe2,
            MovingAverageType MAType2_Fast,
            MovingAverageType MAType2_Slow,
            int MAPeriod2_Fast,
            int MAPeriod2_Slow,
            TimeFrame Timeframe3,
            MovingAverageType MAType3_Fast,
            MovingAverageType MAType3_Slow,
            int MAPeriod3_Fast,
            int MAPeriod3_Slow,
            TimeFrame Timeframe4,
            MovingAverageType MAType4_Fast,
            MovingAverageType MAType4_Slow,
            int MAPeriod4_Fast,
            int MAPeriod4_Slow
        )
        {
            return new object[]
            {
                Timeframe1,
                MAType1_Fast,
                MAType1_Slow,
                MAPeriod1_Fast,
                MAPeriod1_Slow,
                Timeframe2,
                MAType2_Fast,
                MAType2_Slow,
                MAPeriod2_Fast,
                MAPeriod2_Slow,
                Timeframe3,
                MAType3_Fast,
                MAType3_Slow,
                MAPeriod3_Fast,
                MAPeriod3_Slow,
                Timeframe4,
                MAType4_Fast,
                MAType4_Slow,
                MAPeriod4_Fast,
                MAPeriod4_Slow
            };
        }

        protected override void Initialize()
        {
#if DEBUG_NO
            if (System.Diagnostics.Debugger.IsAttached == false)
            {
                // Debugging
                var result = System.Diagnostics.Debugger.Launch();
                if (result is false)
                {
                    Print("Debugger not launched");
                }
            }
#endif
            barsTimeframe1 = MarketData.GetBars(Timeframe1);
            barsTimeframe2 = MarketData.GetBars(Timeframe2);
            barsTimeframe3 = MarketData.GetBars(Timeframe3);
            barsTimeframe4 = MarketData.GetBars(Timeframe4);
            ma1_Slow = Indicators.MovingAverage(
                barsTimeframe1.ClosePrices,
                MAPeriod1_Slow,
                MAType1_Slow
            );
            ma2_Slow = Indicators.MovingAverage(
                barsTimeframe2.ClosePrices,
                MAPeriod2_Slow,
                MAType2_Slow
            );
            ma3_Slow = Indicators.MovingAverage(
                barsTimeframe3.ClosePrices,
                MAPeriod3_Slow,
                MAType3_Slow
            );
            ma4_Slow = Indicators.MovingAverage(
                barsTimeframe4.ClosePrices,
                MAPeriod4_Slow,
                MAType4_Slow
            );
            ma1_Fast = Indicators.MovingAverage(
                barsTimeframe1.ClosePrices,
                MAPeriod1_Fast,
                MAType1_Fast
            );
            ma2_Fast = Indicators.MovingAverage(
                barsTimeframe2.ClosePrices,
                MAPeriod2_Fast,
                MAType2_Fast
            );
            ma3_Fast = Indicators.MovingAverage(
                barsTimeframe3.ClosePrices,
                MAPeriod3_Fast,
                MAType3_Fast
            );
            ma4_Fast = Indicators.MovingAverage(
                barsTimeframe4.ClosePrices,
                MAPeriod4_Fast,
                MAType4_Fast
            );
        }

        public override void Calculate(int index)
        {
            DateTime barOpenTime = Bars.OpenTimes[index];
            int index1 = barsTimeframe1.OpenTimes.GetIndexByTime(barOpenTime);
            int index2 = barsTimeframe2.OpenTimes.GetIndexByTime(barOpenTime);
            int index3 = barsTimeframe3.OpenTimes.GetIndexByTime(barOpenTime);
            int index4 = barsTimeframe4.OpenTimes.GetIndexByTime(barOpenTime);
            if (index1 >= 0)
            {
                MA1_Slow[index] = ma1_Slow.Result[index1];
                MA1_Fast[index] = ma1_Fast.Result[index1];
            }
            if (index2 >= 0)
            {
                MA2_Slow[index] = ma2_Slow.Result[index2];
                MA2_Fast[index] = ma2_Fast.Result[index2];
            }
            if (index3 >= 0)
            {
                MA3_Slow[index] = ma3_Slow.Result[index3];
                MA3_Fast[index] = ma3_Fast.Result[index3];
            }
            if (index4 >= 0)
            {
                MA4_Slow[index] = ma4_Slow.Result[index4];
                MA4_Fast[index] = ma4_Fast.Result[index4];
            }
            // Check alignment
            bool allAlignedNow = AreAllAligned(index1, index2, index3, index4);
            bool threeAlignedNow = AreThreeAligned(index1, index2, index3);
            if (index > 0 && allAlignedNow && !AllAligned[index - 1])
            {
                Chart.DrawIcon(
                    "Arrow" + index,
                    ChartIconType.UpArrow,
                    index,
                    Bars.ClosePrices[index],
                    Color.Yellow
                );
            }
            else if (index > 0 && threeAlignedNow && !ThreeAligned[index - 1])
            {
                Chart.DrawIcon(
                    "ArrowWeak" + index,
                    ChartIconType.UpArrow,
                    index,
                    Bars.ClosePrices[index],
                    Color.LightYellow
                );
            }
            AllAligned[index] = allAlignedNow;
            ThreeAligned[index] = threeAlignedNow;
            Trends[index] = GetTrend(ma1_Fast, ma1_Slow);
        }

        bool AreAllAligned(int index1, int index2, int index3, int index4)
        {
            bool isAligned1 = ma1_Fast.Result[index1] > ma1_Slow.Result[index1];
            bool isAligned2 = ma2_Fast.Result[index2] > ma2_Slow.Result[index2];
            bool isAligned3 = ma3_Fast.Result[index3] > ma3_Slow.Result[index3];
            bool isAligned4 = ma4_Fast.Result[index4] > ma4_Slow.Result[index4];
            return isAligned1 == isAligned2 && isAligned2 == isAligned3 && isAligned3 == isAligned4;
        }

        bool AreThreeAligned(int index1, int index2, int index3)
        {
            bool isAligned1 = ma1_Fast.Result[index1] > ma1_Slow.Result[index1];
            bool isAligned2 = ma2_Fast.Result[index2] > ma2_Slow.Result[index2];
            bool isAligned3 = ma3_Fast.Result[index3] > ma3_Slow.Result[index3];
            return isAligned1 == isAligned2 && isAligned2 == isAligned3;
        }

        private Trend GetTrend(MovingAverage fastMa, MovingAverage slowMa)
        {
            if (fastMa.Result.LastValue > slowMa.Result.LastValue)
            {
                return Trend.Up;
            }
            else if (fastMa.Result.LastValue < slowMa.Result.LastValue)
            {
                return Trend.Down;
            }
            else
            {
                return Trend.Neutral;
            }
        }

        public enum Trend
        {
            Up,
            Down,
            Neutral
        }
    }
}
@cortes.br
cortes.br
25 Jul 2024, 12:56
RE: RE: Custom Indicator Values Controlled by cBot in cTrader
That's exactly what I did, haha, although I came looking for an alternative with fewer steps.
Thanks for the help, Panagiotis.
PanagiotisCharalampous said:
@cortes.br