Indicator - Liquidity Levels - Add Functionality

Status
Closed
Budget
125.00 USD
Payment Method
Direct Payment
Job Description
Dear Sirs:
Indicator: Liquidity Levels Indicator v03-01
PURPOSE
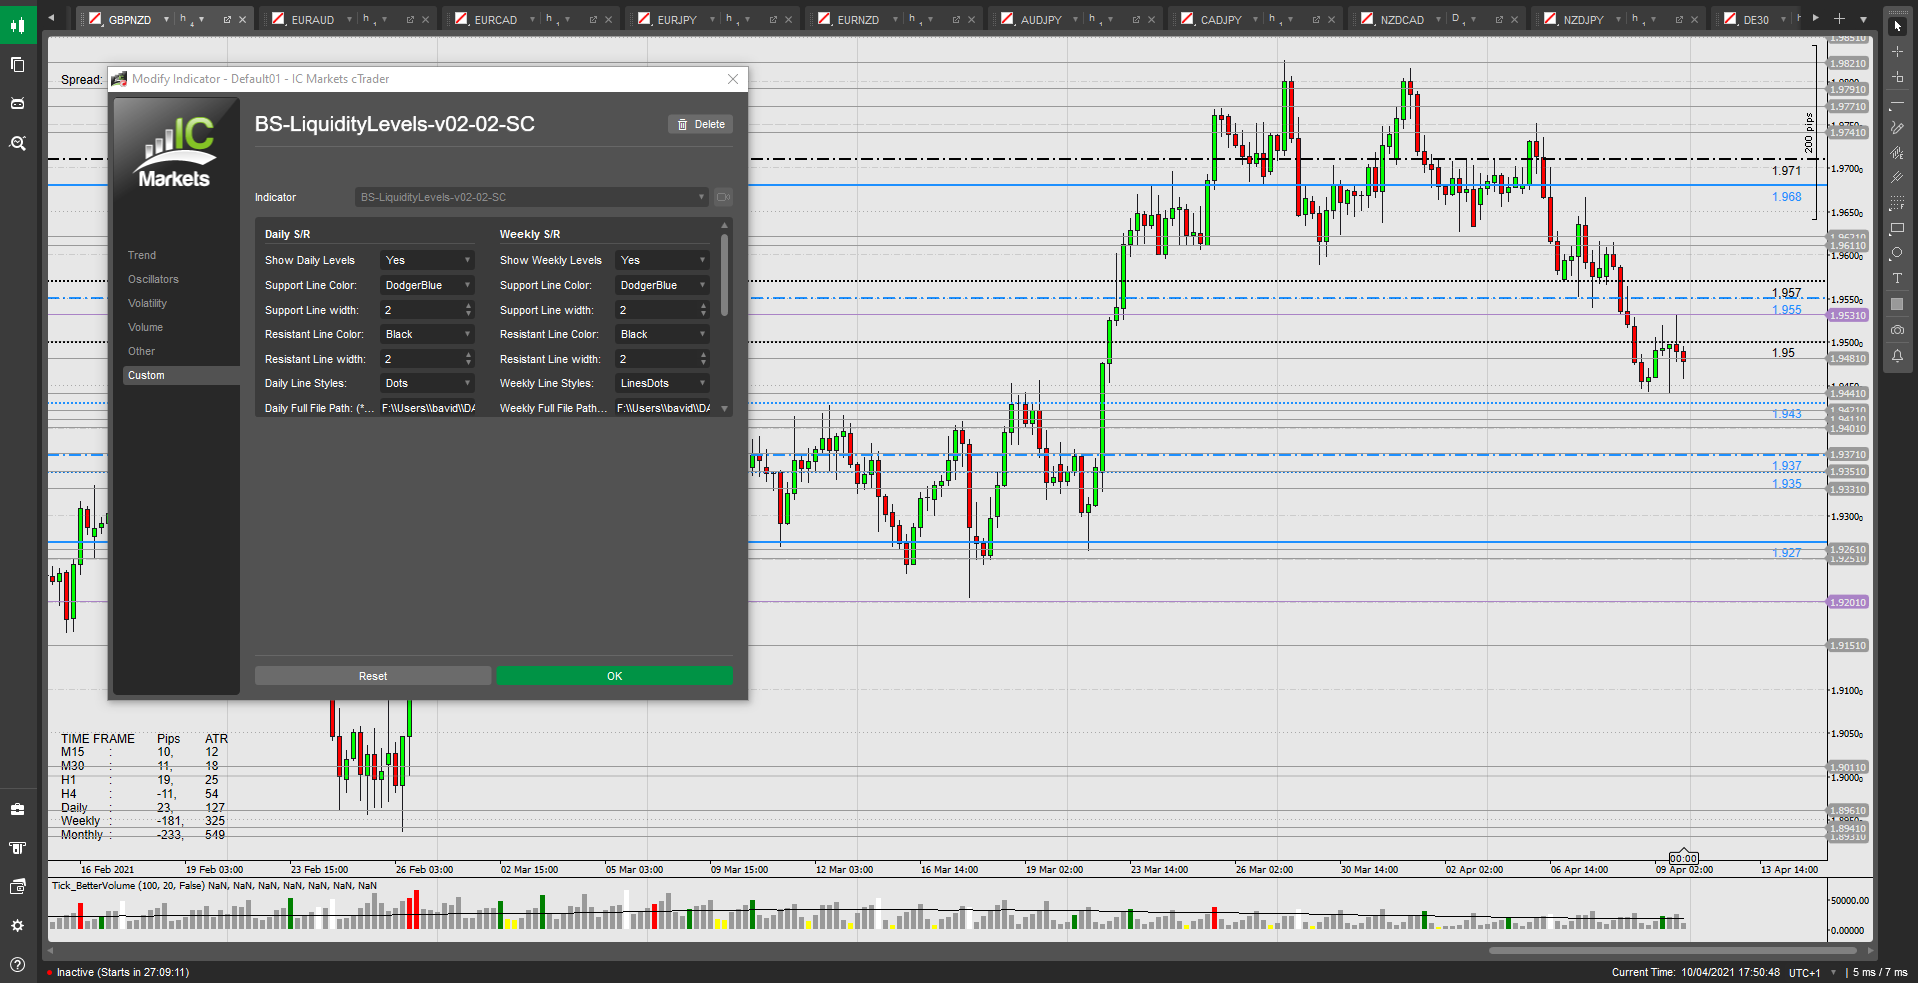
I own an existing C# indicator to which I would like
to add an additional feature.
The existing indicator reads Monthly, Weekly, and Daily
Support & Resistance levels from three separate .csv files.
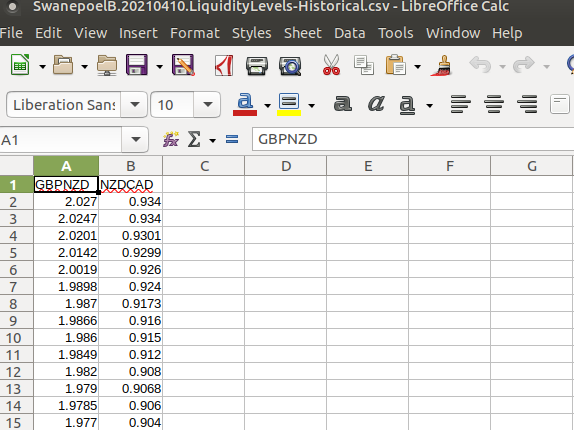
The new feature will read Historical Monthly Support & Resistance Levels
from a fourth .csv file and draw these on the graph.
Screenshot are available at the end of the written section,
to explain the idea visually.
*
INPUT PARAMETERS
File: .csv file with Historical Monthly Liquidity Levels
I am only concerned with the Monthly Levels.
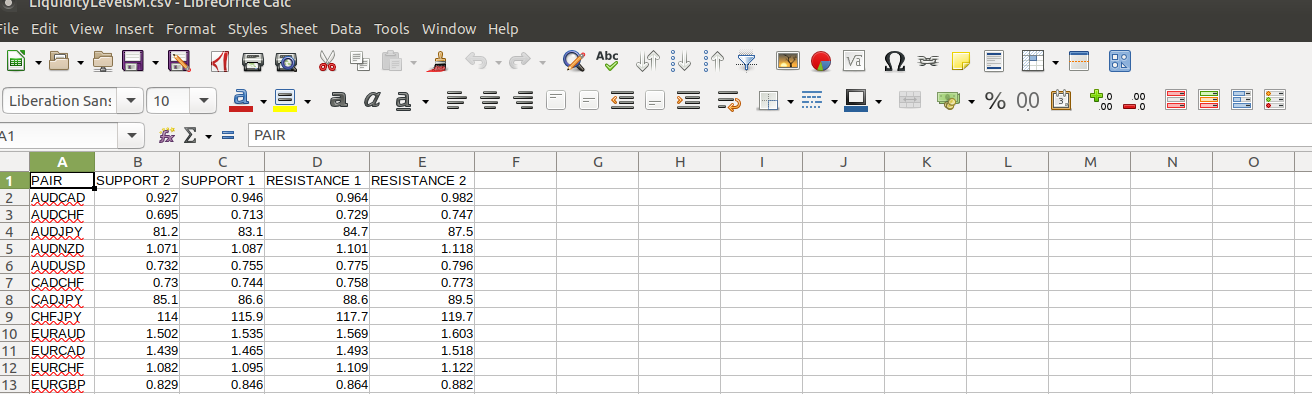
Please note: the orientation of the price levels differ between
the Current Levels (snapshot: SwanepoelB.20210410.LiquidityLevels-CSV02.png), and
the Historical Levels(snapshot: SwanepoelB.20210410.HistoricalLiquidityLevels-CSV02.png).
One can change the orientation of the first file price levels to vertical columns
as present in the second file.
Due to the amount of data in the second file, changing the orientation
to match the smaller first file, will be too challenging to read and manage.
The new input parameters shall be the same, except:
- Heading = ‘Historical S/R’
- Show Historical Levels: Yes/ No
- Historical Full File Path:
New features:
- № Levels to Display on Monthly TF:
- № Levels to Display on Weekly TF:
- № Levels to Display on <= Daily TF:
**
OUTPUTS
First, the indicator will round the Historical Levels to the nearest 10,
and add 1 pip to the value.
For instance 1.7554 → 1.7550 +1 = 1.7551
[It avoids overlapping of lines]
If the same price level repeats in the .csv file, only one line is required.
Two scenarios exist:
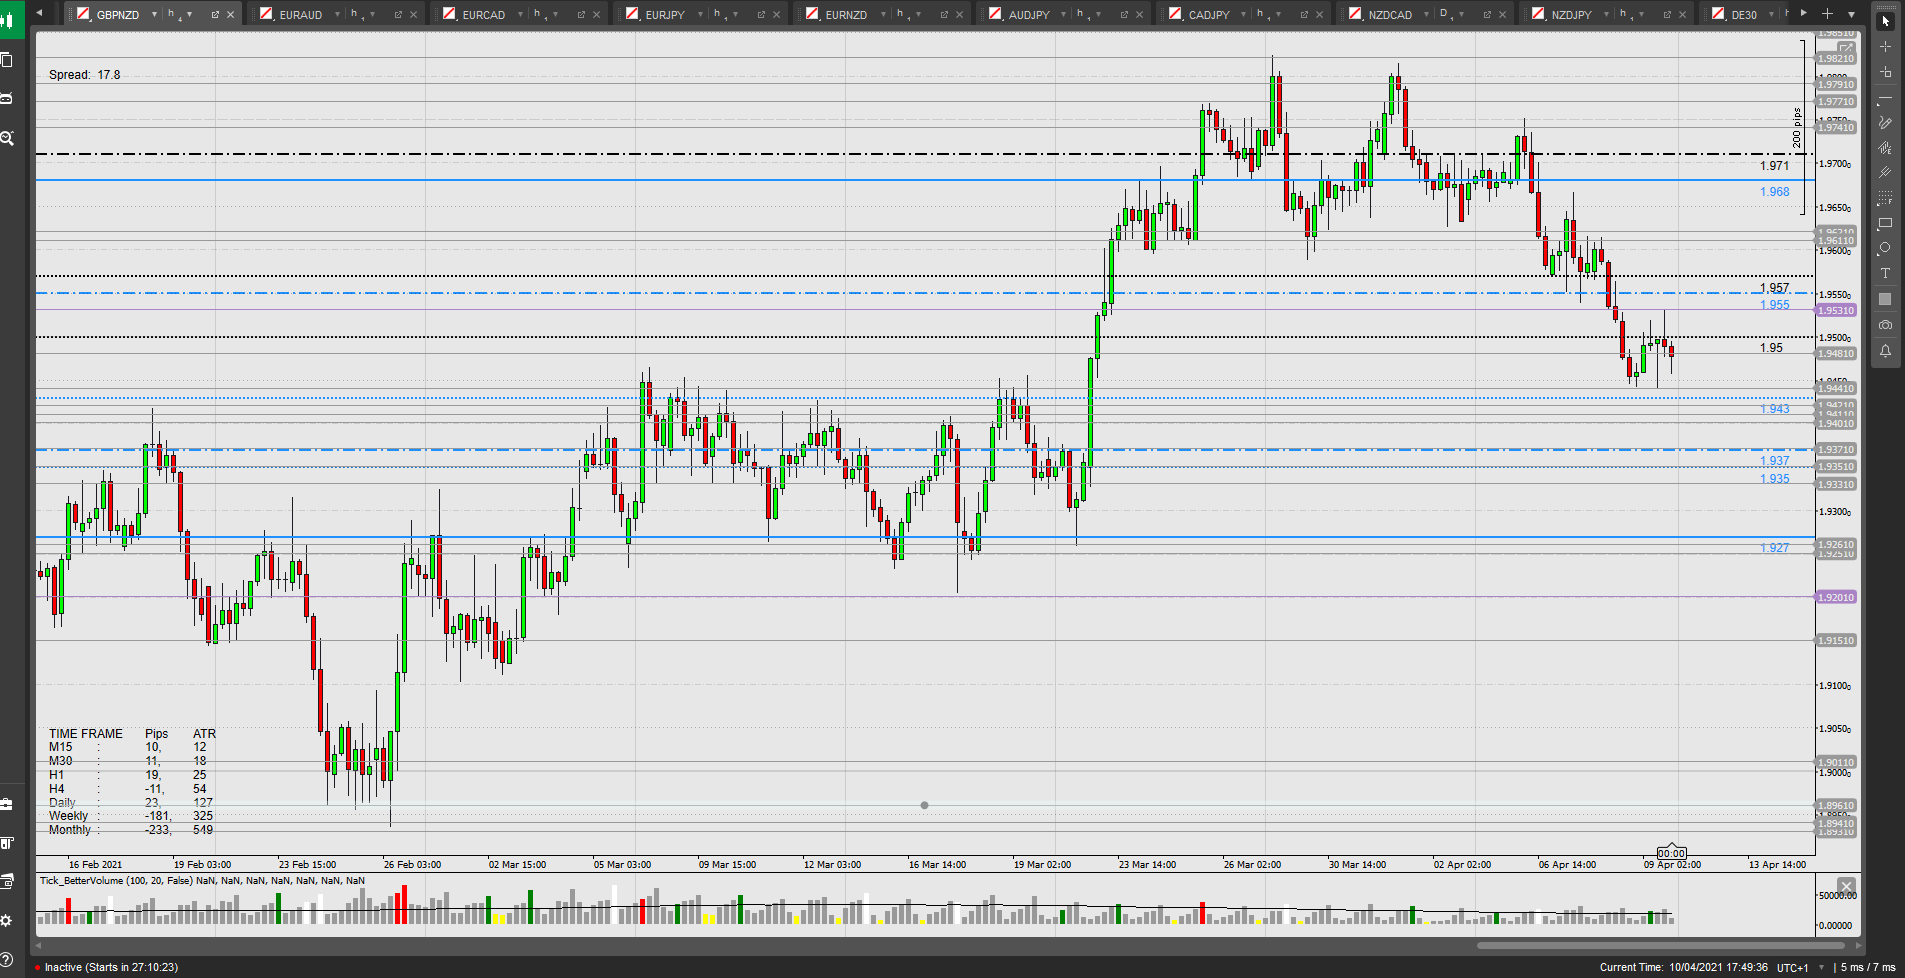
Scenario 01 – Chart with most current price to right
The new indicator will also draw the Historical Monthly Levels,
n-levels above, and below current price.
No scale adjustment required.
Scenario 02 – Chart was scrolled back to an earlier date
The new indicator will also draw the Historical Monthly Levels,
n-levels above, and below, mid-chart price.
No scale adjustment required.
I wish the prices to be displayed on the axis as per screenshots.
***
SOURCE CODE
The C# source code, along with the relevant .csv files
will be made available.
****
Look forward to hearing from you.
Sincerely,
Ben Swanepoel
Comments
Hello bsicm0001
re: "Indicator - Liquidity Levels - Add Functionality"
contact Email for modification : emmasystems@yahoo.com
Kind regards.
Hi there,
We can help you with your project. You can contact us at contact@clickalgo.com for more information.
Best Regards,
Donald