RY
Status
Closed
Budget
30.00 USD
Payment Method
Direct Payment
Job Description
Hi,
I need an upgrade of an abandoned indicator which plots lines on major swing high/lows.
https://ctrader.com/algos/indicators/show/1107
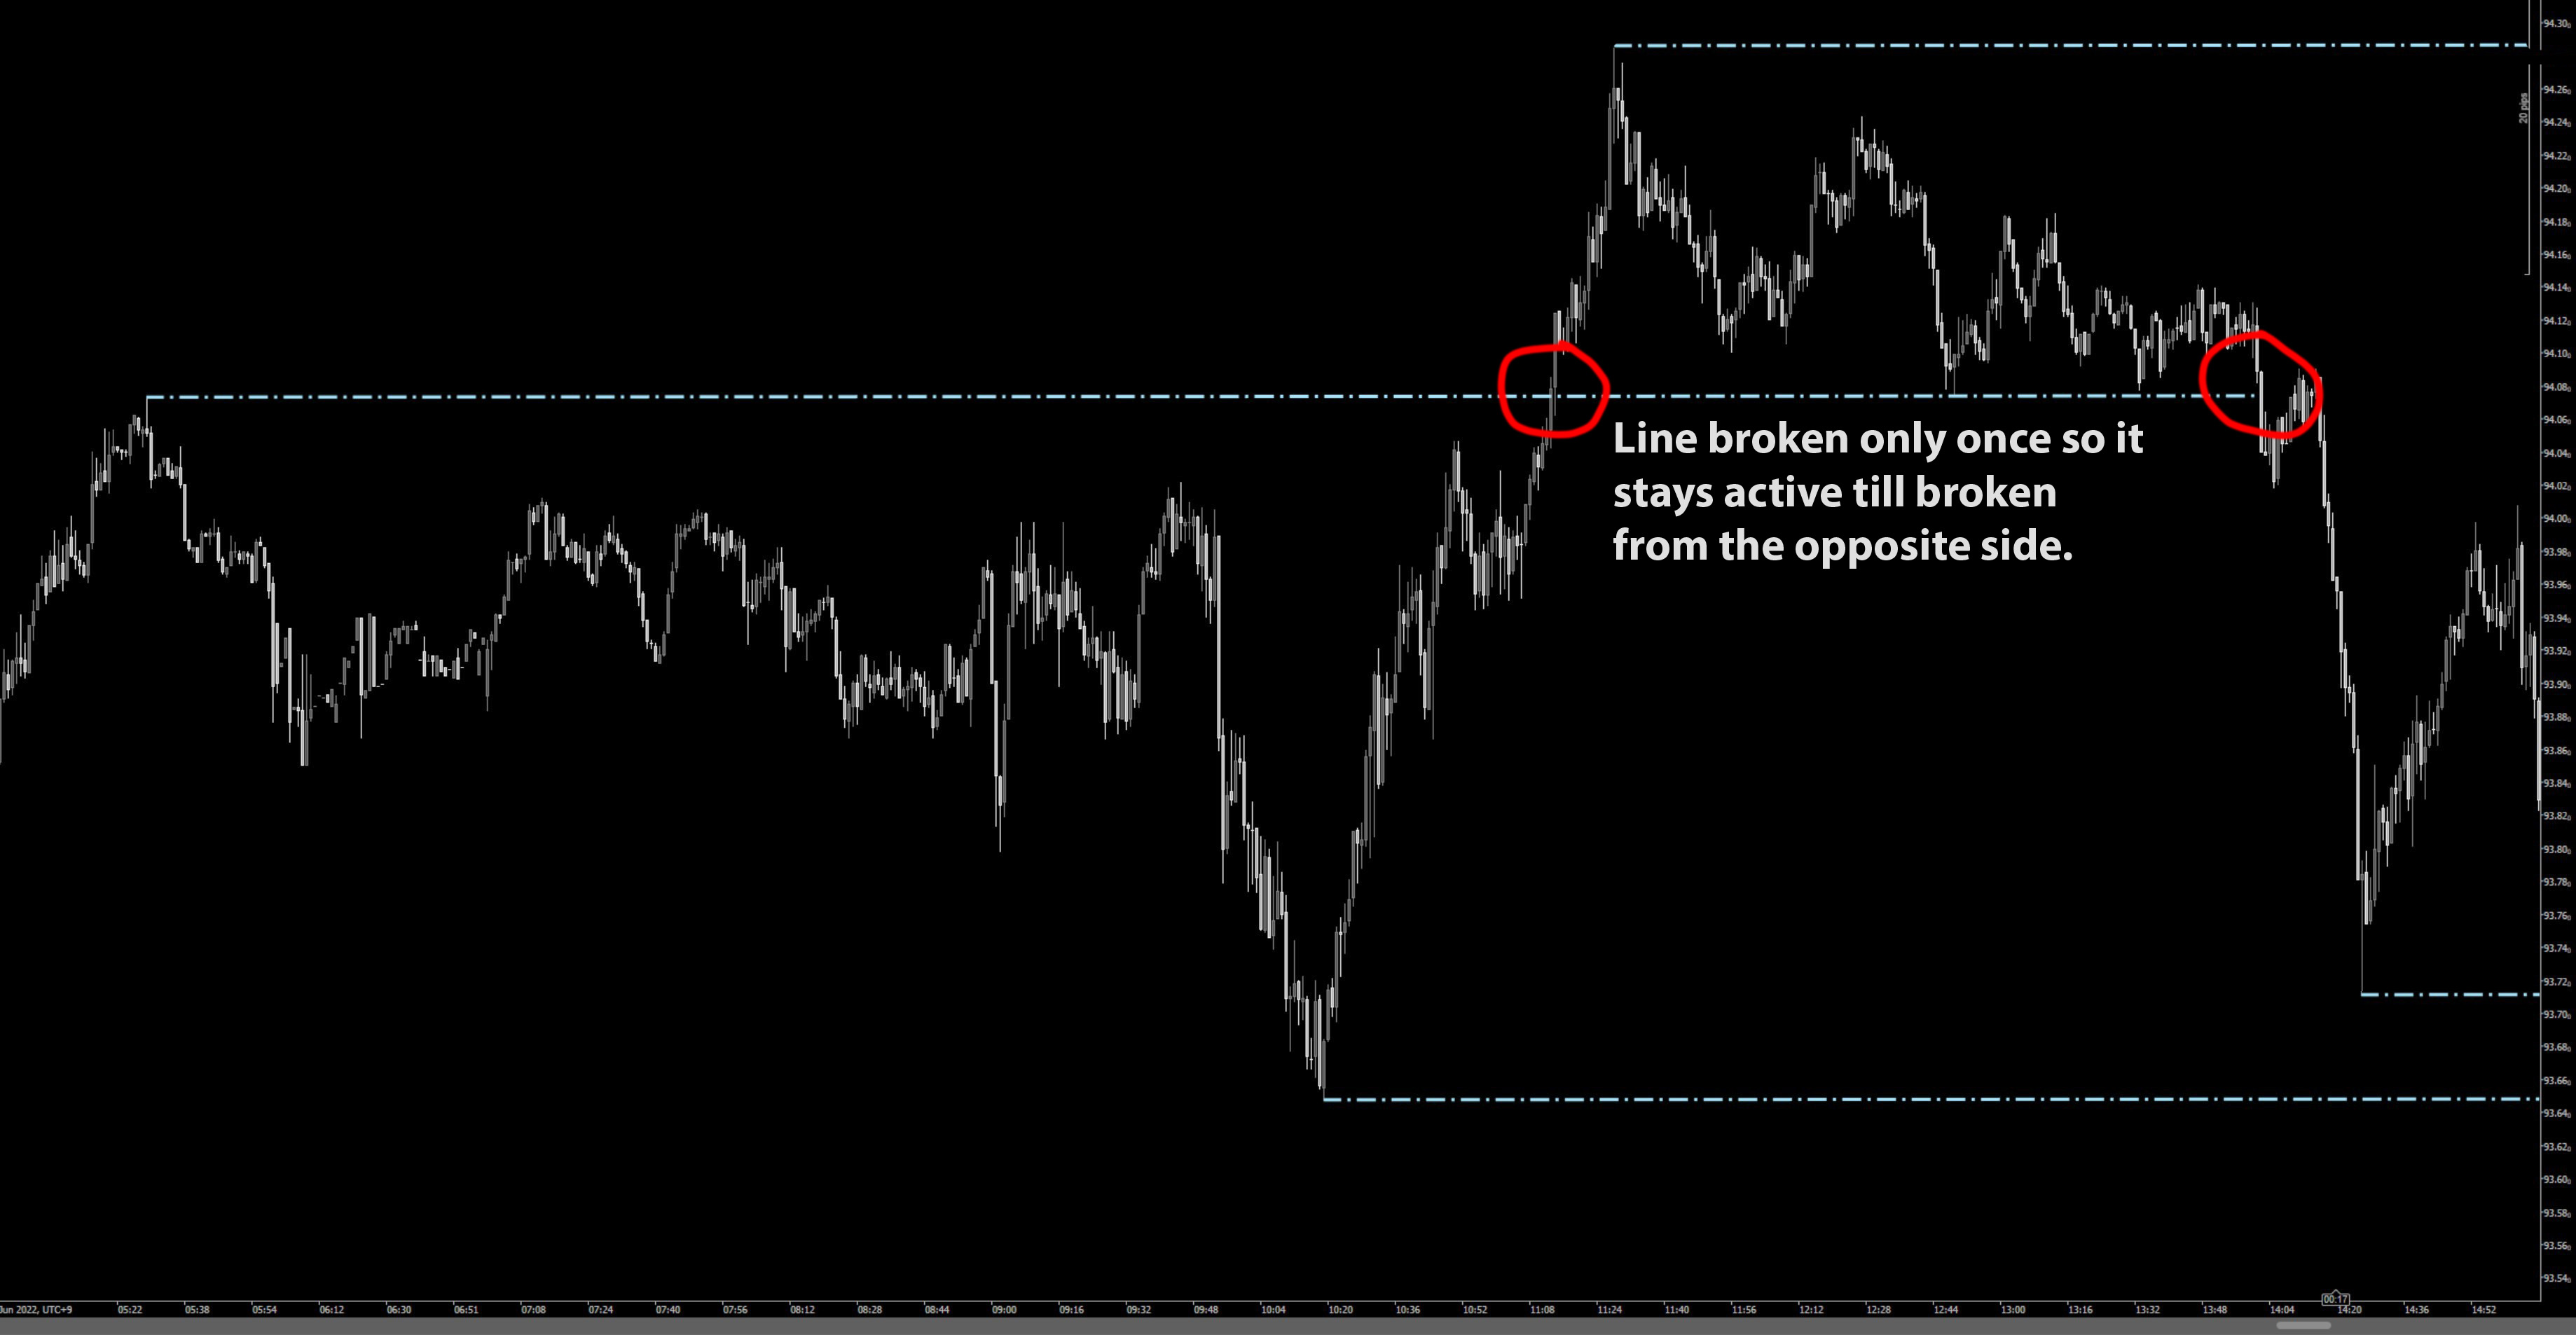
- At the moment the indicator doesn’t plot the lines all the way to the right, so I need to change the setting to extend the lines to the right (attached picture), so I will know there is a strong SR zone even a few days later.
- In the current setting, there is set that the indicator scales the chart in cTrader. I need this function off. The lines which won't fit on the default cTrader scaled chart will just be outside the screen, appearing only when the market gets close to it
- It should plot the lines at least 1 month back (not sure about the current settings)
- Once the line is broken, it will disappear, but if possible I would like to have there a possibility to set that if it's broken only once, it will stay still plotted, so trader can trade "support becomes resistance" or "resistance become support" pattern, which is one of the major trading approaches. :)
Thank you
Francis
Email: ryosukeh2100@gmail.com

Comments
On second thought, you might not spend a cent, use this free indicator Amazing Donchian Indicator | Algorithmic Forex Trading | cTrader Community
I can do it for $25 if you share ctrader.guru with your social
Telegram: https://t.me/LeonardoCiaccio
Email: ctrader.guru@gmail.com
Official Website: https://ctrader.guru
or contact me from here https://ctrader.com/consultants/ (cTrader Guru)

Hi Leonardo,
thank you for your offer and the indicator suggestion. I will contact you directly within a few days.
Francis