ChartObjects.DrawLine

ChartObjects.DrawLine
17 Dec 2012, 15:26
Drawing a line would be really helpful for indicator developement especially for advanced pivot drawings.
Thanks.
Replies
hichem
09 Jan 2013, 16:19
RE:
Thank you for the suggestion. If you need a horizontal line it is easily implemented by either using the Levels attribute for indicators or setting a constant value to an Outpout Indicator Result, e.g.
        [Output("Main")]
        public IndicatorDataSeries Result { get; set; }

        public override void Calculate(int index)
        {
            Result[index] = 1;
        }
Thank you for your reply.
Yes it is ok for drawing a horizontal line. My suggestion was for drawing other forms of line such as trnd lines or vertical lines dynamically as Chart objects
@hichem
Scott
21 Feb 2013, 19:16
RE:
Thank you for the suggestion. If you need a horizontal line it is easily implemented by either using the Levels attribute for indicators or setting a constant value to an Outpout Indicator Result, e.g.
        [Output("Main")]
        public IndicatorDataSeries Result { get; set; }

        public override void Calculate(int index)
        {
            Result[index] = 1;
        }
I would like to also have my SMA line displayed as horizontal lines, I have tried to amend my indicator but it just show a line at the bottom of the screen, could you show me how please
My indicator code
using System;
using cAlgo.API;
using cAlgo.API.Indicators;
namespace cAlgo.Indicators
{
[Indicator(IsOverlay = true)]
public class FibGrid7indi : Indicator
{
[Parameter]
public DataSeries Source { get; set; }
[Parameter("L1", DefaultValue = 21)]
public int Periods { get; set; }
[Parameter("L2", DefaultValue = 34)]
public int Periods2 { get; set; }
[Parameter("L3", DefaultValue = 55)]
public int Periods3 { get; set; }
[Parameter("L4", DefaultValue = 75)]
public int Periods4 { get; set; }
[Parameter("L5", DefaultValue = 100)]
public int Periods5 { get; set; }
[Parameter("L6", DefaultValue = 144)]
public int Periods6 { get; set; }
[Parameter("L7", DefaultValue = 233)]
public int Periods7 { get; set; }
[Output("Level1", Color = Colors.Lime, Thickness = 5)]
public IndicatorDataSeries Result { get; set; }
[Output("Level2", Color = Colors.Yellow, Thickness = 5)]
public IndicatorDataSeries Result2 { get; set; }
[Output("Level3", Color = Colors.White, Thickness = 5)]
public IndicatorDataSeries Result3 { get; set; }
[Output("Level4", Color = Colors.Aqua, Thickness = 5)]
public IndicatorDataSeries Result4 { get; set; }
[Output("Level5", Color = Colors.Blue, Thickness = 5)]
public IndicatorDataSeries Result5 { get; set; }
[Output("Level6", Color = Colors.Orange, Thickness = 5)]
public IndicatorDataSeries Result6 { get; set; }
[Output("Level7", Color = Colors.Red, Thickness = 5)]
public IndicatorDataSeries Result7 { get; set; }
private SimpleMovingAverage _simpleMovingAverage1;
private SimpleMovingAverage _simpleMovingAverage2;
private SimpleMovingAverage _simpleMovingAverage3;
private SimpleMovingAverage _simpleMovingAverage4;
private SimpleMovingAverage _simpleMovingAverage5;
private SimpleMovingAverage _simpleMovingAverage6;
private SimpleMovingAverage _simpleMovingAverage7;
protected override void Initialize()
{
_simpleMovingAverage1 = Indicators.SimpleMovingAverage(Source, Periods);
_simpleMovingAverage2 = Indicators.SimpleMovingAverage(Source, Periods2);
_simpleMovingAverage3 = Indicators.SimpleMovingAverage(Source, Periods3);
_simpleMovingAverage4 = Indicators.SimpleMovingAverage(Source, Periods4);
_simpleMovingAverage5 = Indicators.SimpleMovingAverage(Source, Periods5);
_simpleMovingAverage6 = Indicators.SimpleMovingAverage(Source, Periods6);
_simpleMovingAverage7 = Indicators.SimpleMovingAverage(Source, Periods7);
}
public override void Calculate(int index)
{
Result[index] = _simpleMovingAverage1.Result[index];
Result2[index] = _simpleMovingAverage2.Result[index];
Result3[index] = _simpleMovingAverage3.Result[index];
Result4[index] = _simpleMovingAverage4.Result[index];
Result5[index] = _simpleMovingAverage5.Result[index];
Result6[index] = _simpleMovingAverage6.Result[index];
Result7[index] = _simpleMovingAverage7.Result[index];
}
}
}
@Scott
cAlgo_Fanatic
22 Feb 2013, 10:09
Hello Scott, could you please post a screenshot of the desired output for the SMA?
Regards
@cAlgo_Fanatic
Scott
22 Feb 2013, 22:59
( Updated at: 21 Dec 2023, 09:20 )
RE:
Hello Scott, could you please post a screenshot of the desired output for the SMA?
Regards
Hi Support, I'm looking for the SMA output to be like the 1m to the right, straight lines
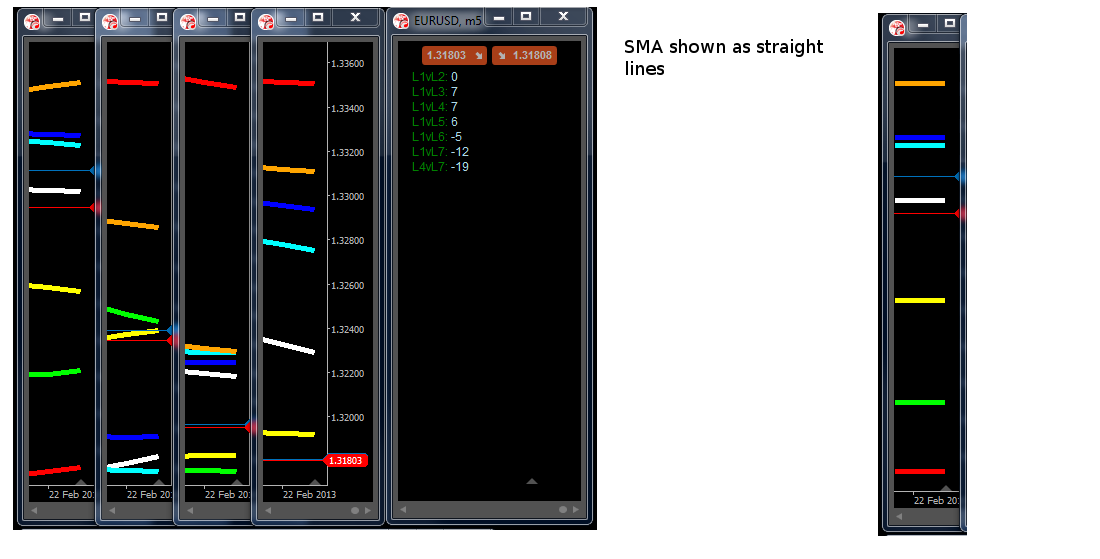
I tried modifying my code so the output looked like this but all the lines went as one.
@Scott
cAlgo_Fanatic
25 Feb 2013, 11:22
Do you mean horizontal lines that pass through the last index value of the sma?
@cAlgo_Fanatic
Scott
25 Feb 2013, 23:24
RE:
Do you mean horizontal lines that pass through the last index value of the sma?
horizontal lines like the example above, I use the SMA as support and restance, 1m 5m 15m 1hr I using the (money map/ tiger lanes / fxgauge / combogrid) system they use 7 levels 21sma 34sma 55sma 75sma 100ma 144sma 233sma (well they use ema but I like using sma instead so I don't get faked out)
so I used the solution to make a sma line caculate as a straight line making it easier to see. When you have added the ability to view mutiple time frames in a single chart I'll be able to replecate this trading tool much better but for now this will do, I have also added the fiboncci bands to chart, so would be wanting to show them as horizontal lines as well.
Heres a link to information about tiger lanes if you scroll down the page you can see what I'm tring to achive http://www.forex-tsd.com/suggestions-trading-systems/1335-dynamic-fibonacci-grid-fx-money-map-21.html
Thanks
@Scott
cAlgo_Fanatic
26 Feb 2013, 12:59
Multi time frames are not currently supported. Furthermore, Moving Averages are not straight lines, therefore we need to understand what formula/logic you want to use to output straight lines.
A straight line is described by two points on the graph. Which points would those be if the moving average is used, the last two values for instance? If the lines are horizontal then one point. Would that be the last value?
Regards,
@cAlgo_Fanatic
Scott
26 Feb 2013, 22:13
RE:
Multi time frames are not currently supported. Furthermore, Moving Averages are not straight lines, therefore we need to understand what formula/logic you want to use to output straight lines.
A straight line is described by two points on the graph. Which points would those be if the moving average is used, the last two values for instance? If the lines are horizontal then one point. Would that be the last value?Regards,
Hi the line would be recalculated for every move so the history of the sma would be wiped out and only the the current price for the sma would be shown ( a bit like fibonacci piviot point indicator ) only dynamic.
I use 4 chart and size them up so I can visulize these values like the example above, I read on the site that you maybe adding mutiple time frames could you confirm that this is on the way?
Also is the a way to have the price over a sma show at the end of the indicator, using lables?
My other idicator that I use is still down I canged it to a chart overlay and it worked but then monday it stop working again, just so you know that fix doesn't seem to be working, I know that you are fixing it with the next releace.
Thanks
@Scott
admin
01 Mar 2013, 14:25
Let us know if the code below serves the purpose:
public override void Calculate(int index)
{
if (!IsRealTime) return;
for (int i = index - 10; i <= index; i++)
{
Result[i] = _simpleMovingAverage1.Result[index];
Result2[i] = _simpleMovingAverage2.Result[index];
Result3[i] = _simpleMovingAverage3.Result[index];
Result4[i] = _simpleMovingAverage4.Result[index];
Result5[i] = _simpleMovingAverage5.Result[index];
Result6[i] = _simpleMovingAverage6.Result[index];
Result7[i] = _simpleMovingAverage7.Result[index];
}
for(int i = 0; i < index - 10; i++)
{
Result[i] = double.NaN;
Result2[i] = double.NaN;
Result3[i] = double.NaN;
Result4[i] = double.NaN;
Result5[i] = double.NaN;
Result6[i] = double.NaN;
Result7[i] = double.NaN;
}
int xPos = index + 6;
double yPos = _simpleMovingAverage1.Result[index];
var text = String.Format("{0}", Math.Round(yPos, Symbol.Digits));
ChartObjects.DrawText("obj1", text, xPos, yPos, VerticalAlignment.Center, HorizontalAlignment.Left,Colors.Lime);
yPos = _simpleMovingAverage2.Result[index];
text = String.Format("{0}", Math.Round(yPos, Symbol.Digits));
ChartObjects.DrawText("obj2", text, xPos, yPos, VerticalAlignment.Bottom, HorizontalAlignment.Left,Colors.Yellow);
yPos = _simpleMovingAverage3.Result[index];
text = String.Format("{0}", Math.Round(yPos, Symbol.Digits));
ChartObjects.DrawText("obj3", text, xPos, yPos, VerticalAlignment.Center, HorizontalAlignment.Left,Colors.White);
yPos = _simpleMovingAverage4.Result[index];
text = String.Format("{0}", Math.Round(yPos, Symbol.Digits));
ChartObjects.DrawText("obj4", text, xPos, yPos, VerticalAlignment.Top, HorizontalAlignment.Left, Colors.Aqua);
yPos = _simpleMovingAverage5.Result[index];
text = String.Format("{0}", Math.Round(yPos, Symbol.Digits));
ChartObjects.DrawText("obj5", text, xPos, yPos, VerticalAlignment.Top, HorizontalAlignment.Left, Colors.Blue);
yPos = _simpleMovingAverage6.Result[index];
text = String.Format("{0}", Math.Round(yPos, Symbol.Digits));
ChartObjects.DrawText("obj6", text, xPos, yPos, VerticalAlignment.Top, HorizontalAlignment.Left,Colors.Orange);
yPos = _simpleMovingAverage7.Result[index];
text = String.Format("{0}", Math.Round(yPos, Symbol.Digits));
ChartObjects.DrawText("obj7", text, xPos, yPos, VerticalAlignment.Top, HorizontalAlignment.Left, Colors.Red);
}
Multi-time frames will be supported in the future.
@admin
Scott
01 Mar 2013, 22:14
RE:
Let us know if the code below serves the purpose:
public override void Calculate(int index) { if (!IsRealTime) return; for (int i = index - 10; i <= index; i++) { Result[i] = _simpleMovingAverage1.Result[index]; Result2[i] = _simpleMovingAverage2.Result[index]; Result3[i] = _simpleMovingAverage3.Result[index]; Result4[i] = _simpleMovingAverage4.Result[index]; Result5[i] = _simpleMovingAverage5.Result[index]; Result6[i] = _simpleMovingAverage6.Result[index]; Result7[i] = _simpleMovingAverage7.Result[index]; } for(int i = 0; i < index - 10; i++) { Result[i] = double.NaN; Result2[i] = double.NaN; Result3[i] = double.NaN; Result4[i] = double.NaN; Result5[i] = double.NaN; Result6[i] = double.NaN; Result7[i] = double.NaN; } int xPos = index + 6; double yPos = _simpleMovingAverage1.Result[index]; var text = String.Format("{0}", Math.Round(yPos, Symbol.Digits)); ChartObjects.DrawText("obj1", text, xPos, yPos, VerticalAlignment.Center, HorizontalAlignment.Left,Colors.Lime); yPos = _simpleMovingAverage2.Result[index]; text = String.Format("{0}", Math.Round(yPos, Symbol.Digits)); ChartObjects.DrawText("obj2", text, xPos, yPos, VerticalAlignment.Bottom, HorizontalAlignment.Left,Colors.Yellow); yPos = _simpleMovingAverage3.Result[index]; text = String.Format("{0}", Math.Round(yPos, Symbol.Digits)); ChartObjects.DrawText("obj3", text, xPos, yPos, VerticalAlignment.Center, HorizontalAlignment.Left,Colors.White); yPos = _simpleMovingAverage4.Result[index]; text = String.Format("{0}", Math.Round(yPos, Symbol.Digits)); ChartObjects.DrawText("obj4", text, xPos, yPos, VerticalAlignment.Top, HorizontalAlignment.Left, Colors.Aqua); yPos = _simpleMovingAverage5.Result[index]; text = String.Format("{0}", Math.Round(yPos, Symbol.Digits)); ChartObjects.DrawText("obj5", text, xPos, yPos, VerticalAlignment.Top, HorizontalAlignment.Left, Colors.Blue); yPos = _simpleMovingAverage6.Result[index]; text = String.Format("{0}", Math.Round(yPos, Symbol.Digits)); ChartObjects.DrawText("obj6", text, xPos, yPos, VerticalAlignment.Top, HorizontalAlignment.Left,Colors.Orange); yPos = _simpleMovingAverage7.Result[index]; text = String.Format("{0}", Math.Round(yPos, Symbol.Digits)); ChartObjects.DrawText("obj7", text, xPos, yPos, VerticalAlignment.Top, HorizontalAlignment.Left, Colors.Red); }
Multi-time frames will be supported in the future.
Thank You Support
Works just like I wanted.
@Scott
admin
09 Jan 2013, 15:34
Thank you for the suggestion. If you need a horizontal line it is easily implemented by either using the Levels attribute for indicators or setting a constant value to an Outpout Indicator Result, e.g.
[Output("Main")] public IndicatorDataSeries Result { get; set; } public override void Calculate(int index) { Result[index] = 1; }@admin