cTrader Copy Signal DrawDown transparency

cTrader Copy Signal DrawDown transparency
16 Jan 2020, 13:17
Please add to cTrader Copy so that investors can evaluate the risks transparently : local max balance - local min equity + withdrawal - deposit = balance-equity drawdown
Please make it visible the same way as ROI : all time, monthly, weekly, etc. on the additional tab as independed chart where ROI and Equity charts are visualized.
Available equity curve does not provide full transparency of risk assosiated to the signal. Deposits, withdrawals can hide the risk if signal providor keeps constant balance on account.
Thank you.
Replies
Tj11
09 Mar 2020, 15:55
( Updated at: 21 Dec 2023, 09:21 )
RE:
Tj11 said:
Panagiotis,
This is screenshot from "Relax" signal in cTrader Copy.
What does Min Equity mean on red arrow 0.15$ ?
Does it mean that investors burned ?
And at the same time maximal balance dd is 20%.
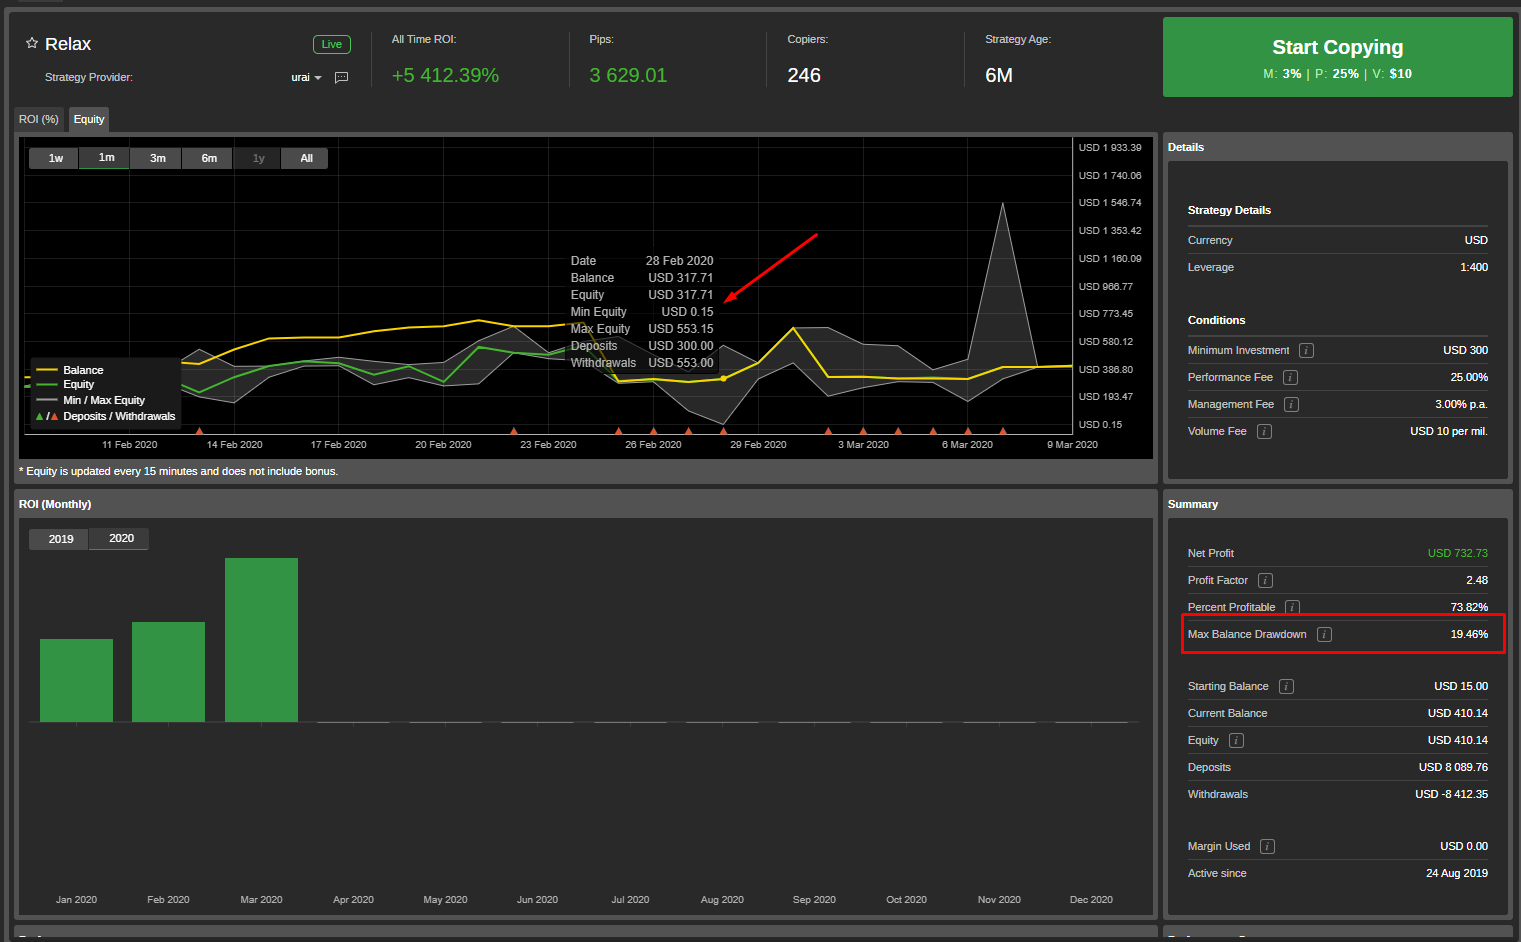
Or does it mean that he withdraw 553$ and then deposit back 300$ ? Looks like this is the case.....
@Tj11
PanagiotisCharalampous
09 Mar 2020, 16:31
Hi Tj11,
Green and Red arrows indicate deposits and withdrawals respectively. See the legend.
Best Regards,
Panagiotis
@PanagiotisCharalampous
Tj11
09 Mar 2020, 16:56
RE:
PanagiotisCharalampous said:
Hi Tj11,
Green and Red arrows indicate deposits and withdrawals respectively. See the legend.
Best Regards,
Panagiotis
Panagiotis,
Sorry for beeing indirect. I wanted to say that the risk assosiated to copy the signal is hidden or not clear.
Adding : local max balance - local min equity + withdrawal - deposit = balance-equity drawdown
would make Copy transparent for investors.
Cheers
@Tj11
ctid1909657
29 Mar 2020, 19:54
RE:
PanagiotisCharalampous said:
Hi Tj11,
Green and Red arrows indicate deposits and withdrawals respectively. See the legend.
Best Regards,
Panagiotis
A true DD is highest Equity to the lowest Equity after how long we don't hit an other Equity Peak all other DD calculation made no sense and are not true. Equity is that i have in the Pocket. Why the don't made an real Performance Chart on Equity (Deposits and Withdrawals will not affect the true Performance also not the DD). Then all can see real Performance and real Drawdown.
@ctid1909657
... Deleted by UFO ...
wallacewebster60
10 Jun 2020, 11:39
Thank you so much for sharing such a useful information. I will definitely share this with others.
@wallacewebster60
Shares4us
05 Dec 2020, 12:31
RE: RE:
ctid1909657 said:
PanagiotisCharalampous said:
Hi Tj11,
Green and Red arrows indicate deposits and withdrawals respectively. See the legend.
Best Regards,
Panagiotis
A true DD is highest Equity to the lowest Equity after how long we don't hit an other Equity Peak all other DD calculation made no sense and are not true. Equity is that i have in the Pocket. Why the don't made an real Performance Chart on Equity (Deposits and Withdrawals will not affect the true Performance also not the DD). Then all can see real Performance and real Drawdown.
Finally someone that understand the meaning an way of checking DrawDown.
IT is a must-have for traders so it should be available in cTrader Copy!
@Shares4us
Tj11
09 Mar 2020, 15:53
Panagiotis,
This is screenshot from "Relax" signal in cTrader Copy.
What does Min Equity mean on red arrow 0.15$ ?
Does it mean that investors burned ?
And at the same time maximal balance dd is 20%.
@Tj11