'display anywhere' charts for cTrader
09 Nov 2013, 03:50
I've been using cTrader for about 11 months and watched as new features are added such as multiform and so-called free chart.
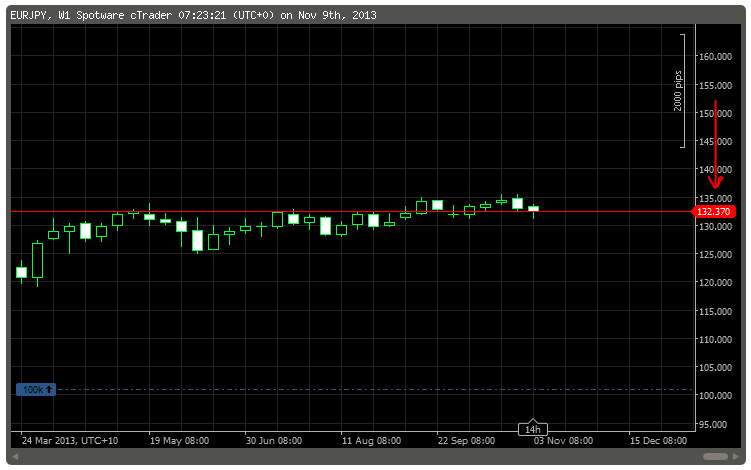
What I need to see is a true free chart that allows you to extrapolate trends into the future instead of the currently ridiculous 1 inch blank area to the right for future pip movements. eg, on an hourly chart, lucky if you can get 3 more hours of blank when i'm interested in a 24 hour movement (please don't tell me to use the daily chart instead, it would indicate that you gentlemen don't actually use your product)
One particularly annoying aspect of this is you generally can't see the result of a deal map because there's no place to display the closing position details!
Another annoyance is in sell positions you can be at bottom of screen and unable to look below the current candle because it's at, bottom of screen. (to get round that, I add or remove the tick volume). The mere fact that I can do that manually means your code can very easily accommodate free movement of the entire display since that's exactly what it's doing for the ticks.
I am using cTrader to enter positions but have to resort to FXCM to get a feel for where the trends are.
I mean come on gentlemen, this isn't rocket science.
Replies
Kate
09 Nov 2013, 09:28
( Updated at: 21 Dec 2023, 09:20 )
RE:
mikero said:
Another annoyance is in sell positions you can be at bottom of screen and unable to look below the current candle because it's at, bottom of screen. (to get round that, I add or remove the tick volume). The mere fact that I can do that manually means your code can very easily accommodate free movement of the entire display since that's exactly what it's doing for the ticks.
You can also squeeze chart dragging price-axis up and down:

@Kate

Kate
09 Nov 2013, 09:08 ( Updated at: 21 Dec 2023, 09:20 )
RE:
mikero said:
Do you know that you can drag bar-timer to the left to increase blank area?
@Kate