Chart Error when setting IsOverlay to false

Chart Error when setting IsOverlay to false
15 Jan 2016, 19:43
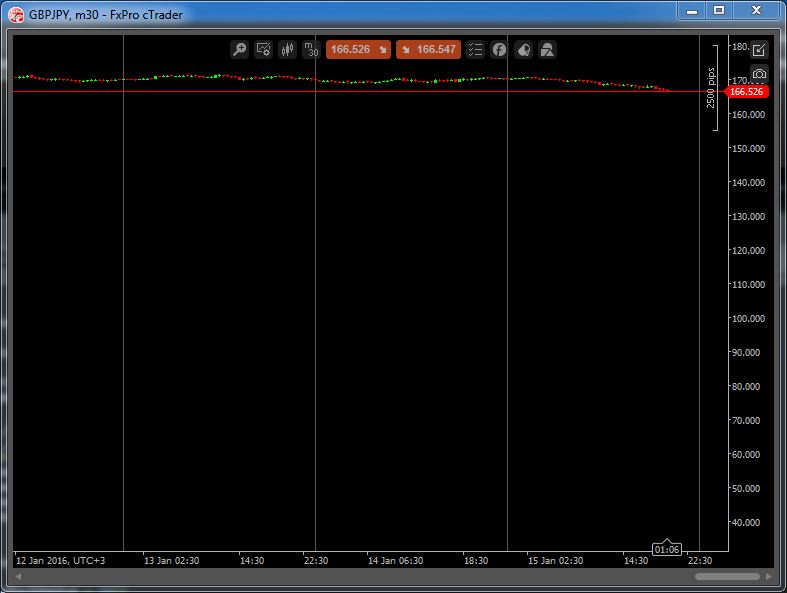
What could be the problem whenever I set IsOverlay to false, the chart looks like below. I cannot reset it to its normal form. any ideas?
Indicator(IsOverlay = false, AccessRights = AccessRights.None)]
Replies
mikepecson72
15 Jan 2016, 20:04
thanks spotware for your quick reply.
basically I have an indicator that is working fine when loaded as false by default:
[Indicator(IsOverlay = false, AccessRights = AccessRights.None)]
but because I want to see a visual clue on the price action when a crossover happen so I added a chart object drawtext on the code thats responsible for the crossover:
ChartObjects.DrawText("sell", "*", index, MarketSeries.High[index], VerticalAlignment.Top, HorizontalAlignment.Center, Colors.Magenta);
now since the IsOverlay is set to false, the chart object drawtext is not visible on the chart. thats why I set it to true:
[Indicator(IsOverlay = true, AccessRights = AccessRights.None)]
and things go wacky. seems like the timescale of the chart was stretched and I cannot return it to its normal scale. what could be the problem?
@mikepecson72
mikepecson72
15 Jan 2016, 20:06
thanks spotware for your quick reply.
basically I have an indicator that is working fine when loaded as false by default:
[Indicator(IsOverlay = false, AccessRights = AccessRights.None)]
but because I want to see a visual clue on the price action when a crossover happen so I added a chart object drawtext on the code thats responsible for the crossover:
ChartObjects.DrawText("sell", "*", index, MarketSeries.High[index], VerticalAlignment.Top, HorizontalAlignment.Center, Colors.Magenta);
now since the IsOverlay is set to false, the chart object drawtext is not visible on the chart. thats why I set it to true:
[Indicator(IsOverlay = true, AccessRights = AccessRights.None)]
and things go wacky. seems like the timescale of the chart was stretched and I cannot return it to its normal scale. what could be the problem?
@mikepecson72
Spotware
18 Jan 2016, 10:13
Dear Trader,
The issue is that the values of the indicator are not equal to the Symbol prices. Most probably the values of the indicator are significantly lower than the actual price values. That's why your chart is shown as per the attached screenshot above and you don't see any indicator lines.
@Spotware
mikepecson72
18 Jan 2016, 10:34
Dear Spotware,
I intentionally hide the indicator as I dont want it to be seen in the chart. I just need the chart object draw text to be displayed on the screen (not the indicator). I can display the indicator but still the same problem occurs. What do you think is causing the issue?
@mikepecson72
aarongeorge380
02 Feb 2018, 12:44
RE: Chart Error when setting IsOverlay to false
mikepecson72 said:
Dear Spotware,
I intentionally hide the indicator as I dont want it to be seen in the chart. I just need the chart object draw text to be displayed on the screen (not the indicator). I can display the indicator but still the same problem occurs. What do you think is causing the issue?
Hi mikepecson72,
You've probably worked it out by now, but I had the same problem, and have been scanning through some of the posts. The problem solved for me if I added the following code at the start of the indicator: AutoRescale = false.
As per below:
namespace cAlgo
{
[Indicator(IsOverlay = true, AutoRescale = false, TimeZone = TimeZones.UTC, AccessRights = AccessRights.None)]
Hope this might work for you if your still stuck.
@aarongeorge380
Spotware
15 Jan 2016, 19:53
Dear Trader,
Could you please provide us with more information regarding your issue?
@Spotware