Help with Real Time Indicator


Help with Real Time Indicator
06 Apr 2013, 19:33
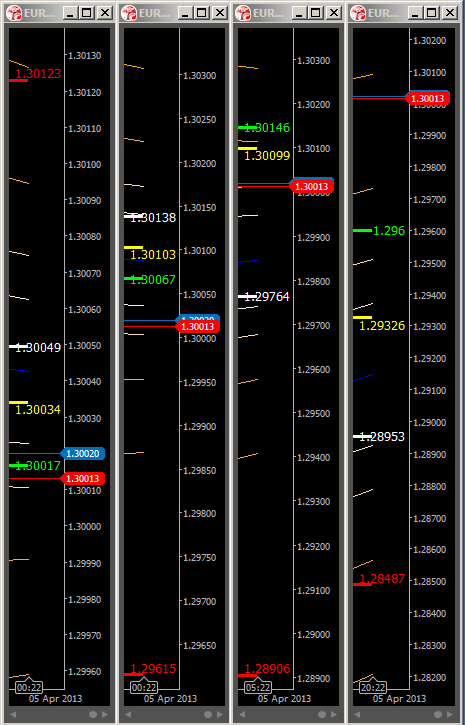
Hi Support please could you make the Fibonacci Bands indicator /algos/show/190 a Real Time indicator like you did for my multiple SMA indicator, I'm after the same functionality as the SMA. Below is the example of the SMA indicator and its code
using System;
using cAlgo.API;
using cAlgo.API.Indicators;
namespace cAlgo.Indicators
{
[Indicator(IsOverlay = true)]
public class FibGrid7Chart : Indicator
{
[Parameter]
public DataSeries Source { get; set; }
[Parameter("L1", DefaultValue = 21)]
public int Periods { get; set; }
[Parameter("L2", DefaultValue = 34)]
public int Periods2 { get; set; }
[Parameter("L3", DefaultValue = 55)]
public int Periods3 { get; set; }
[Parameter("L7", DefaultValue = 233)]
public int Periods7 { get; set; }
[Output("Level1", Color = Colors.Lime, Thickness = 3)]
public IndicatorDataSeries Result { get; set; }
[Output("Level2", Color = Colors.Yellow, Thickness = 3)]
public IndicatorDataSeries Result2 { get; set; }
[Output("Level3", Color = Colors.White, Thickness = 3)]
public IndicatorDataSeries Result3 { get; set; }
[Output("Level7", Color = Colors.Red, Thickness = 3)]
public IndicatorDataSeries Result7 { get; set; }
private SimpleMovingAverage _simpleMovingAverage1;
private SimpleMovingAverage _simpleMovingAverage2;
private SimpleMovingAverage _simpleMovingAverage3;
private SimpleMovingAverage _simpleMovingAverage7;
protected override void Initialize()
{
_simpleMovingAverage1 = Indicators.SimpleMovingAverage(Source, Periods);
_simpleMovingAverage2 = Indicators.SimpleMovingAverage(Source, Periods2);
_simpleMovingAverage3 = Indicators.SimpleMovingAverage(Source, Periods3);
_simpleMovingAverage7 = Indicators.SimpleMovingAverage(Source, Periods7);
}
public override void Calculate(int index)
{
if (!IsRealTime) return;
for (int i = index - 10; i <= index; i++)
{
Result[i] = _simpleMovingAverage1.Result[index];
Result2[i] = _simpleMovingAverage2.Result[index];
Result3[i] = _simpleMovingAverage3.Result[index];
Result7[i] = _simpleMovingAverage7.Result[index];
}
for(int i = 0; i < index - 10; i++)
{
Result[i] = double.NaN;
Result2[i] = double.NaN;
Result3[i] = double.NaN;
Result7[i] = double.NaN;
}
int xPos = index + 1;
double yPos = _simpleMovingAverage1.Result[index];
var text = String.Format("{0}", Math.Round(yPos, Symbol.Digits));
ChartObjects.DrawText("obj1", text, xPos, yPos, VerticalAlignment.Center, HorizontalAlignment.Left,Colors.Lime);
yPos = _simpleMovingAverage2.Result[index];
text = String.Format("{0}", Math.Round(yPos, Symbol.Digits));
ChartObjects.DrawText("obj2", text, xPos, yPos, VerticalAlignment.Bottom, HorizontalAlignment.Left,Colors.Yellow);
yPos = _simpleMovingAverage3.Result[index];
text = String.Format("{0}", Math.Round(yPos, Symbol.Digits));
ChartObjects.DrawText("obj3", text, xPos, yPos, VerticalAlignment.Center, HorizontalAlignment.Left,Colors.White);
yPos = _simpleMovingAverage7.Result[index];
text = String.Format("{0}", Math.Round(yPos, Symbol.Digits));
ChartObjects.DrawText("obj7", text, xPos, yPos, VerticalAlignment.Top, HorizontalAlignment.Left, Colors.Red);
}
}
}
Thank You
Replies
Scott
08 Apr 2013, 17:44
( Updated at: 21 Dec 2023, 09:20 )
RE:
Is this what you need? If you need help understanding the code please let us know. We are here to help you learn cAlgo in order to build powerful indicators and robots.
//#reference: AverageTrueRange.algo

using System;
using cAlgo.API;
using cAlgo.API.Indicators;

namespace cAlgo.Indicators
{
    [Indicator(IsOverlay = true)]
    public class FibGrid7Chart : Indicator
    {
        private AverageTrueRange _averageTrueRange;
        private ExponentialMovingAverage _exponentialMovingAverage;

        [Parameter(DefaultValue = 55)]
        public int PeriodEma { get; set; }

        [Parameter(DefaultValue = 21)]
        public int PeriodAtr { get; set; }

        [Output("Upper Band 1", Color = Colors.DarkCyan)]
        public IndicatorDataSeries UpperBand1 { get; set; }

        [Output("Upper Band 2", Color = Colors.DarkCyan)]
        public IndicatorDataSeries UpperBand2 { get; set; }

        [Output("Upper Band 3", Color = Colors.DarkCyan)]
        public IndicatorDataSeries UpperBand3 { get; set; }

        [Output("Upper Band 4", Color = Colors.DarkCyan)]
        public IndicatorDataSeries UpperBand4 { get; set; }

        [Output("Lower Band 1", Color = Colors.DarkGreen)]
        public IndicatorDataSeries LowerBand1 { get; set; }

        [Output("Lower Band 2", Color = Colors.DarkGreen)]
        public IndicatorDataSeries LowerBand2 { get; set; }

        [Output("Lower Band 3", Color = Colors.DarkGreen)]
        public IndicatorDataSeries LowerBand3 { get; set; }

        [Output("Lower Band 4", Color = Colors.DarkGreen)]
        public IndicatorDataSeries LowerBand4 { get; set; }

        [Output("EMA", Color = Colors.Blue)]
        public IndicatorDataSeries Ema { get; set; }

        protected override void Initialize()
        {
            _averageTrueRange = Indicators.GetIndicator<AverageTrueRange>(PeriodAtr);
            _exponentialMovingAverage = Indicators.ExponentialMovingAverage(MarketSeries.Close, PeriodEma);
        }


        public override void Calculate(int index)
        {
            if (!IsRealTime) return;

            for (int i = index - 10; i <= index; i++)
            {
                double ema = _exponentialMovingAverage.Result[index];
                double atr = _averageTrueRange.Result[index];

                UpperBand1[i] = ema + 1.62*atr;
                UpperBand2[i] = ema + 2.62*atr;
                UpperBand3[i] = ema + 4.23*atr;
                UpperBand4[i] = ema + 1*atr;
                LowerBand1[i] = ema - 1.62*atr;
                LowerBand2[i] = ema - 2.62*atr;
                LowerBand3[i] = ema - 4.23*atr;
                LowerBand4[i] = ema - 1*atr;

                Ema[i] = ema;
            }
            for (int i = 0; i < index - 10; i++)
            {
                UpperBand1[i] = double.NaN;
                UpperBand2[i] = double.NaN;
                UpperBand3[i] = double.NaN;
                UpperBand4[i] = double.NaN;
                LowerBand1[i] = double.NaN;
                LowerBand2[i] = double.NaN;
                LowerBand3[i] = double.NaN;
                LowerBand4[i] = double.NaN;

                Ema[i] = double.NaN;
            }

            int xPos = index + 1;
            double yPos = UpperBand1[index];
            string text = String.Format("{0}", Math.Round(yPos, Symbol.Digits));
            ChartObjects.DrawText("obj1", text, xPos, yPos, VerticalAlignment.Top, HorizontalAlignment.Left, Colors.Lime);

            yPos = UpperBand2[index];
            text = String.Format("{0}", Math.Round(yPos, Symbol.Digits));
            ChartObjects.DrawText("obj2", text, xPos, yPos, VerticalAlignment.Top, HorizontalAlignment.Left,
                                  Colors.Yellow);

            yPos = UpperBand3[index];
            text = String.Format("{0}", Math.Round(yPos, Symbol.Digits));
            ChartObjects.DrawText("obj3", text, xPos, yPos, VerticalAlignment.Top, HorizontalAlignment.Left,
                                  Colors.White);

            yPos = UpperBand4[index];
            text = String.Format("{0}", Math.Round(yPos, Symbol.Digits));
            ChartObjects.DrawText("obj4", text, xPos, yPos, VerticalAlignment.Top, HorizontalAlignment.Left, Colors.Red);

            yPos = LowerBand1[index];
            text = String.Format("{0}", Math.Round(yPos, Symbol.Digits));
            ChartObjects.DrawText("obj5", text, xPos, yPos, VerticalAlignment.Top, HorizontalAlignment.Left, Colors.Lime);
            yPos = LowerBand2[index];
            text = String.Format("{0}", Math.Round(yPos, Symbol.Digits));
            ChartObjects.DrawText("obj6", text, xPos, yPos, VerticalAlignment.Top, HorizontalAlignment.Left,
                                  Colors.Yellow);
            yPos = LowerBand3[index];
            text = String.Format("{0}", Math.Round(yPos, Symbol.Digits));
            ChartObjects.DrawText("obj7", text, xPos, yPos, VerticalAlignment.Top, HorizontalAlignment.Left,
                                  Colors.White);
            yPos = LowerBand4[index];
            text = String.Format("{0}", Math.Round(yPos, Symbol.Digits));
            ChartObjects.DrawText("obj8", text, xPos, yPos, VerticalAlignment.Top, HorizontalAlignment.Left, Colors.Red);

            yPos = Ema[index];
            text = String.Format("{0}", Math.Round(yPos, Symbol.Digits));
            ChartObjects.DrawText("obj9", text, xPos, yPos, VerticalAlignment.Top, HorizontalAlignment.Left, Colors.Blue);
        }
    }
}
Consider uploading this as well as the previous indicator to the Indicators section as a courtesy to the rest of the developers community.
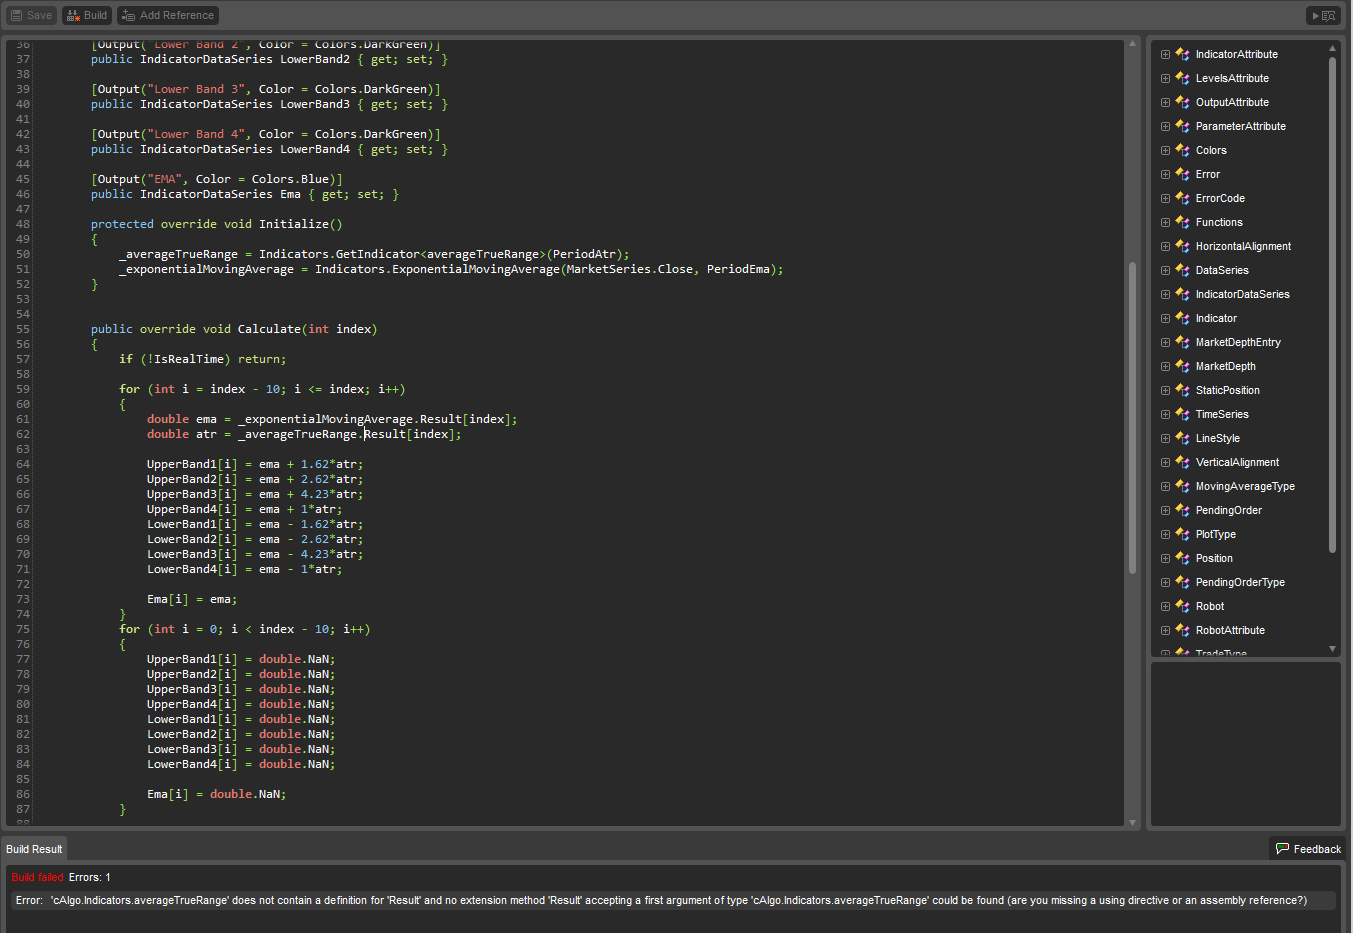
Hi Support thanks for getting this done for me so quick, but there is a problem with it building on line 62 screen shot below, I have also altered on lines 12+50 AverageTrueRange to averageTruRange (I did this with the fibonacci bands and it worked) I don't know if its missing some code, the SMA Indicator is constructed slightly differently. I will also upload all 3 of the indicators you have done for me. Thanks
@Scott
cAlgo_Fanatic
08 Apr 2013, 18:02
Depending on which is the AverageTrueRange indicator that you downloaded (you need to check that code) you may need to replace Result (in this indicator ) with either atr or ATR.
You need to check the name of the Output IndicatorDataSeries property.
i.e.
[Output("Average True Range", Color = Colors.Blue)]
public IndicatorDataSeries ATR { get; set; }
Or change the name of the AverageTrueRange indicator Output property to Result and rebuild it.
@cAlgo_Fanatic
Scott
08 Apr 2013, 18:30
RE:
Depending on which is the AverageTrueRange indicator that you downloaded (you need to check that code) you may need to replace Result (in this indicator ) with either atr or ATR.
You need to check the name of the Output IndicatorDataSeries property.
i.e.
[Output("Average True Range", Color = Colors.Blue)] public IndicatorDataSeries ATR { get; set; }
Or change the name of the AverageTrueRange indicator Output property to Result and rebuild it.
Thanks changing line 62 to averageTrueRange.atr worked
@Scott
Scott
08 Apr 2013, 21:32
( Updated at: 21 Dec 2023, 09:20 )
Visual Improvements
Hi Support, One of the problems visually is crouding of the numbers, is there a way to have the real time SMA 21,34,55 and 233 show over the real time fibonacci bands for example highlight text/numbers background so that its black but only apply this to the SMA.
The SMA Lines would also have to override any fibonacci bands, and one last thing if possible if the prevous things can be done can the space between the fibonacci band levels be shaded between each other, this would also mean that the fib bands would need there price background highlighted yet still be overidden by SMA Levels
Thanks
@Scott
Scott
08 Apr 2013, 23:47
( Updated at: 21 Dec 2023, 09:20 )
RE: Visual Improvements update
I've made a few changes but would still be intrested in the the above changes, the bid and ask price would benifit massively from being in a larger font, or detachable Level 2 boxes
New style Fibonacci Indicator
@Scott
cAlgo_Fanatic
09 Apr 2013, 10:54
Hi,
It is not possible yet to highlight the background or shade an area on the chart. It will be implemented in the future.
@cAlgo_Fanatic
cAlgo_Fanatic
08 Apr 2013, 10:48
Is this what you need? If you need help understanding the code please let us know. We are here to help you learn cAlgo in order to build powerful indicators and robots.
//#reference: AverageTrueRange.algo

using System;
using cAlgo.API;
using cAlgo.API.Indicators;

namespace cAlgo.Indicators
{
    [Indicator(IsOverlay = true)]
    public class FibGrid7Chart : Indicator
    {
        private AverageTrueRange _averageTrueRange;
        private ExponentialMovingAverage _exponentialMovingAverage;

        [Parameter(DefaultValue = 55)]
        public int PeriodEma { get; set; }

        [Parameter(DefaultValue = 21)]
        public int PeriodAtr { get; set; }

        [Output("Upper Band 1", Color = Colors.DarkCyan)]
        public IndicatorDataSeries UpperBand1 { get; set; }

        [Output("Upper Band 2", Color = Colors.DarkCyan)]
        public IndicatorDataSeries UpperBand2 { get; set; }

        [Output("Upper Band 3", Color = Colors.DarkCyan)]
        public IndicatorDataSeries UpperBand3 { get; set; }

        [Output("Upper Band 4", Color = Colors.DarkCyan)]
        public IndicatorDataSeries UpperBand4 { get; set; }

        [Output("Lower Band 1", Color = Colors.DarkGreen)]
        public IndicatorDataSeries LowerBand1 { get; set; }

        [Output("Lower Band 2", Color = Colors.DarkGreen)]
        public IndicatorDataSeries LowerBand2 { get; set; }

        [Output("Lower Band 3", Color = Colors.DarkGreen)]
        public IndicatorDataSeries LowerBand3 { get; set; }

        [Output("Lower Band 4", Color = Colors.DarkGreen)]
        public IndicatorDataSeries LowerBand4 { get; set; }

        [Output("EMA", Color = Colors.Blue)]
        public IndicatorDataSeries Ema { get; set; }

        protected override void Initialize()
        {
            _averageTrueRange = Indicators.GetIndicator<AverageTrueRange>(PeriodAtr);
            _exponentialMovingAverage = Indicators.ExponentialMovingAverage(MarketSeries.Close, PeriodEma);
        }


        public override void Calculate(int index)
        {
            if (!IsRealTime) return;

            for (int i = index - 10; i <= index; i++)
            {
                double ema = _exponentialMovingAverage.Result[index];
                double atr = _averageTrueRange.Result[index];

                UpperBand1[i] = ema + 1.62*atr;
                UpperBand2[i] = ema + 2.62*atr;
                UpperBand3[i] = ema + 4.23*atr;
                UpperBand4[i] = ema + 1*atr;
                LowerBand1[i] = ema - 1.62*atr;
                LowerBand2[i] = ema - 2.62*atr;
                LowerBand3[i] = ema - 4.23*atr;
                LowerBand4[i] = ema - 1*atr;

                Ema[i] = ema;
            }
            for (int i = 0; i < index - 10; i++)
            {
                UpperBand1[i] = double.NaN;
                UpperBand2[i] = double.NaN;
                UpperBand3[i] = double.NaN;
                UpperBand4[i] = double.NaN;
                LowerBand1[i] = double.NaN;
                LowerBand2[i] = double.NaN;
                LowerBand3[i] = double.NaN;
                LowerBand4[i] = double.NaN;

                Ema[i] = double.NaN;
            }

            int xPos = index + 1;
            double yPos = UpperBand1[index];
            string text = String.Format("{0}", Math.Round(yPos, Symbol.Digits));
            ChartObjects.DrawText("obj1", text, xPos, yPos, VerticalAlignment.Top, HorizontalAlignment.Left, Colors.Lime);

            yPos = UpperBand2[index];
            text = String.Format("{0}", Math.Round(yPos, Symbol.Digits));
            ChartObjects.DrawText("obj2", text, xPos, yPos, VerticalAlignment.Top, HorizontalAlignment.Left,
                                  Colors.Yellow);

            yPos = UpperBand3[index];
            text = String.Format("{0}", Math.Round(yPos, Symbol.Digits));
            ChartObjects.DrawText("obj3", text, xPos, yPos, VerticalAlignment.Top, HorizontalAlignment.Left,
                                  Colors.White);

            yPos = UpperBand4[index];
            text = String.Format("{0}", Math.Round(yPos, Symbol.Digits));
            ChartObjects.DrawText("obj4", text, xPos, yPos, VerticalAlignment.Top, HorizontalAlignment.Left, Colors.Red);

            yPos = LowerBand1[index];
            text = String.Format("{0}", Math.Round(yPos, Symbol.Digits));
            ChartObjects.DrawText("obj5", text, xPos, yPos, VerticalAlignment.Top, HorizontalAlignment.Left, Colors.Lime);
            yPos = LowerBand2[index];
            text = String.Format("{0}", Math.Round(yPos, Symbol.Digits));
            ChartObjects.DrawText("obj6", text, xPos, yPos, VerticalAlignment.Top, HorizontalAlignment.Left,
                                  Colors.Yellow);
            yPos = LowerBand3[index];
            text = String.Format("{0}", Math.Round(yPos, Symbol.Digits));
            ChartObjects.DrawText("obj7", text, xPos, yPos, VerticalAlignment.Top, HorizontalAlignment.Left,
                                  Colors.White);
            yPos = LowerBand4[index];
            text = String.Format("{0}", Math.Round(yPos, Symbol.Digits));
            ChartObjects.DrawText("obj8", text, xPos, yPos, VerticalAlignment.Top, HorizontalAlignment.Left, Colors.Red);

            yPos = Ema[index];
            text = String.Format("{0}", Math.Round(yPos, Symbol.Digits));
            ChartObjects.DrawText("obj9", text, xPos, yPos, VerticalAlignment.Top, HorizontalAlignment.Left, Colors.Blue);
        }
    }
}
Consider uploading this as well as the previous indicator to the Indicators section as a courtesy to the rest of the developers community.
@cAlgo_Fanatic