MTF Custom Indicator

MTF Custom Indicator
24 Apr 2025, 23:17
Hello everyone thank you for your help.
I have spent a few hours debugging this but I still can't find a fix.
I have developed a custom Indicator and I want to create another Inidicator that will be a panel that will show if for each timeframe the last close is above or below the “centerline” made by the initial custom indicator.
I have tried two options :
1) Added the indicator as a reference + Indicators.GetIndicator<SwingPoints>(barsH4, Period, true, true, true, 10, 10, Color.White, Color.White). All the output values from the indicator are NaN.
2) Rewriting the full code into this new indicator Panel but it works only on the current timeframe the indicator is set on. I am guessing it is due to Calculate(index) that only calculates based on the current timeframe candles.
Codes provided below :
INITIAL SWINGPOINT INDICATOR using System;
using System.Collections.Generic;
using System.Diagnostics.Metrics;
using cAlgo.API;
using cAlgo.API.Indicators;
using cAlgo.API.Internals;
namespace cAlgo
{
[Indicator(AccessRights = AccessRights.None, IsOverlay = true)]
public class SwingPoints : Indicator
{
[Parameter("Swing Point Period", DefaultValue = 5, MinValue = 1, MaxValue = 50)]
public int Period { get; set; }
[Parameter("Show Swing Points", DefaultValue = true)]
public bool ShowPivot { get; set; }
[Parameter("Show Center Line", DefaultValue = true)]
public bool ShowCenterLine { get; set; }
[Parameter("Show Support/Resistance", DefaultValue = true)]
public bool ShowSR { get; set; }
[Parameter("H pips above pivot", DefaultValue = 10)]
public int Hpips { get; set; }
[Parameter("L pips below pivot", DefaultValue = 10)]
public int Lpips { get; set; }
[Parameter("Res Colors", DefaultValue = "Yellow")]
public Color ResColors { get; set; }
[Parameter("Sup Colors", DefaultValue = "Blue")]
public Color SupColors { get; set; }
[Output("PivotHigh")]
public IndicatorDataSeries PivotHighSeries { get; set; }
[Output("PivotLow")]
public IndicatorDataSeries PivotLowSeries { get; set; }
[Output("Center Line")]
public IndicatorDataSeries CenterLine { get; set; }
private double lastPivotHigh = double.NaN;
private double lastPivotLow = double.NaN;
private string activeResLine = null;
private string activeSupLine = null;
private DateTime lastResTime;
private DateTime lastSupTime;
private double lastResPrice;
private double lastSupPrice;
protected override void Initialize()
{
CenterLine = CreateDataSeries();
PivotHighSeries = CreateDataSeries();
PivotLowSeries = CreateDataSeries();
}
public override void Calculate(int index)
{
if (index < Period * 2)
return;
int pivotIndex = index - Period;
bool isHigh = true;
for (int i = 1; i <= Period; i++)
{
if (Bars.HighPrices[pivotIndex] <= Bars.HighPrices[pivotIndex - i] ||
Bars.HighPrices[pivotIndex] <= Bars.HighPrices[pivotIndex + i])
{
isHigh = false;
break;
}
}
if (ShowCenterLine)
{
PivotHighSeries[index] = isHigh
? Bars.HighPrices[pivotIndex]
: double.NaN;
double lastPivotPoint = double.IsNaN(PivotHighSeries[index]) ? double.NaN : PivotHighSeries[index];
double prevCL = CenterLine[index - 1];
double currCL = double.IsNaN(prevCL)
? lastPivotPoint
: (double.IsNaN(lastPivotPoint)
? prevCL
: (prevCL * 2 + lastPivotPoint) / 3);
CenterLine[index] = currCL;
// 2. Only draw valid segments
if (!double.IsNaN(prevCL) && !double.IsNaN(currCL))
{
var clr = Bars.ClosePrices[index] > currCL
? SupColors : ResColors;
Chart.DrawTrendLine(
"ctrCL" + index,
Bars.OpenTimes[index - 1], prevCL,
Bars.OpenTimes[index], currCL,
clr, 2, LineStyle.Solid
);
}
}
}
}
}
PANEL INDICATOR : using System;
using System.Collections.Generic;
using System.Text;
using cAlgo.API;
namespace cAlgo
{
[Indicator(IsOverlay = true, AccessRights = AccessRights.None)]
public class MultiTimeframeSwingPanel : Indicator
{
[Parameter("Swing Point Period", DefaultValue = 5, MinValue = 1, MaxValue = 50)]
public int Period { get; set; }
private Dictionary<TimeFrame, double> CenterLine;
private (string Label, TimeFrame Tf)[] panelItems = new[]
{
("M1", TimeFrame.Minute),
("M5", TimeFrame.Minute5),
("M15", TimeFrame.Minute15),
("M30", TimeFrame.Minute30),
("H1", TimeFrame.Hour),
("H4", TimeFrame.Hour4),
("D1", TimeFrame.Daily),
("W1", TimeFrame.Weekly)
};
private SwingPoints swingM1, swingM5, swingM15, swingM30, swingH1, swingH4, swingD1, swingW1;
protected override void Initialize()
{
// Initialize all center‑lines to NaN
CenterLine = new Dictionary<TimeFrame, double>();
foreach (var (_, tf) in panelItems)
CenterLine[tf] = double.NaN;
}
public override void Calculate(int index)
{
var sb = new StringBuilder();
foreach (var (label, tf) in panelItems)
{
var tfBars = MarketData.GetBars(tf);
int count = tfBars.ClosePrices.Count;
// Need enough bars to compute a pivot at all
if (count <= Period * 2)
{
Print("Not enough bars to compute a pivot at all");
Print("Count: {0}, Period: {1}", count, Period);
sb.AppendLine($"{label}: –");
continue;
}
// pivotIndex for the last completed bar
int pivotIndex = count - 1 - Period;
// 1) Detect pivot high exactly like your SwingPoints
bool isHigh = true;
for (int i = 1; i <= Period; i++)
{
if (tfBars.HighPrices[pivotIndex] <= tfBars.HighPrices[pivotIndex - i] ||
tfBars.HighPrices[pivotIndex] <= tfBars.HighPrices[pivotIndex + i])
{
isHigh = false;
break;
}
}
// 2) Update that TF’s center‑line
double lastPivotPoint = isHigh
? tfBars.HighPrices[pivotIndex]
: double.NaN;
double prevCL = CenterLine[tf];
double currCL = double.IsNaN(prevCL)
? lastPivotPoint
: (double.IsNaN(lastPivotPoint)
? prevCL
: (prevCL * 2 + lastPivotPoint) / 3);
CenterLine[tf] = currCL;
// If we still don’t have a valid center‑line, show “–”
if (double.IsNaN(currCL))
{
Print("No valid center line for {0}", label);
sb.AppendLine($"{label}: –");
continue;
}
// 3) Compare the last **closed** bar’s close to currCL
double lastClose = tfBars.ClosePrices.Last(1);
bool bullish = lastClose > currCL;
string arrow = bullish ? "↑" : "↓";
sb.AppendLine($"{label}: {arrow}");
}
// Draw (or update) the single block of text
Chart.DrawStaticText(
"mtfPanel", // unique ID
sb.ToString(), // multi-line text
VerticalAlignment.Top, // from chart top
HorizontalAlignment.Left,// from chart left
Color.White // text color
// style
);
}
}
}
BASICALLY ASIDE From the current timeframe which gives the correct arrow; all the other ones give “-” value because currCL, prevCL, lastPivotPoint are all equal to NaN. Also sorry for the messy code it's just a messy tradingview indicator converted to ctrader for a client.
Thank you for your reply.
Best regards,
Jad
Replies
kabbajjad
08 May 2025, 17:35
RE: MTF Custom Indicator
firemyst said:
To start, you do need to get the Bars data for every other time frame you want that isn't the chart's timeframe:
Bars _marketSeries = MarketData.GetBars(SourceTimeFrame, Symbol.Name);
Then, in your calculate method, you need to get the latest information from that/those timeframe(s):
int altIndex = index;
if (Bars.TimeFrame != _marketSeries.TimeFrame)
{
altIndex = _marketSeries.OpenTimes.GetIndexByTime(Bars.OpenTimes[index]);
}
Then get the values you want using that altIndex Some examples with the moving average and standard deviation:
double maResultIndex = _movingAverage.Result[altIndex];
double sd = StandardDeviation * _standardDeviation.Result[altIndex];
Hello, Thank you for your response.
However I still have the same problem, could you tell me if that part of the code I added looks correct. The panel still gives me a correct value for the current Timeframe that I have on the chart but the values are wrong for the other Timeframes.
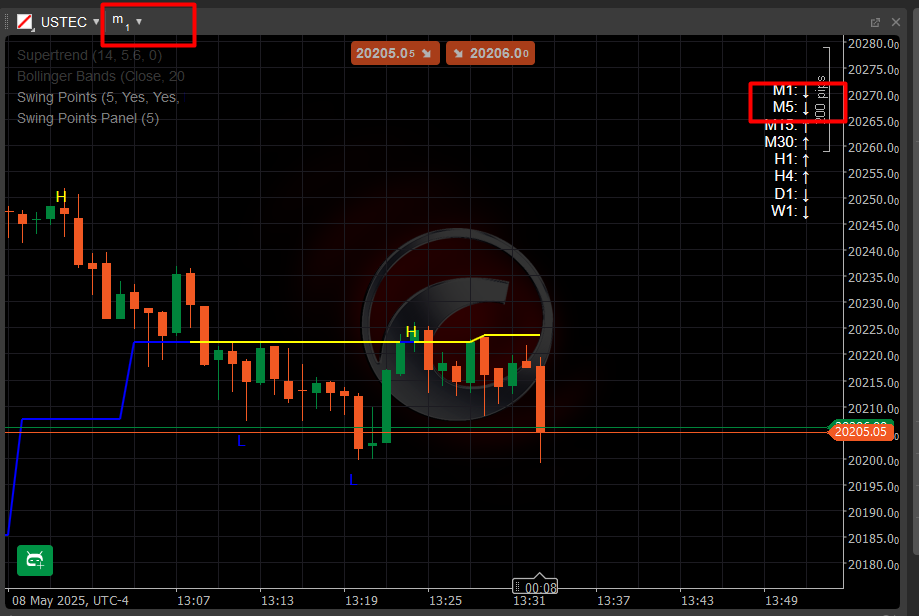
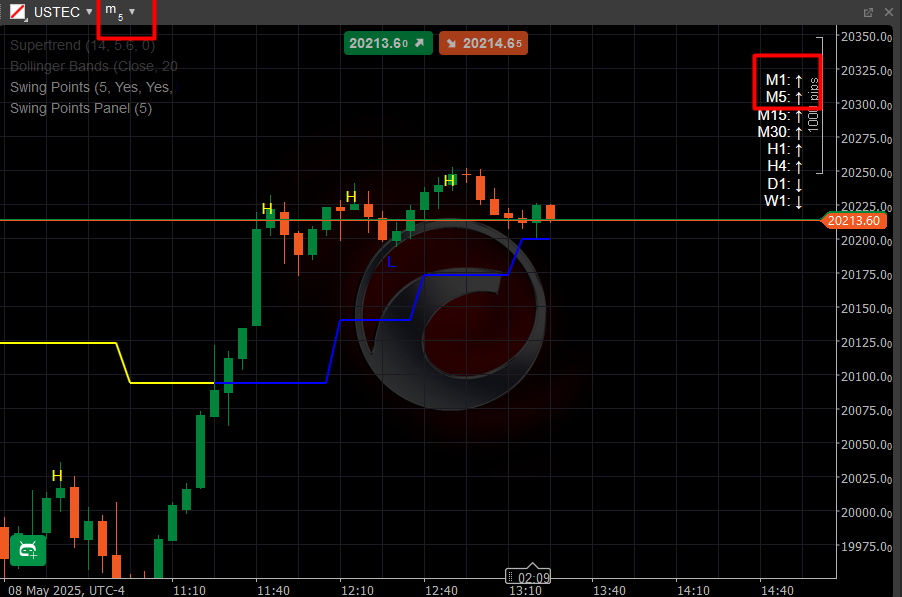
Ex : Image 1 (displayed on the 1m timeframe) we have a correct value for m1 but wrong value for m5 (arrow down that should be up). Image 2 I switched to m5 and you can see that now the arrow for m5 switched to bullish (correct value because price > blue line)
Here's my full code : using System;using System.Collections.Generic;using System.Text;using cAlgo.API;namespace cAlgo{ [Indicator(IsOverlay = true, AccessRights = AccessRights.None)] public class MultiTimeframeSwingPanel : Indicator { [Parameter("Swing Point Period", DefaultValue = 5, MinValue = 1, MaxValue = 50)] public int Period { get; set; } private Dictionary<TimeFrame, double> CenterLine; private Dictionary<Bars, string> TimeframeLabels; private Bars m1TF, m5TF, m15TF, m30TF, h1TF, h4TF, d1TF, w1TF; private string lastString; protected override void Initialize() { lastString = "start"; // Initialize all center‑lines to NaN CenterLine = new Dictionary<TimeFrame, double>(); m1TF = MarketData.GetBars(TimeFrame.Minute, Symbol.Name); m5TF = MarketData.GetBars(TimeFrame.Minute5, Symbol.Name); m15TF = MarketData.GetBars(TimeFrame.Minute15, Symbol.Name); m30TF = MarketData.GetBars(TimeFrame.Minute30, Symbol.Name); h1TF = MarketData.GetBars(TimeFrame.Hour, Symbol.Name); h4TF = MarketData.GetBars(TimeFrame.Hour4, Symbol.Name); d1TF = MarketData.GetBars(TimeFrame.Daily, Symbol.Name); w1TF = MarketData.GetBars(TimeFrame.Weekly, Symbol.Name); // Initialize timeframe labels TimeframeLabels = new Dictionary<Bars, string> { { m1TF, "M1" }, { m5TF, "M5" }, { m15TF, "M15" }, { m30TF, "M30" }, { h1TF, "H1" }, { h4TF, "H4" }, { d1TF, "D1" }, { w1TF, "W1" } }; // Initialize center lines foreach (var tf in TimeframeLabels.Keys) { CenterLine[tf.TimeFrame] = double.NaN; } } public override void Calculate(int index) { var sb = new StringBuilder(); foreach (var tfPair in TimeframeLabels) { var tfBars = tfPair.Key; var label = tfPair.Value; int altIndex = index; if (Bars.TimeFrame != tfBars.TimeFrame) { altIndex = tfBars.OpenTimes.GetIndexByTime(Bars.OpenTimes[index]); } int pivotIndex = altIndex - Period; // 1) Detect pivot high bool isHigh = true; for (int i = 1; i <= Period; i++) { if (tfBars.HighPrices[pivotIndex] <= tfBars.HighPrices[pivotIndex - i] || tfBars.HighPrices[pivotIndex] <= tfBars.HighPrices[pivotIndex + i]) { isHigh = false; break; } } // 2) Update that TF's center‑line double lastPivotPoint = isHigh ? tfBars.HighPrices[pivotIndex] : double.NaN; double prevCL = CenterLine[tfBars.TimeFrame]; double currCL = double.IsNaN(prevCL) ? lastPivotPoint : (double.IsNaN(lastPivotPoint) ? prevCL : (prevCL * 2 + lastPivotPoint) / 3); CenterLine[tfBars.TimeFrame] = currCL; double lastClose = tfBars.ClosePrices[altIndex]; bool bullish = lastClose > currCL; string arrow = bullish ? "↑" : "↓"; sb.AppendLine($"{label}: {arrow}"); } Chart.RemoveObject("mtfPanel"); Chart.DrawStaticText( "mtfPanel", sb.ToString(), VerticalAlignment.Top, HorizontalAlignment.Right, Color.White ); } }}
I appreciate your help !
Best regards,
Jad
@kabbajjad
firemyst
29 Apr 2025, 02:06
To start, you do need to get the Bars data for every other time frame you want that isn't the chart's timeframe:
Bars _marketSeries = MarketData.GetBars(SourceTimeFrame, Symbol.Name);
Then, in your calculate method, you need to get the latest information from that/those timeframe(s):
int altIndex = index;
if (Bars.TimeFrame != _marketSeries.TimeFrame)
{
altIndex = _marketSeries.OpenTimes.GetIndexByTime(Bars.OpenTimes[index]);
}
Then get the values you want using that altIndex Some examples with the moving average and standard deviation:
double maResultIndex = _movingAverage.Result[altIndex];
double sd = StandardDeviation * _standardDeviation.Result[altIndex];
@firemyst