EMA and MACD lines on the same Chart mess up each others positions

EMA and MACD lines on the same Chart mess up each others positions
03 Oct 2024, 12:23
I'm not sure if I'm doing something wrong, but I can't get MACD lines and an EMA 200 line on the same chart.
Here is how it looks like, the Red line above is EMA 200 and MACD and Signal lines are at the bottom. My arrows work fine.
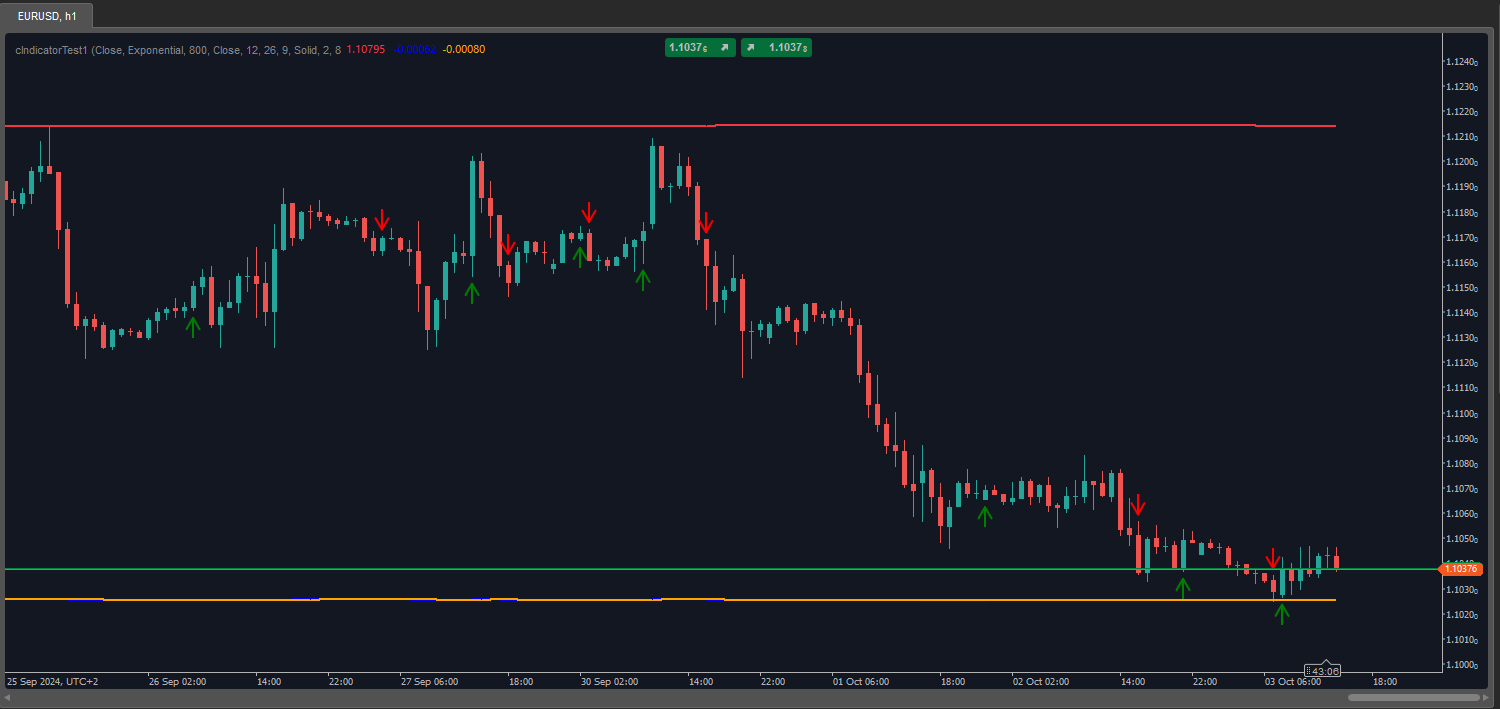
As soon I remove the line “TrendMa[index] = _trendMa.Result[index];” from the Calculate function it works normally.
Same goes for EMA. When I remove MACD, the EMA line is at the right place.
Here is the code without arrows, for better readability:
namespace cIndicatorTest1
{
    [Indicator(IsOverlay = false, TimeZone = TimeZones.UTC, AccessRights = AccessRights.FullAccess)]
    public class MainIndicator : Indicator
    {
        #region Trend Moving Average
        [Parameter("Source", Group = "Trend")]
        public DataSeries TrendSource { get; set; }

        [Parameter("MA Type", Group = "Trend", DefaultValue = MovingAverageType.Exponential)]
        public MovingAverageType TrendMaType { get; set; }

        [Parameter("MA Periods", Group = "Trend", DefaultValue = 200)]
        public int TrendMaPeriods { get; set; }

        [Output("Trend MA", LineColor = "#f23645", PlotType = PlotType.DiscontinuousLine, LineStyle = LineStyle.Solid, Thickness = 2)]
        public IndicatorDataSeries TrendMa { get; set; }

        private MovingAverage _trendMa;
        #endregion

        #region MACD
        [Parameter("Source", Group = "MACD")]
        public DataSeries MacdSource { get; set; }

        [Parameter("Fast Length", DefaultValue = 12, Group = "MACD", MinValue = 1)]
        public int FastLength { get; set; }

        [Parameter("Slow Length", DefaultValue = 26, Group = "MACD", MinValue = 1)]
        public int SlowLength { get; set; }

        [Parameter("Signal Smoothing", DefaultValue = 9, Group = "MACD", MinValue = 0)]
        public int SignalSmoothing { get; set; }

        [Output("MACD", LineColor = "Blue", PlotType = PlotType.DiscontinuousLine, LineStyle = LineStyle.Solid, Thickness = 2)]
        public IndicatorDataSeries MACDLine { get; set; }

        [Output("Signal", LineColor = "Orange", PlotType = PlotType.DiscontinuousLine, LineStyle = LineStyle.Solid, Thickness = 2)]
        public IndicatorDataSeries SignalLine { get; set; }

        private MacdCrossOver _macdCrossOver;
        #endregion

        protected override void Initialize()
        {
#if DEBUG
            Debugger.Launch();
#endif
            _trendMa = Indicators.MovingAverage(TrendSource, TrendMaPeriods, TrendMaType);
            _macdCrossOver = Indicators.MacdCrossOver(MacdSource, SlowLength, FastLength, SignalSmoothing);
        }

        public override void Calculate(int index)
        {
            if (_trendMa != null)
            {
                TrendMa[index] = _trendMa.Result[index];
            }

            if (_macdCrossOver == null)
            {
                return;
            }

            MACDLine[index] = _macdCrossOver.MACD[index];
            SignalLine[index] = _macdCrossOver.Signal[index];
        }
    }
}Replies
sborisov
04 Oct 2024, 11:51
That is not a bug. Indicators that you use have different scales:
- EMA is has values in the same scale as its source 1.107… in your example
- MACD is measured in 0.000smth
So, these 2 indicators can't have the same Y scale.
When you combine lines of these indicators in the same indicator, the cTrader considers it as single indicator and finds minimum and maximum visible values from all indicator lines and scale them accordingly.
To be honest, I don't see any reason in putting MACD to the main chart, but if you want to do that you can do it by adding 2 separate indicators to the same chart and to the same Panel.
@sborisov
applusplus
04 Oct 2024, 12:22
( Updated at: 04 Oct 2024, 12:24 )
RE: EMA and MACD lines on the same Chart mess up each others positions
sborisov said:
That is not a bug. Indicators that you use have different scales:
- EMA is has values in the same scale as its source 1.107… in your example
- MACD is measured in 0.000smth
So, these 2 indicators can't have the same Y scale.
When you combine lines of these indicators in the same indicator, the cTrader considers it as single indicator and finds minimum and maximum visible values from all indicator lines and scale them accordingly.
To be honest, I don't see any reason in putting MACD to the main chart, but if you want to do that you can do it by adding 2 separate indicators to the same chart and to the same Panel.
Thank you for your reply.
My idea was to make a custom Indicator, then use the Indicator in my cBot without replicating the same logic inside the bot.
Since the indicator suppose to create buy/sell signals based on EMA and MACD I wanted to draw all the lines, not only for better visualization but also so I can use all the Outputs from the custom indicator in the bot.
It's a real shame that I can't draw the same indicator in a panel and a chart at the same time or prevent “Output ”s from being drawn.
@applusplus
sborisov
04 Oct 2024, 12:28
If cTrader would draw indicator lines independently that will make signal like “line 1” crosses “line 2” phantom.
All indicator lines of the same indicator must be drawn in the same scale.
In your cBot you can use as many indicators as you want. That doesn't require you to combine several incompatible lines to the same indicator.
@sborisov
applusplus
04 Oct 2024, 12:32
RE: EMA and MACD lines on the same Chart mess up each others positions
sborisov said:
If cTrader would draw indicator lines independently that will make signal like “line 1” crosses “line 2” phantom.
All indicator lines of the same indicator must be drawn in the same scale.
In your cBot you can use as many indicators as you want. That doesn't require you to combine several incompatible lines to the same indicator.
I understand. Thanks for clarification.
The issue is then settled. I'll change my approach.
@applusplus
applusplus
03 Oct 2024, 15:19 ( Updated at: 03 Oct 2024, 17:26 )
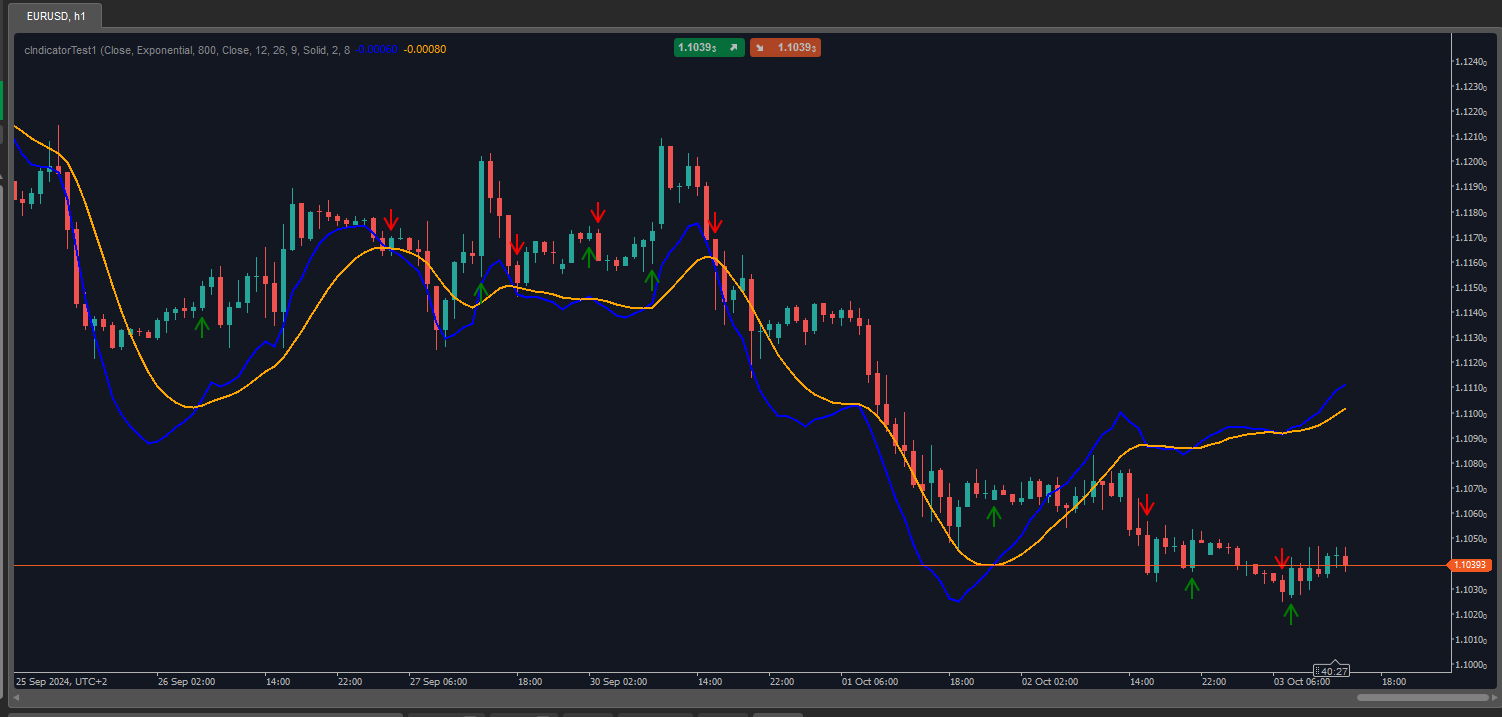
I just realized that my EMA is wrong. The Red line is my EMA from the code above. The Blue line is EMA 200 from default built-in indicator.
What is also extremely strange is that it changes when I move the chart, change the scale, etc.
EDIT: I've fixed EMA by completely removing the Indicator and reinstalling it, but the problem from the first post still exists. I'm developing it in Visual Studio and the current cTrader version is 5.0.38.
@applusplus