how to extend trendline to right?

how to extend trendline to right?
13 Jul 2024, 20:02
hello, Is there anyone know this kind of issue?
this indicator draws 5 trendlines. I want to make them right ray(extend).
I tried this
var line LRs[lr.Name].Children.Add(Chart.DrawTrendLine("Center " + lr.Name, start, pr1, end, pr2, Color.Blue, 1, LineStyle.DotsRare));
line .ExtendToInfinity = true;
But there is an error. How to solve this?
using System;
using cAlgo.API;
using cAlgo.API.Internals;
using cAlgo.API.Indicators;
using cAlgo.Indicators;
using System.Collections.Generic;

#pragma warning disable

namespace cAlgo.Indicators
{
    [Indicator(IsOverlay = true, AccessRights = AccessRights.None)]
    public class LinearRegressionChannel : Indicator
    {
        [Parameter("Projection Length", DefaultValue = 0)]
        public int ProjLength { get; set; }

        [Parameter("Center", DefaultValue = true)]
        public bool ShowCenter { get; set; }

        [Parameter("Channel", DefaultValue = true)]
        public bool ShowChannel { get; set; }

        [Parameter("Standard deviation", DefaultValue = true)]
        public bool ShowDeviantion { get; set; }

        public Dictionary<string, LR> LRs = new Dictionary<string, LR>();

        protected override void Initialize()
        {
            ///Add the button in the topleft corner
            Border border = new Border
            {
                VerticalAlignment = VerticalAlignment.Top,
                HorizontalAlignment = HorizontalAlignment.Right,
                Margin = "20 40 20 20",
                Width = 50,
                Child = new Toolbar(this)
            };

            Chart.AddControl(border);

            ///Events for calculating and drawing
            Chart.ObjectUpdated += OnChartObjectUpdated;
            Chart.ObjectRemoved += OnChartObjectRemoved;

            foreach (ChartObject o in Chart.Objects)
                if (o.Name.Length > 24 && o.Name.Substring(0, 24) == "LinearRegressionChannel " && o.IsInteractive && o.ObjectType == ChartObjectType.TrendLine)
                {
                    LRs.Add(o.Name, new LR((ChartTrendLine)o));
                    o.IsInteractive = false;
                    o.IsInteractive = true;
                }
        }

        void OnChartObjectRemoved(ChartObjectRemovedEventArgs obj)
        {
            try
            {
                if (IsCleaning)
                    return;
                RemoveAllObjectsConnectedWith(obj.ChartObject);
                if (LRs.ContainsKey(obj.ChartObject.Name))
                    LRs.Remove(obj.ChartObject.Name);
            } catch (Exception e)
            {
                Print(e);
                Print("Errore nella rimozione dell'oggetto");
            }
        }

        bool IsCleaning = false;

        void RemoveAllObjectsConnectedWith(ChartObject o)
        {
            if (LRs.ContainsKey(o.Name))
            {
                IsCleaning = true;
                for (int i = 0; i < LRs[o.Name].Children.Count; ++i)
                {
                    try
                    {
                        Chart.RemoveObject(LRs[o.Name].Children[i].Name);
                    } catch (Exception e)
                    {
                        Print(e);
                        continue;
                    }
                }
            }
            LRs[o.Name].Children.Clear();
            IsCleaning = false;
        }


        public override void Calculate(int index)
        {
        }

        void OnChartObjectUpdated(ChartObjectUpdatedEventArgs obj)
        {
            try
            {
                RemoveAllObjectsConnectedWith(obj.ChartObject);
                ///Check if object is a rectangle and if it's part of this indicator
                if (!LRs.ContainsKey(obj.ChartObject.Name))
                    return;

                ChartTrendLine lr = (ChartTrendLine)obj.ChartObject;

                // Linear regresion
                double sum_x = 0, sum_x2 = 0, sum_y = 0, sum_xy = 0, x_avg=0, x=0,x_sum_squared=0,stdDeviation=0;

                int start = Bars.OpenTimes.GetIndexByTime(lr.Time1);
                int end = Bars.OpenTimes.GetIndexByTime(lr.Time2);

                int length = Math.Abs(end - start);

                if (start > end)
                {
                    start = Bars.OpenTimes.GetIndexByTime(lr.Time2);
                    end = Bars.OpenTimes.GetIndexByTime(lr.Time1);
                }

                for (int i = start; i < end; i++)
                {
                    sum_x += 1.0 * i;
                    sum_x2 += 1.0 * i * i;
                    sum_y += Bars[i].Close;
                    sum_xy += Bars[i].Close * i;
                }

                double a = (length * sum_xy - sum_x * sum_y) / (length * sum_x2 - sum_x * sum_x);
                double b = (sum_y - a * sum_x) / length;

                // Calculate maximum and standard devaitions

                double maxUpperDeviation = 0, maxLowerDeviation = 0;
                double sumDevation = 0;

                for (int i = start; i < end; i++)
                {
                    double price = a * i + b;
                    x = Math.Abs(Bars[i].Close - price);
                    x_avg=(x_avg+x)/i;
                    x_sum_squared += (x - x_avg) * (x - x_avg);
                    maxUpperDeviation = Math.Max(Bars[i].Close - price, maxUpperDeviation);
                    maxLowerDeviation = Math.Min(Bars[i].Close - price, maxLowerDeviation);
                    stdDeviation=Math.Sqrt(x_sum_squared/(length - 1));

                }

                //double stdDeviation = Math.Sqrt(sumDevation / (length - 1));


                double pr1 = a * start + b;
                double pr2 = a * end + b;

                if (ShowCenter)
                {
                    LRs[lr.Name].Children.Add(Chart.DrawTrendLine("Center " + lr.Name, start, pr1, end, pr2, Color.Blue, 1, LineStyle.DotsRare));
                }

                if (ShowChannel)
                {
                    LRs[lr.Name].Children.Add(Chart.DrawTrendLine("Top " + lr.Name, start, pr1 + stdDeviation*2, end, pr2 + stdDeviation*2, Color.Blue, 1, LineStyle.DotsRare));
                    LRs[lr.Name].Children.Add(Chart.DrawTrendLine("Bottom " + lr.Name, start, pr1 - stdDeviation*2, end, pr2 - stdDeviation*2, Color.Blue, 1, LineStyle.DotsRare));
                }

                if (ShowDeviantion)
                {
                    LRs[lr.Name].Children.Add(Chart.DrawTrendLine("Dev-Top " + lr.Name, start, pr1 + stdDeviation, end, pr2 + stdDeviation, Color.Blue, 1, LineStyle.DotsRare));
                    LRs[lr.Name].Children.Add(Chart.DrawTrendLine("Dev-Bottom " + lr.Name, start, pr1 - stdDeviation, end, pr2 - stdDeviation, Color.Blue, 1, LineStyle.DotsRare));
                }
            } catch (Exception)
            {
            }
        }
    }

    public class Toolbar : CustomControl
    {
        LinearRegressionChannel LR;

        public Toolbar(LinearRegressionChannel lr)
        {
            LR = lr;
            var AddButton = new Button
            {
                Text = "Add",
                Style = new Style(DefaultStyles.ButtonStyle),
                Height = 25
            };

            AddButton.Click += AddArea;

            AddChild(AddButton);
        }

        void AddArea(ButtonClickEventArgs e)
        {
            double Y = (LR.Chart.TopY - LR.Chart.BottomY) * 0.6 + LR.Chart.BottomY;
            string name = "LinearRegressionChannel " + LR.Time;
            LR.LRs.Add(name, new LR(LR.Chart.DrawTrendLine(name, LR.Chart.LastVisibleBarIndex - 2, Y, (int)(LR.Chart.LastVisibleBarIndex - (LR.Chart.LastVisibleBarIndex - LR.Chart.FirstVisibleBarIndex) * 0.2), Y, Color.DarkSlateGray)));
            LR.LRs[name].Parent.IsInteractive = true;
        }
    }

    public class LR
    {
        public ChartTrendLine Parent;
        public List<ChartTrendLine> Children = new List<ChartTrendLine>();

        public LR(ChartTrendLine cr)
        {
            Parent = cr;
        }
    }
}Replies
tuuguu177
14 Jul 2024, 07:09
RE: how to extend trendline to right?
PanagiotisCharalampous said:
Hi there,
I added the indicator on a chart but I see no error. Can you please explain what error do you get and how we can reproduce it?
Best regards,
Panagiotis
Hello, This indicator draws 5 trend lines. I want to draw it with right ray(extension). Now it draws without right ray. I found code(.ExtendToInfinity=true). but it does not work. How to fix it?
Thank you
@tuuguu177
tuuguu177
14 Jul 2024, 10:24
RE: how to extend trendline to right?
PanagiotisCharalampous said:
Hi there,
I added the indicator on a chart but I see no error. Can you please explain what error do you get and how we can reproduce it?
Best regards,
Panagiotis
are you there?
@tuuguu177
PanagiotisCharalampous
15 Jul 2024, 05:45
RE: RE: how to extend trendline to right?
tuuguu177 said:
PanagiotisCharalampous said:
Hi there,
I added the indicator on a chart but I see no error. Can you please explain what error do you get and how we can reproduce it?
Best regards,
Panagiotis
are you there?
You did not answer my question therefore I am not able to help you further at the moment.
@PanagiotisCharalampous
tuuguu177
24 Jul 2024, 09:20
RE: RE: RE: how to extend trendline to right?
PanagiotisCharalampous said:
tuuguu177 said:
PanagiotisCharalampous said:
Hi there,
I added the indicator on a chart but I see no error. Can you please explain what error do you get and how we can reproduce it?
Best regards,
Panagiotis
are you there?
You did not answer my question therefore I am not able to help you further at the moment.
This error occurred. I only want extend trend lines. That is all. I can not find right structure of extended trend line codes.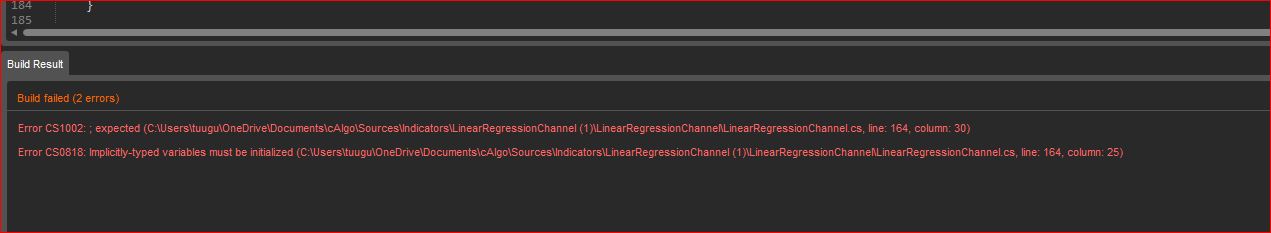
@tuuguu177
PanagiotisCharalampous
24 Jul 2024, 10:37
RE: RE: RE: RE: how to extend trendline to right?
tuuguu177 said:
PanagiotisCharalampous said:
tuuguu177 said:
PanagiotisCharalampous said:
Hi there,
I added the indicator on a chart but I see no error. Can you please explain what error do you get and how we can reproduce it?
Best regards,
Panagiotis
are you there?
You did not answer my question therefore I am not able to help you further at the moment.
This error occurred. I only want extend trend lines. That is all. I can not find right structure of extended trend line codes.
Please share the code that reproduces these error messages
@PanagiotisCharalampous
tuuguu177
24 Jul 2024, 11:05
RE: RE: RE: RE: RE: how to extend trendline to right?
PanagiotisCharalampous said:
tuuguu177 said:
PanagiotisCharalampous said:
tuuguu177 said:
PanagiotisCharalampous said:
Hi there,
I added the indicator on a chart but I see no error. Can you please explain what error do you get and how we can reproduce it?
Best regards,
Panagiotis
are you there?
You did not answer my question therefore I am not able to help you further at the moment.
This error occurred. I only want extend trend lines. That is all. I can not find right structure of extended trend line codes.
Please share the code that reproduces these error messages
Code is:
using System;
using cAlgo.API;
using cAlgo.API.Internals;
using cAlgo.API.Indicators;
using cAlgo.Indicators;
using System.Collections.Generic;
#pragma warning disable
namespace cAlgo.Indicators
{
[Indicator(IsOverlay = true, AccessRights = AccessRights.None)]
public class LinearRegressionChannel : Indicator
{
[Parameter("Projection Length", DefaultValue = 0)]
public int ProjLength { get; set; }
[Parameter("Center", DefaultValue = true)]
public bool ShowCenter { get; set; }
[Parameter("Channel", DefaultValue = true)]
public bool ShowChannel { get; set; }
[Parameter("Standard deviation", DefaultValue = true)]
public bool ShowDeviantion { get; set; }
public Dictionary<string, LR> LRs = new Dictionary<string, LR>();
protected override void Initialize()
{
///Add the button in the topleft corner
Border border = new Border
{
VerticalAlignment = VerticalAlignment.Top,
HorizontalAlignment = HorizontalAlignment.Right,
Margin = "20 40 20 20",
Width = 50,
Child = new Toolbar(this)
};
Chart.AddControl(border);
///Events for calculating and drawing
Chart.ObjectUpdated += OnChartObjectUpdated;
Chart.ObjectRemoved += OnChartObjectRemoved;
foreach (ChartObject o in Chart.Objects)
if (o.Name.Length > 24 && o.Name.Substring(0, 24) == "LinearRegressionChannel " && o.IsInteractive && o.ObjectType == ChartObjectType.TrendLine)
{
LRs.Add(o.Name, new LR((ChartTrendLine)o));
o.IsInteractive = false;
o.IsInteractive = true;
}
}
void OnChartObjectRemoved(ChartObjectRemovedEventArgs obj)
{
try
{
if (IsCleaning)
return;
RemoveAllObjectsConnectedWith(obj.ChartObject);
if (LRs.ContainsKey(obj.ChartObject.Name))
LRs.Remove(obj.ChartObject.Name);
} catch (Exception e)
{
Print(e);
Print("Errore nella rimozione dell'oggetto");
}
}
bool IsCleaning = false;
void RemoveAllObjectsConnectedWith(ChartObject o)
{
if (LRs.ContainsKey(o.Name))
{
IsCleaning = true;
for (int i = 0; i < LRs[o.Name].Children.Count; ++i)
{
try
{
Chart.RemoveObject(LRs[o.Name].Children[i].Name);
} catch (Exception e)
{
Print(e);
continue;
}
}
}
LRs[o.Name].Children.Clear();
IsCleaning = false;
}
public override void Calculate(int index)
{
}
void OnChartObjectUpdated(ChartObjectUpdatedEventArgs obj)
{
try
{
RemoveAllObjectsConnectedWith(obj.ChartObject);
///Check if object is a rectangle and if it's part of this indicator
if (!LRs.ContainsKey(obj.ChartObject.Name))
return;
ChartTrendLine lr = (ChartTrendLine)obj.ChartObject;
// Linear regresion
double sum_x = 0, sum_x2 = 0, sum_y = 0, sum_xy = 0, x_avg=0, x=0,x_sum_squared=0,stdDeviation=0;
int start = Bars.OpenTimes.GetIndexByTime(lr.Time1);
int end = Bars.OpenTimes.GetIndexByTime(lr.Time2);
int length = Math.Abs(end - start);
if (start > end)
{
start = Bars.OpenTimes.GetIndexByTime(lr.Time2);
end = Bars.OpenTimes.GetIndexByTime(lr.Time1);
}
for (int i = start; i < end; i++)
{
sum_x += 1.0 * i;
sum_x2 += 1.0 * i * i;
sum_y += Bars[i].Close;
sum_xy += Bars[i].Close * i;
}
double a = (length * sum_xy - sum_x * sum_y) / (length * sum_x2 - sum_x * sum_x);
double b = (sum_y - a * sum_x) / length;
// Calculate maximum and standard devaitions
double maxUpperDeviation = 0, maxLowerDeviation = 0;
double sumDevation = 0;
for (int i = start; i < end; i++)
{
double price = a * i + b;
x = Math.Abs(Bars[i].Close - price);
x_avg=(x_avg+x)/i;
x_sum_squared += (x - x_avg) * (x - x_avg);
maxUpperDeviation = Math.Max(Bars[i].Close - price, maxUpperDeviation);
maxLowerDeviation = Math.Min(Bars[i].Close - price, maxLowerDeviation);
stdDeviation=Math.Sqrt(x_sum_squared/(length - 1));
}
//double stdDeviation = Math.Sqrt(sumDevation / (length - 1));
// draw in future
//end += (int)(length * 0.01 * ProjLength);
double pr1 = a * start + b;
double pr2 = a * end + b;
if (ShowCenter)
{
//LRs[lr.Name].Children.Add(Chart.DrawTrendLine("Center " + lr.Name, start, pr1, end, pr2, Color.Blue, 1, LineStyle.DotsRare));
var line LRs[lr.Name].Children.Add(Chart.DrawTrendLine("Center " + lr.Name, start, pr1, end, pr2, Color.Blue, 1, LineStyle.DotsRare));
line .ExtendToInfinity = true;
}
if (ShowChannel)
{
LRs[lr.Name].Children.Add(Chart.DrawTrendLine("Top " + lr.Name, start, pr1 + stdDeviation*2, end, pr2 + stdDeviation*2, Color.Blue, 1, LineStyle.DotsRare));
LRs[lr.Name].Children.Add(Chart.DrawTrendLine("Bottom " + lr.Name, start, pr1 - stdDeviation*2, end, pr2 - stdDeviation*2, Color.Blue, 1, LineStyle.DotsRare));
}
if (ShowDeviantion)
{
LRs[lr.Name].Children.Add(Chart.DrawTrendLine("Dev-Top " + lr.Name, start, pr1 + stdDeviation, end, pr2 + stdDeviation, Color.Blue, 1, LineStyle.DotsRare));
LRs[lr.Name].Children.Add(Chart.DrawTrendLine("Dev-Bottom " + lr.Name, start, pr1 - stdDeviation, end, pr2 - stdDeviation, Color.Blue, 1, LineStyle.DotsRare));
}
} catch (Exception)
{
}
}
}
public class Toolbar : CustomControl
{
LinearRegressionChannel LR;
public Toolbar(LinearRegressionChannel lr)
{
LR = lr;
var AddButton = new Button
{
Text = "Add",
Style = new Style(DefaultStyles.ButtonStyle),
Height = 25
};
AddButton.Click += AddArea;
AddChild(AddButton);
}
void AddArea(ButtonClickEventArgs e)
{
double Y = (LR.Chart.TopY - LR.Chart.BottomY) * 0.6 + LR.Chart.BottomY;
string name = "LinearRegressionChannel " + LR.Time;
LR.LRs.Add(name, new LR(LR.Chart.DrawTrendLine(name, LR.Chart.LastVisibleBarIndex - 2, Y, (int)(LR.Chart.LastVisibleBarIndex - (LR.Chart.LastVisibleBarIndex - LR.Chart.FirstVisibleBarIndex) * 0.2), Y, Color.DarkSlateGray)));
LR.LRs[name].Parent.IsInteractive = true;
}
}
public class LR
{
public ChartTrendLine Parent;
public List<ChartTrendLine> Children = new List<ChartTrendLine>();
public LR(ChartTrendLine cr)
{
Parent = cr;
}
}
}
@tuuguu177
PanagiotisCharalampous
25 Jul 2024, 05:30
RE: RE: RE: RE: RE: RE: how to extend trendline to right?
tuuguu177 said:
PanagiotisCharalampous said:
tuuguu177 said:
PanagiotisCharalampous said:
tuuguu177 said:
PanagiotisCharalampous said:
Hi there,
I added the indicator on a chart but I see no error. Can you please explain what error do you get and how we can reproduce it?
Best regards,
Panagiotis
are you there?
You did not answer my question therefore I am not able to help you further at the moment.
This error occurred. I only want extend trend lines. That is all. I can not find right structure of extended trend line codes.
Please share the code that reproduces these error messages
Code is:
using System;
using cAlgo.API;
using cAlgo.API.Internals;
using cAlgo.API.Indicators;
using cAlgo.Indicators;
using System.Collections.Generic;
#pragma warning disable
namespace cAlgo.Indicators
{
[Indicator(IsOverlay = true, AccessRights = AccessRights.None)]
public class LinearRegressionChannel : Indicator
{
[Parameter("Projection Length", DefaultValue = 0)]
public int ProjLength { get; set; }
[Parameter("Center", DefaultValue = true)]
public bool ShowCenter { get; set; }
[Parameter("Channel", DefaultValue = true)]
public bool ShowChannel { get; set; }
[Parameter("Standard deviation", DefaultValue = true)]
public bool ShowDeviantion { get; set; }
public Dictionary<string, LR> LRs = new Dictionary<string, LR>();
protected override void Initialize()
{
///Add the button in the topleft corner
Border border = new Border
{
VerticalAlignment = VerticalAlignment.Top,
HorizontalAlignment = HorizontalAlignment.Right,
Margin = "20 40 20 20",
Width = 50,
Child = new Toolbar(this)
};
Chart.AddControl(border);
///Events for calculating and drawing
Chart.ObjectUpdated += OnChartObjectUpdated;
Chart.ObjectRemoved += OnChartObjectRemoved;
foreach (ChartObject o in Chart.Objects)
if (o.Name.Length > 24 && o.Name.Substring(0, 24) == "LinearRegressionChannel " && o.IsInteractive && o.ObjectType == ChartObjectType.TrendLine)
{
LRs.Add(o.Name, new LR((ChartTrendLine)o));
o.IsInteractive = false;
o.IsInteractive = true;
}
}
void OnChartObjectRemoved(ChartObjectRemovedEventArgs obj)
{
try
{
if (IsCleaning)
return;
RemoveAllObjectsConnectedWith(obj.ChartObject);
if (LRs.ContainsKey(obj.ChartObject.Name))
LRs.Remove(obj.ChartObject.Name);
} catch (Exception e)
{
Print(e);
Print("Errore nella rimozione dell'oggetto");
}
}
bool IsCleaning = false;
void RemoveAllObjectsConnectedWith(ChartObject o)
{
if (LRs.ContainsKey(o.Name))
{
IsCleaning = true;
for (int i = 0; i < LRs[o.Name].Children.Count; ++i)
{
try
{
Chart.RemoveObject(LRs[o.Name].Children[i].Name);
} catch (Exception e)
{
Print(e);
continue;
}
}
}
LRs[o.Name].Children.Clear();
IsCleaning = false;
}
public override void Calculate(int index)
{
}
void OnChartObjectUpdated(ChartObjectUpdatedEventArgs obj)
{
try
{
RemoveAllObjectsConnectedWith(obj.ChartObject);
///Check if object is a rectangle and if it's part of this indicator
if (!LRs.ContainsKey(obj.ChartObject.Name))
return;
ChartTrendLine lr = (ChartTrendLine)obj.ChartObject;
// Linear regresion
double sum_x = 0, sum_x2 = 0, sum_y = 0, sum_xy = 0, x_avg=0, x=0,x_sum_squared=0,stdDeviation=0;
int start = Bars.OpenTimes.GetIndexByTime(lr.Time1);
int end = Bars.OpenTimes.GetIndexByTime(lr.Time2);
int length = Math.Abs(end - start);
if (start > end)
{
start = Bars.OpenTimes.GetIndexByTime(lr.Time2);
end = Bars.OpenTimes.GetIndexByTime(lr.Time1);
}
for (int i = start; i < end; i++)
{
sum_x += 1.0 * i;
sum_x2 += 1.0 * i * i;
sum_y += Bars[i].Close;
sum_xy += Bars[i].Close * i;
}
double a = (length * sum_xy - sum_x * sum_y) / (length * sum_x2 - sum_x * sum_x);
double b = (sum_y - a * sum_x) / length;
// Calculate maximum and standard devaitions
double maxUpperDeviation = 0, maxLowerDeviation = 0;
double sumDevation = 0;
for (int i = start; i < end; i++)
{
double price = a * i + b;
x = Math.Abs(Bars[i].Close - price);
x_avg=(x_avg+x)/i;
x_sum_squared += (x - x_avg) * (x - x_avg);
maxUpperDeviation = Math.Max(Bars[i].Close - price, maxUpperDeviation);
maxLowerDeviation = Math.Min(Bars[i].Close - price, maxLowerDeviation);
stdDeviation=Math.Sqrt(x_sum_squared/(length - 1));
}
//double stdDeviation = Math.Sqrt(sumDevation / (length - 1));
// draw in future
//end += (int)(length * 0.01 * ProjLength);
double pr1 = a * start + b;
double pr2 = a * end + b;
if (ShowCenter)
{
//LRs[lr.Name].Children.Add(Chart.DrawTrendLine("Center " + lr.Name, start, pr1, end, pr2, Color.Blue, 1, LineStyle.DotsRare));
var line LRs[lr.Name].Children.Add(Chart.DrawTrendLine("Center " + lr.Name, start, pr1, end, pr2, Color.Blue, 1, LineStyle.DotsRare));
line .ExtendToInfinity = true;
}
if (ShowChannel)
{
LRs[lr.Name].Children.Add(Chart.DrawTrendLine("Top " + lr.Name, start, pr1 + stdDeviation*2, end, pr2 + stdDeviation*2, Color.Blue, 1, LineStyle.DotsRare));
LRs[lr.Name].Children.Add(Chart.DrawTrendLine("Bottom " + lr.Name, start, pr1 - stdDeviation*2, end, pr2 - stdDeviation*2, Color.Blue, 1, LineStyle.DotsRare));
}
if (ShowDeviantion)
{
LRs[lr.Name].Children.Add(Chart.DrawTrendLine("Dev-Top " + lr.Name, start, pr1 + stdDeviation, end, pr2 + stdDeviation, Color.Blue, 1, LineStyle.DotsRare));
LRs[lr.Name].Children.Add(Chart.DrawTrendLine("Dev-Bottom " + lr.Name, start, pr1 - stdDeviation, end, pr2 - stdDeviation, Color.Blue, 1, LineStyle.DotsRare));
}
} catch (Exception)
{
}
}
}
public class Toolbar : CustomControl
{
LinearRegressionChannel LR;
public Toolbar(LinearRegressionChannel lr)
{
LR = lr;
var AddButton = new Button
{
Text = "Add",
Style = new Style(DefaultStyles.ButtonStyle),
Height = 25
};
AddButton.Click += AddArea;
AddChild(AddButton);
}
void AddArea(ButtonClickEventArgs e)
{
double Y = (LR.Chart.TopY - LR.Chart.BottomY) * 0.6 + LR.Chart.BottomY;
string name = "LinearRegressionChannel " + LR.Time;
LR.LRs.Add(name, new LR(LR.Chart.DrawTrendLine(name, LR.Chart.LastVisibleBarIndex - 2, Y, (int)(LR.Chart.LastVisibleBarIndex - (LR.Chart.LastVisibleBarIndex - LR.Chart.FirstVisibleBarIndex) * 0.2), Y, Color.DarkSlateGray)));
LR.LRs[name].Parent.IsInteractive = true;
}
}
public class LR
{
public ChartTrendLine Parent;
public List<ChartTrendLine> Children = new List<ChartTrendLine>();
public LR(ChartTrendLine cr)
{
Parent = cr;
}
}
}
Your problem is this line of code. This is not correct C#
var line LRs[lr.Name].Children.Add(Chart.DrawTrendLine("Center " + lr.Name, start, pr1, end, pr2, Color.Blue, 1, LineStyle.DotsRare));Maybe you are trying to do this?
                    var line = Chart.DrawTrendLine("Center " + lr.Name, start, pr1, end, pr2, Color.Blue, 1, LineStyle.DotsRare);
                    line .ExtendToInfinity = true;
                    LRs[lr.Name].Children.Add(line);
@PanagiotisCharalampous
tuuguu177
25 Jul 2024, 06:09
RE: RE: RE: RE: RE: RE: RE: how to extend trendline to right?
PanagiotisCharalampous said:
tuuguu177 said:
PanagiotisCharalampous said:
tuuguu177 said:
PanagiotisCharalampous said:
tuuguu177 said:
PanagiotisCharalampous said:
Hi there,
I added the indicator on a chart but I see no error. Can you please explain what error do you get and how we can reproduce it?
Best regards,
Panagiotis
are you there?
You did not answer my question therefore I am not able to help you further at the moment.
This error occurred. I only want extend trend lines. That is all. I can not find right structure of extended trend line codes.
Please share the code that reproduces these error messages
Code is:
using System;
using cAlgo.API;
using cAlgo.API.Internals;
using cAlgo.API.Indicators;
using cAlgo.Indicators;
using System.Collections.Generic;
#pragma warning disable
namespace cAlgo.Indicators
{
[Indicator(IsOverlay = true, AccessRights = AccessRights.None)]
public class LinearRegressionChannel : Indicator
{
[Parameter("Projection Length", DefaultValue = 0)]
public int ProjLength { get; set; }
[Parameter("Center", DefaultValue = true)]
public bool ShowCenter { get; set; }
[Parameter("Channel", DefaultValue = true)]
public bool ShowChannel { get; set; }
[Parameter("Standard deviation", DefaultValue = true)]
public bool ShowDeviantion { get; set; }
public Dictionary<string, LR> LRs = new Dictionary<string, LR>();
protected override void Initialize()
{
///Add the button in the topleft corner
Border border = new Border
{
VerticalAlignment = VerticalAlignment.Top,
HorizontalAlignment = HorizontalAlignment.Right,
Margin = "20 40 20 20",
Width = 50,
Child = new Toolbar(this)
};
Chart.AddControl(border);
///Events for calculating and drawing
Chart.ObjectUpdated += OnChartObjectUpdated;
Chart.ObjectRemoved += OnChartObjectRemoved;
foreach (ChartObject o in Chart.Objects)
if (o.Name.Length > 24 && o.Name.Substring(0, 24) == "LinearRegressionChannel " && o.IsInteractive && o.ObjectType == ChartObjectType.TrendLine)
{
LRs.Add(o.Name, new LR((ChartTrendLine)o));
o.IsInteractive = false;
o.IsInteractive = true;
}
}
void OnChartObjectRemoved(ChartObjectRemovedEventArgs obj)
{
try
{
if (IsCleaning)
return;
RemoveAllObjectsConnectedWith(obj.ChartObject);
if (LRs.ContainsKey(obj.ChartObject.Name))
LRs.Remove(obj.ChartObject.Name);
} catch (Exception e)
{
Print(e);
Print("Errore nella rimozione dell'oggetto");
}
}
bool IsCleaning = false;
void RemoveAllObjectsConnectedWith(ChartObject o)
{
if (LRs.ContainsKey(o.Name))
{
IsCleaning = true;
for (int i = 0; i < LRs[o.Name].Children.Count; ++i)
{
try
{
Chart.RemoveObject(LRs[o.Name].Children[i].Name);
} catch (Exception e)
{
Print(e);
continue;
}
}
}
LRs[o.Name].Children.Clear();
IsCleaning = false;
}
public override void Calculate(int index)
{
}
void OnChartObjectUpdated(ChartObjectUpdatedEventArgs obj)
{
try
{
RemoveAllObjectsConnectedWith(obj.ChartObject);
///Check if object is a rectangle and if it's part of this indicator
if (!LRs.ContainsKey(obj.ChartObject.Name))
return;
ChartTrendLine lr = (ChartTrendLine)obj.ChartObject;
// Linear regresion
double sum_x = 0, sum_x2 = 0, sum_y = 0, sum_xy = 0, x_avg=0, x=0,x_sum_squared=0,stdDeviation=0;
int start = Bars.OpenTimes.GetIndexByTime(lr.Time1);
int end = Bars.OpenTimes.GetIndexByTime(lr.Time2);
int length = Math.Abs(end - start);
if (start > end)
{
start = Bars.OpenTimes.GetIndexByTime(lr.Time2);
end = Bars.OpenTimes.GetIndexByTime(lr.Time1);
}
for (int i = start; i < end; i++)
{
sum_x += 1.0 * i;
sum_x2 += 1.0 * i * i;
sum_y += Bars[i].Close;
sum_xy += Bars[i].Close * i;
}
double a = (length * sum_xy - sum_x * sum_y) / (length * sum_x2 - sum_x * sum_x);
double b = (sum_y - a * sum_x) / length;
// Calculate maximum and standard devaitions
double maxUpperDeviation = 0, maxLowerDeviation = 0;
double sumDevation = 0;
for (int i = start; i < end; i++)
{
double price = a * i + b;
x = Math.Abs(Bars[i].Close - price);
x_avg=(x_avg+x)/i;
x_sum_squared += (x - x_avg) * (x - x_avg);
maxUpperDeviation = Math.Max(Bars[i].Close - price, maxUpperDeviation);
maxLowerDeviation = Math.Min(Bars[i].Close - price, maxLowerDeviation);
stdDeviation=Math.Sqrt(x_sum_squared/(length - 1));
}
//double stdDeviation = Math.Sqrt(sumDevation / (length - 1));
// draw in future
//end += (int)(length * 0.01 * ProjLength);
double pr1 = a * start + b;
double pr2 = a * end + b;
if (ShowCenter)
{
//LRs[lr.Name].Children.Add(Chart.DrawTrendLine("Center " + lr.Name, start, pr1, end, pr2, Color.Blue, 1, LineStyle.DotsRare));
var line LRs[lr.Name].Children.Add(Chart.DrawTrendLine("Center " + lr.Name, start, pr1, end, pr2, Color.Blue, 1, LineStyle.DotsRare));
line .ExtendToInfinity = true;
}
if (ShowChannel)
{
LRs[lr.Name].Children.Add(Chart.DrawTrendLine("Top " + lr.Name, start, pr1 + stdDeviation*2, end, pr2 + stdDeviation*2, Color.Blue, 1, LineStyle.DotsRare));
LRs[lr.Name].Children.Add(Chart.DrawTrendLine("Bottom " + lr.Name, start, pr1 - stdDeviation*2, end, pr2 - stdDeviation*2, Color.Blue, 1, LineStyle.DotsRare));
}
if (ShowDeviantion)
{
LRs[lr.Name].Children.Add(Chart.DrawTrendLine("Dev-Top " + lr.Name, start, pr1 + stdDeviation, end, pr2 + stdDeviation, Color.Blue, 1, LineStyle.DotsRare));
LRs[lr.Name].Children.Add(Chart.DrawTrendLine("Dev-Bottom " + lr.Name, start, pr1 - stdDeviation, end, pr2 - stdDeviation, Color.Blue, 1, LineStyle.DotsRare));
}
} catch (Exception)
{
}
}
}
public class Toolbar : CustomControl
{
LinearRegressionChannel LR;
public Toolbar(LinearRegressionChannel lr)
{
LR = lr;
var AddButton = new Button
{
Text = "Add",
Style = new Style(DefaultStyles.ButtonStyle),
Height = 25
};
AddButton.Click += AddArea;
AddChild(AddButton);
}
void AddArea(ButtonClickEventArgs e)
{
double Y = (LR.Chart.TopY - LR.Chart.BottomY) * 0.6 + LR.Chart.BottomY;
string name = "LinearRegressionChannel " + LR.Time;
LR.LRs.Add(name, new LR(LR.Chart.DrawTrendLine(name, LR.Chart.LastVisibleBarIndex - 2, Y, (int)(LR.Chart.LastVisibleBarIndex - (LR.Chart.LastVisibleBarIndex - LR.Chart.FirstVisibleBarIndex) * 0.2), Y, Color.DarkSlateGray)));
LR.LRs[name].Parent.IsInteractive = true;
}
}
public class LR
{
public ChartTrendLine Parent;
public List<ChartTrendLine> Children = new List<ChartTrendLine>();
public LR(ChartTrendLine cr)
{
Parent = cr;
}
}
}Your problem is this line of code. This is not correct C#
var line LRs[lr.Name].Children.Add(Chart.DrawTrendLine("Center " + lr.Name, start, pr1, end, pr2, Color.Blue, 1, LineStyle.DotsRare));Maybe you are trying to do this?
var line = Chart.DrawTrendLine("Center " + lr.Name, start, pr1, end, pr2, Color.Blue, 1, LineStyle.DotsRare); line .ExtendToInfinity = true; LRs[lr.Name].Children.Add(line);
OMG it is working :-), Thank you very much my friend.
@tuuguu177
PanagiotisCharalampous
14 Jul 2024, 06:58
Hi there,
I added the indicator on a chart but I see no error. Can you please explain what error do you get and how we can reproduce it?
Best regards,
Panagiotis
@PanagiotisCharalampous