Why is string interpolation messing with the number of trendlines on my chart

Why is string interpolation messing with the number of trendlines on my chart
22 Mar 2024, 10:48
Hi, I'm really confused. For every chart object there has to be a unique name, so I made a counter variable which increments each time an object is drawn and insert the value of counter into the name so that it's unique every time. But this has really weird effects on the lines drawn on my chart, it draws trendlines which do fit the conditional statement but they are outside of my period range.
using cAlgo.API;using System;using System.Text;namespace cAlgo{ [Indicator(IsOverlay = true, TimeZone = TimeZones.UTC, AccessRights = AccessRights.None)] public class Propsense : Indicator { [Parameter("Period", DefaultValue = 50)] public int Period { get; set; } [Parameter("Line Width", DefaultValue = 2)] public int LineWidth { get; set; } [Parameter("Bullish Line Color", DefaultValue = "Blue")] public string BullishColor { get; set; } [Parameter("Bearish Line Color", DefaultValue = "Red")] public string BearishColor { get; set; } public override void Calculate(int index) { double numCount = 0; for (int i = index; i > index - Period; i--) { var prevBar = Bars[i - 1]; // Check for bear candle after bull candle if ((Bars.ClosePrices[i] < Bars.OpenPrices[i]) && (prevBar.Close > prevBar.Open)) { // Draw bearish trend line from the low of the body extending to current time Chart.DrawTrendLine($"BearishLine{numCount}", Bars.OpenTimes[i], Bars.ClosePrices[i], Bars.LastBar.OpenTime, Bars.ClosePrices[i], BearishColor); numCount++; } } } }}
This is the result I get for this code: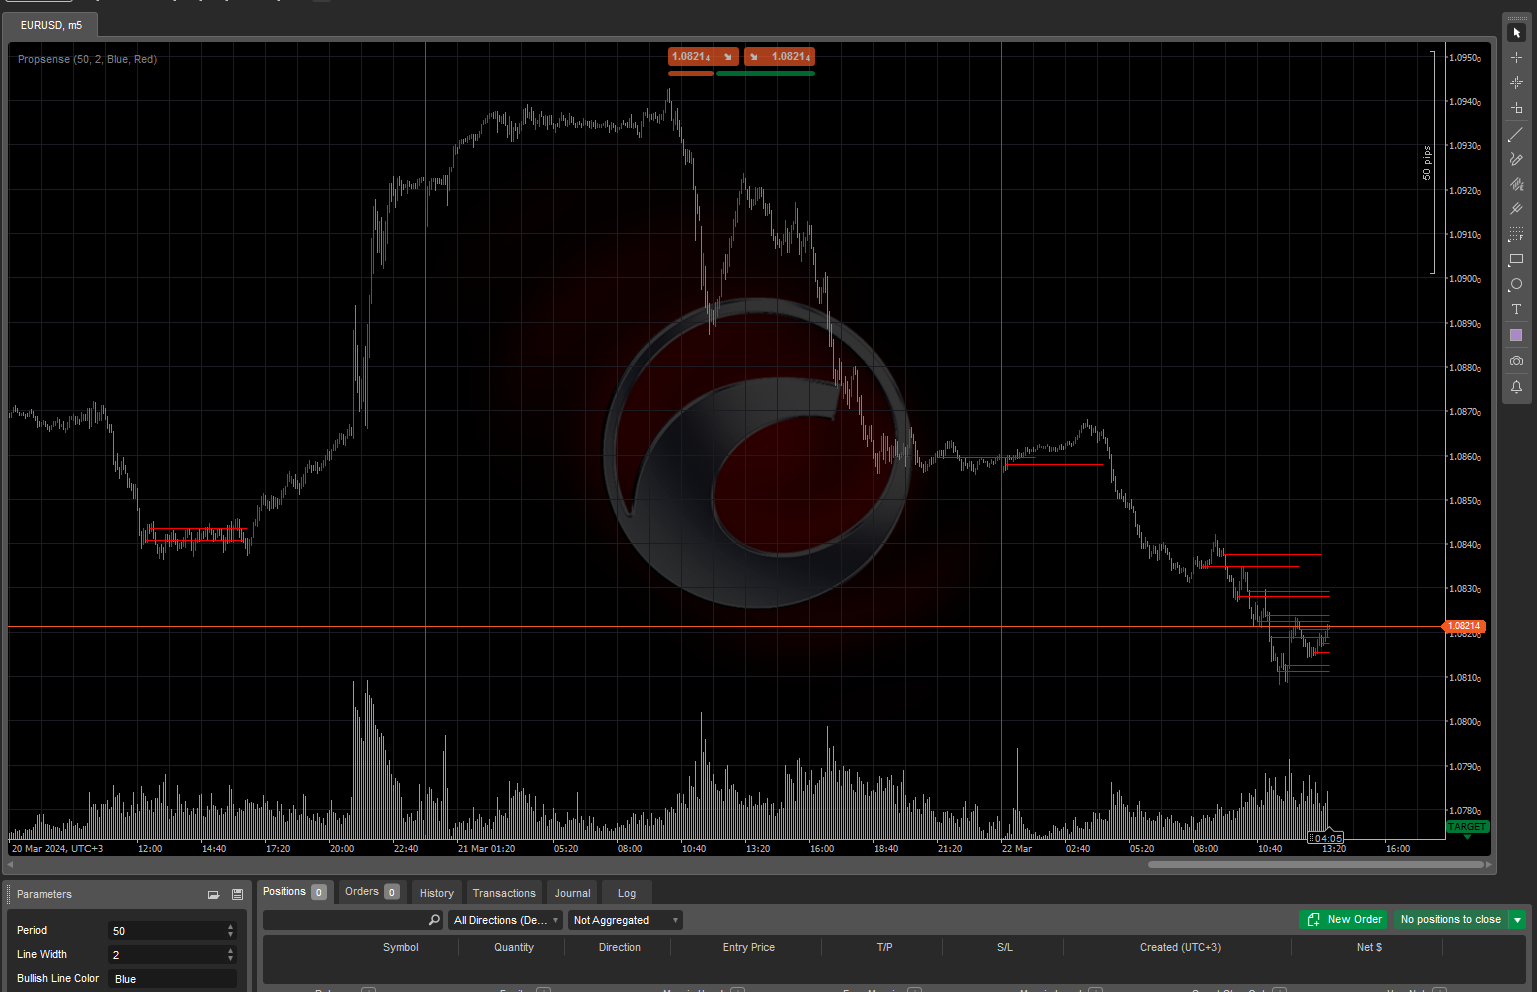
It should only be drawing lines for the last 50 candles. But you can see red lines well out of this period, and then no more after that.
Where it gets strange is if I use the bar index value (i) instead of the counter, it does this: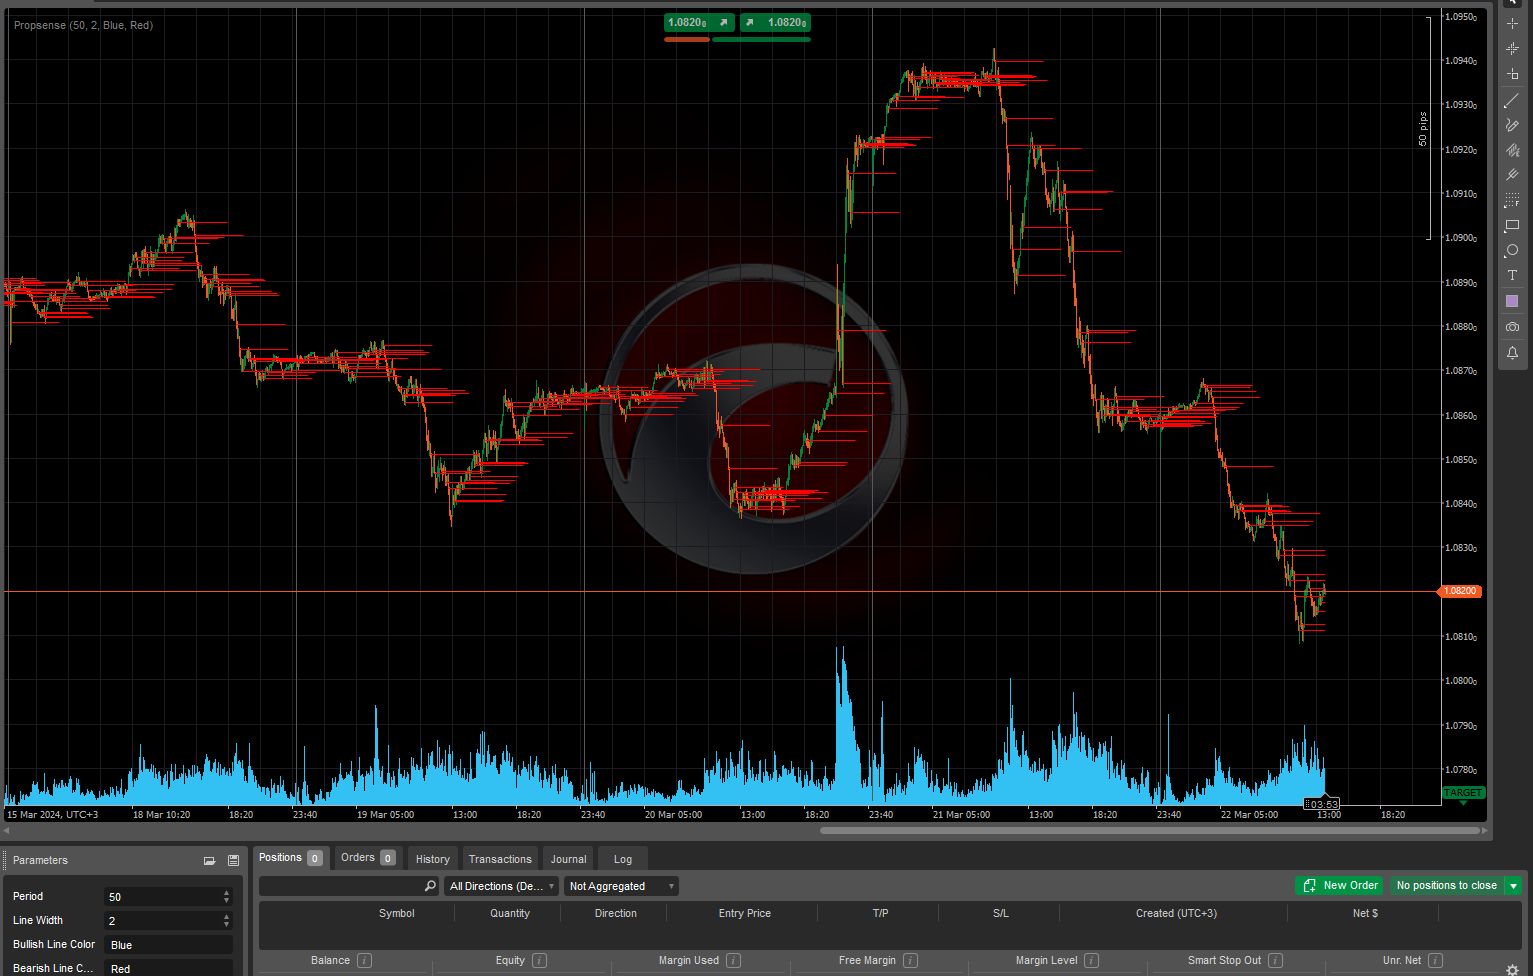
I've tried to concatenate and use string.format() but nothing seems to work, it will always end up with strange results. I've checked the for loop logic and it should only be going through the last “period” of candles and stopping. Without the counter variable it would of course only draw one line.
Can someone help? Why is the string variable affecting the number of lines being output?
Replies
fahim36912
22 Mar 2024, 15:32
( Updated at: 23 Mar 2024, 05:34 )
RE: Why is string interpolation messing with the number of trendlines on my chart
PanagiotisCharalampous said:
Hi there,
This happens because Calculate() method is called for historical bars as well. If you don't want to call it for historical bars, you can use IsLastBar to check that you are on the last bar.
Best regards,
Panagiotis
Thanks I love you
@fahim36912
PanagiotisCharalampous
22 Mar 2024, 14:50
Hi there,
This happens because Calculate() method is called for historical bars as well. If you don't want to call it for historical bars, you can use IsLastBar to check that you are on the last bar.
Best regards,
Panagiotis
@PanagiotisCharalampous