IndicatorDataSeries plots the indicator line at different prices for the same date when the chart is zoomed out.

IndicatorDataSeries plots the indicator line at different prices for the same date when the chart is zoomed out.
29 Nov 2023, 00:41
Hey guys I'm working with a demo code I found in this forum, and when i try to plot the indicators line, as the topic title says, it is showing the indicator line at different prices for the same date when the chart is zoomed out.
Would you be so kind to help me understand why this is happening?
The SMAs, EMAs and so on seem to be 100% stuck to the chart, but when using these custom indicators seems totally off
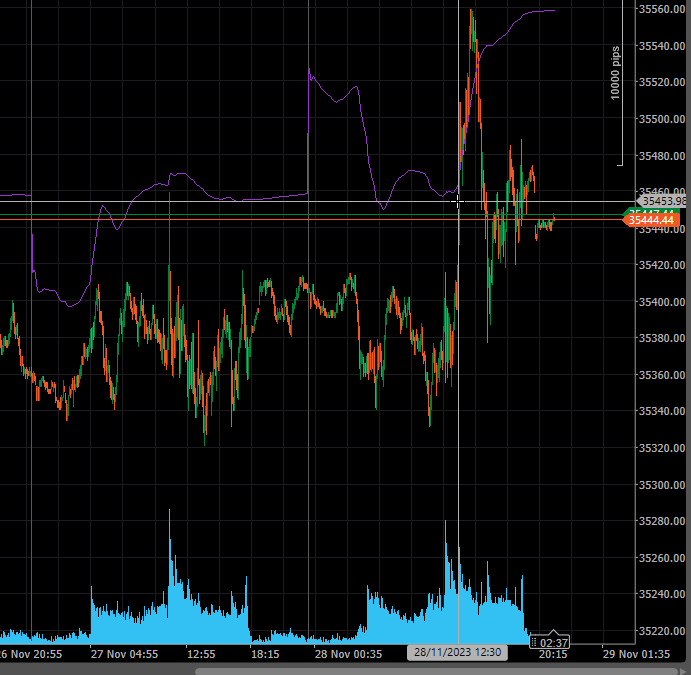
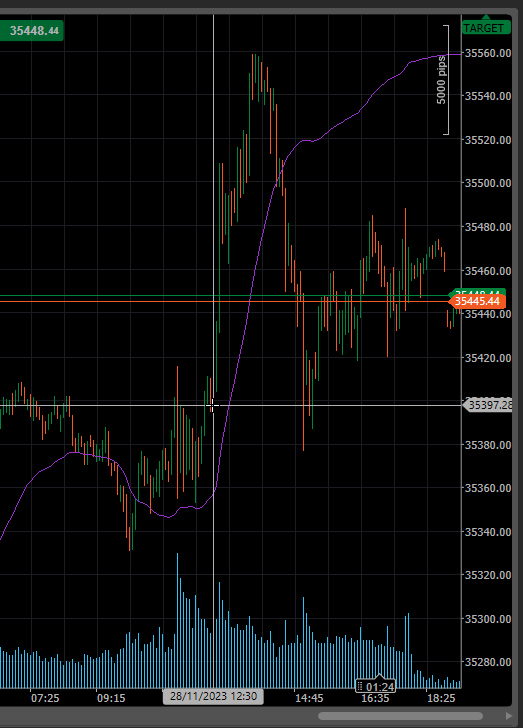
Here are some 2 images of the same indicator (see the prices and datetimes):
- zoom out:
- zoom in:
And here is the code I'm using as example:
using System;
using cAlgo.API;
using cAlgo.API.Internals;
using cAlgo.API.Indicators;
using cAlgo.Indicators;

namespace cAlgo
{
    [Indicator(IsOverlay = true, TimeZone = TimeZones.EasternStandardTime, AutoRescale = false, AccessRights = AccessRights.None)]
    public class VWAP : Indicator
    {
        [Parameter(DefaultValue = 0)]
        public int Periods { get; set; }

        [Parameter("One day only?", DefaultValue = false)]
        public bool Odo { get; set; }

        [Output("Main", Color = Colors.DarkOrchid)]
        public IndicatorDataSeries Result { get; set; }

        public override void Calculate(int index)
        {
            int ii = index;
            double CumTypPrice = 0;
            double CumVol = 0;

            if (Periods == 0)
            {
                while (MarketSeries.OpenTime[ii] >= (Odo == false ? MarketSeries.OpenTime[ii].Date : DateTime.Now.Date) && ii != 0)
                {
                    CumTypPrice += MarketSeries.Typical[ii] * MarketSeries.TickVolume[ii];
                    CumVol += MarketSeries.TickVolume[ii];
                    ii--;
                    if (MarketSeries.OpenTime[ii].Hour == 0 && MarketSeries.OpenTime[ii].Minute == 0)
                        break;
                }
            }
            else
            {
                for (; ii >= MarketSeries.OpenTime.Count - Periods; ii--)
                {
                    CumTypPrice += MarketSeries.Typical[ii] * MarketSeries.TickVolume[ii];
                    CumVol += MarketSeries.TickVolume[ii];
                }
            }

            Result[index] = CumTypPrice / CumVol;

        }

        protected override void Initialize()
        {
            Print("VWAP indicator started...");
        }
    }
}
Thanks for your help!
Ariel-.
Replies
ariel.romero.trading
29 Nov 2023, 12:11
( Updated at: 29 Nov 2023, 12:23 )
RE: Reply to: IndicatorDataSeries plots the indicator line at different prices for the same date when the chart is zoomed out.
PanagiotisCharalampous said:
Hi there,
I could not reproduce this issue on my computer. Any chance you can record a video demonstrating it?
Best regards,
Panagiotis
Hey! thanks for your answer!.
Here is quick video of what I see. I added a SMA just to compare how the SMA stands still and how the IndidatorDataSeries change's his position https://drive.google.com/file/d/1S7KMTKFMqqViJvdX7F0HbkgubSlgioHQ/view?usp=drive_link
Let me know if you can think of on a workaround I can use.
Thanks!
Ariel-.
@ariel.romero.trading
PanagiotisCharalampous
29 Nov 2023, 07:52
Reply to: IndicatorDataSeries plots the indicator line at different prices for the same date when the chart is zoomed out.
Hi there,
I could not reproduce this issue on my computer. Any chance you can record a video demonstrating it?
Best regards,
Panagiotis
@PanagiotisCharalampous