Coloured line indicator

Coloured line indicator
08 Oct 2019, 11:56
Help !
I've been trying to write an indicator that has a colour changing line; Green in an uptrend and Red for a downtrend. I thought I was getting somewhere but I have 2 lines all the time (both the red and green) rather than just the one that I want at that moment in time..... Is there a way I can "hide" the line I don't want displayed ??
using System;
using cAlgo.API;
using cAlgo.API.Indicators;
using cAlgo.Indicators;
// Written by Lisa Beaney - September 2019
// Multiplier added to allow unit changes between brokers to be evened out
namespace cAlgo.Indicators
{
    [Levels(0.0)]
    [Indicator(IsOverlay = false, ScalePrecision = 5, TimeZone = TimeZones.UTC, AccessRights = AccessRights.None)]
    public class OsMA : Indicator
    {
        [Parameter(DefaultValue = 13)]
        public int shortCycle { get; set; }

        [Parameter(DefaultValue = 21)]
        public int longCycle { get; set; }

        [Parameter(DefaultValue = 8)]
        public int signalPeriod { get; set; }

        [Parameter(DefaultValue = 10000)]
        public int multiplier { get; set; }

        [Output("OsMa Line Up Trend", LineColor = "Green", PlotType = PlotType.Line)]
        public IndicatorDataSeries ResultUp { get; set; }
        [Output("OsMa Line Down Trend", LineColor = "Red", PlotType = PlotType.Line)]
        public IndicatorDataSeries ResultDown { get; set; }


        MacdHistogram macd;

        protected override void Initialize()
        {

            macd = Indicators.MacdHistogram(shortCycle, longCycle, signalPeriod);
        }

        public override void Calculate(int index)
        {

            if ((macd.Signal[index] - macd.Histogram[index]) > (macd.Signal[index - 1] - macd.Histogram[index - 1]))
            {
                ResultUp[index] = (macd.Signal[index] - macd.Histogram[index]) * multiplier;
                ResultDown[index] = double.NaN;
            }
            else
            {
                ResultUp[index] = double.NaN;
                ResultDown[index] = (macd.Signal[index] - macd.Histogram[index]) * multiplier;
            }
        }
    }
}
Replies
lisabeaney
08 Oct 2019, 16:36
( Updated at: 21 Dec 2023, 09:21 )
RE:
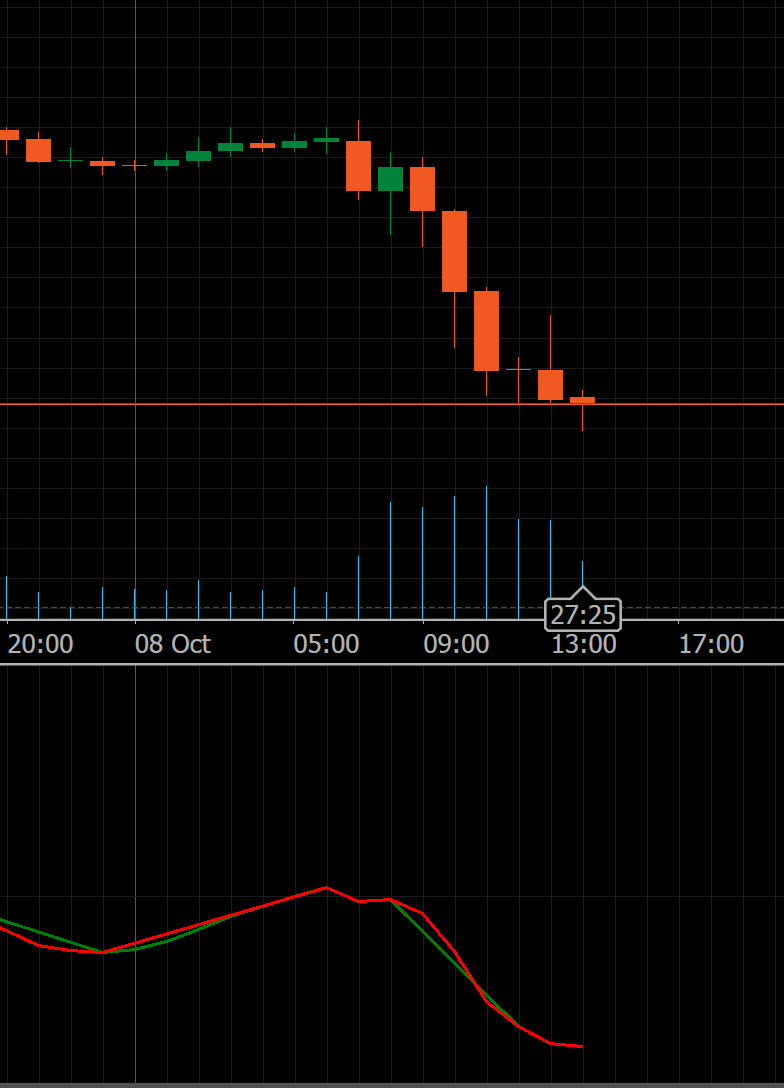
Thank you :) I've tried this and still end up with two coloured lines..... The funny thing is watching it as it draws you only see one line until the direction changes and then it plots the other line from it's last known point. I've added a screenshot to show what I mean....
Is there any way of attaching a colour variable as the line is being drawn rather then needing to reference one of two different lines ?
@lisabeaney
PanagiotisCharalampous
08 Oct 2019, 16:52
( Updated at: 21 Dec 2023, 09:21 )
Hi Lisa,
Did you use the code I pasted? This is what you are supposed to see.

Is there any way of attaching a colour variable as the line is being drawn rather then needing to reference one of two different lines ?
No this is not possible,
Best Regards,
Panagiotis
@PanagiotisCharalampous
lisabeaney
08 Oct 2019, 17:16
Yes I did ! I copy & pasted it in...... I'll go back and delete the whole original version and create a new indicator..... what you have is exactly what I was hoping for
@lisabeaney
PanagiotisCharalampous
08 Oct 2019, 12:08
Hi Lisa,
You need to use discontinuous lines. See below how
using System;
using cAlgo.API;
using cAlgo.API.Indicators;
using cAlgo.Indicators;
// Written by Lisa Beaney - September 2019
// Multiplier added to allow unit changes between brokers to be evened out
namespace cAlgo.Indicators
{
    [Levels(0.0)]
    [Indicator(IsOverlay = false, ScalePrecision = 5, TimeZone = TimeZones.UTC, AccessRights = AccessRights.None)]
    public class OsMA : Indicator
    {
        [Parameter(DefaultValue = 13)]
        public int shortCycle { get; set; }

        [Parameter(DefaultValue = 21)]
        public int longCycle { get; set; }

        [Parameter(DefaultValue = 8)]
        public int signalPeriod { get; set; }

        [Parameter(DefaultValue = 10000)]
        public int multiplier { get; set; }

        [Output("OsMa Line Up Trend", LineColor = "Green", PlotType = PlotType.DiscontinuousLine)]
        public IndicatorDataSeries ResultUp { get; set; }
        [Output("OsMa Line Down Trend", LineColor = "Red", PlotType = PlotType.DiscontinuousLine)]
        public IndicatorDataSeries ResultDown { get; set; }


        MacdHistogram macd;

        protected override void Initialize()
        {

            macd = Indicators.MacdHistogram(shortCycle, longCycle, signalPeriod);
        }

        public override void Calculate(int index)
        {

            if ((macd.Signal[index] - macd.Histogram[index]) > (macd.Signal[index - 1] - macd.Histogram[index - 1]))
            {
                ResultUp[index] = (macd.Signal[index] - macd.Histogram[index]) * multiplier;
                ResultDown[index] = double.NaN;
                if (double.IsNaN(ResultUp[index - 1]))
                    ResultUp[index - 1] = ResultDown[index - 1];
            }
            else
            {
                ResultUp[index] = double.NaN;
                ResultDown[index] = (macd.Signal[index] - macd.Histogram[index]) * multiplier;
                if (double.IsNaN(ResultDown[index - 1]))
                    ResultDown[index - 1] = ResultUp[index - 1];
            }
        }
    }
}
Let me know if this helps,
Best Regards,
Panagiotis
@PanagiotisCharalampous