Temporary Fair Value Indicator


Temporary Fair Value Indicator
05 Dec 2013, 11:22
The Temporary Fair Value indicator was posted on this forum yesterday with the name JeexHerd. With the latest small changes it also got more practical value and a name (thanks to http://www.pinebaycm.com/ ) that is a bit more informative.
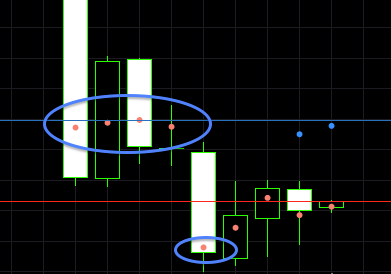 The pink dot is the average of all ticks within a candle. Thus showing not the median price, but the Fair Price. It shows where the action was, based on the Bid-price as that is where the MarketSeries values are based on.
- The blue dot does the same for the Ask price.
- As tick values are not available in the past, the pink dot is backwards calculated from the smallest timeframe (minute) and the blue dot is NaN. During runtime both are based on the ticks.
It has four practical values:
- It shows where most of the action is and where the action is likely to start in the next candle.
- Where dots of the same color line up, it reveals a support or resistance line that is hidden if focus is on the wick or body of a candle. (A high-low indicator line based on this TFV can show other SR-lines than the ones based on highs and lows.)
- For (semi) automated trading it can soften the OnTick() method: One single extra high or low tick cannot trigger an action is not supported by the Temporary Fair Value indicator.
- It forms a line of the Ask price, where as MarketSeries only contains the Bid price. This can also be of value in scalping robots, where spread history can be obtained from the indicator.
If anyone finds more use for it, please comment here.
Replies
emeeder
03 Dec 2014, 16:28
( Updated at: 21 Dec 2023, 09:20 )
Hi Jeex.
I like your indicator and can see the value of it.
I have been trying to think of a good way to automate S+R drawing on the chart. Maybe using the maxminbands indicator modified to look at maxmin of TFV instead of maxmins of wicks or candles, or maybe even an average of the 2 or 3.
The struggle is that i want to keep past lines on the chart and keep adding additional ones. And only the horizantal lines, not the sloping lines to the next level. Ideally i would love to draw 4hr, D, W S+R's on a 15M chart. The indicator would look back as far as it could and just keep adding lines across the chart. They would not all line up, but eventually they would bunch together at stronger levels.
Maybe it would look something like a heat map like below when it is plotted:
Have you tried something like this? Or do you knwo of any indicator that already does something like this?
Thanks.
emeeder
03 Dec 2014, 16:53
Also,
I know that the incator looks at past bars with the 1 minute values instead of ticks. uUnfortunately this allows only about 1 week of the indicator to be shown on the chart since 1 minute data is only available back that far.
Is there anyway you can think of that can solve that issue? or is accuracy just lost the further back you go since one would have to keep uping the timeframe (from 1M to 5 Min to 10Min) so that the indicator will keep displaying farther in history.
I guess maybe that makes the indicator that I suggested above not possible since it will not display back far enough.
jeex
05 Dec 2013, 11:48
MT4
Maybe someone can help translate this indicator to MQ4?
@jeex