issue on retrieving marketseries for Renko Chart

issue on retrieving marketseries for Renko Chart
02 Jun 2019, 18:41
I'm trying to draw horizontal line at Lowest/Highest of last number of Bars with Range Charts
With usual TimeFrame like H1, Lines are drawn correctly but with Range Bars say 10 Pips they are not
Could you please advice how to hard code for Range Bars 10 Pips ?
Complete Code
using System;
using cAlgo.API;
using cAlgo.API.Internals;
using cAlgo.API.Indicators;
using cAlgo.Indicators;

namespace cAlgo
{
    [Indicator(IsOverlay = true, TimeZone = TimeZones.UTC, AccessRights = AccessRights.None)]
    public class HighLow : Indicator
    {

        [Parameter("High Bar Color", DefaultValue = "Red")]
        public string ColorH { get; set; }

        [Parameter("Low Bar Color", DefaultValue = "Lime")]
        public string ColorL { get; set; }

        [Parameter("Last Lowest Bars", DefaultValue = "5")]
        public int LowBars { get; set; }

        [Parameter("Last Highest Bars", DefaultValue = "5")]
        public int HighBars { get; set; }


        protected override void Initialize()
        {
            // Initialize and create nested indicators
        }

        public override void Calculate(int index)
        {

            var series = MarketData.GetSeries(TimeFrame.Hour);
            var highPrice = series.High.Last(HighBars);
            var lowPrice = series.Low.Last(LowBars);

            Chart.DrawHorizontalLine("Resistance Area", highPrice, ColorH, 1, LineStyle.DotsRare);
            Chart.DrawHorizontalLine("Support Area", lowPrice, ColorL, 1, LineStyle.DotsRare);
Replies
RayAdam
03 Jun 2019, 18:34
( Updated at: 21 Dec 2023, 09:21 )
Thanks Panagiotis for looking into it
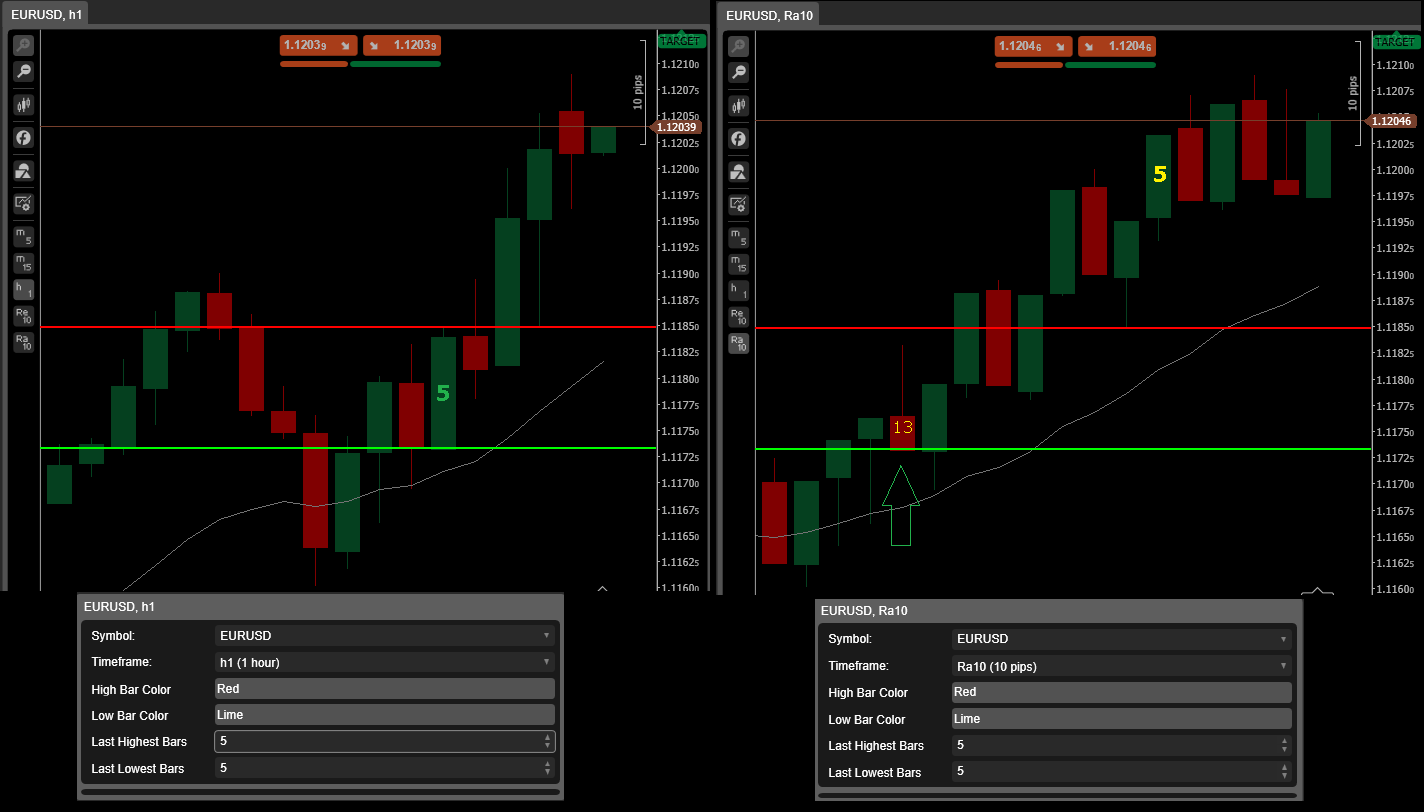
Please see the attached Candle chart as well as Range Chart
H1 Candle Chart has no issues
Range Chart is plotting lines but not at the right candle
I couldn’t find syntax equivalent to TimeFrame to call Range chart and I think as I have used TimeFrame.Hour at line 34 so indicator is ignoring supplied Range chart parameters and plotting the lines which are in line with H1 TimeFrame candles.
Whereas I want exactly the opposite, plotting lines on Candle chart (any TF) which are in line with Range Candles on set number of Pips
using System;
using cAlgo.API;
using cAlgo.API.Internals;
using cAlgo.API.Indicators;
using cAlgo.Indicators;

namespace cAlgo
{
    [Indicator(IsOverlay = true, TimeZone = TimeZones.UTC, AccessRights = AccessRights.None)]
    public class HighLow : Indicator
    {

        [Parameter("High Bar Color", DefaultValue = "Red")]
        public string ColorH { get; set; }

        [Parameter("Low Bar Color", DefaultValue = "Lime")]
        public string ColorL { get; set; }

        [Parameter("Last Highest Bars", DefaultValue = "5")]
        public int HighBars { get; set; }

        [Parameter("Last Lowest Bars", DefaultValue = "5")]
        public int LowBars { get; set; }


        protected override void Initialize()
        {
            // Initialize and create nested indicators
        }

        public override void Calculate(int index)
        {

            var series = MarketData.GetSeries(TimeFrame.Hour);
            var highPrice = series.High.Last(HighBars);
            var lowPrice = series.Low.Last(LowBars);

            Chart.DrawHorizontalLine("Resistance Area", highPrice, ColorH, 2, LineStyle.Solid);
            Chart.DrawHorizontalLine("Support Area", lowPrice, ColorL, 2, LineStyle.Solid);

        }
    }
}
@RayAdam
PanagiotisCharalampous
04 Jun 2019, 09:27
Hi RayAdam,
You are retrieving the same data in both cases, this is why the lines are drawn at the exact same place. At the moment, you cannot retrieve Range bars using MarketData.GetSeries().
Best Regards,
Panagiotis
@PanagiotisCharalampous
PanagiotisCharalampous
03 Jun 2019, 11:01
Hi RayAdam,
Thanks for posting in our forum. I had a look at your indicator but I cannot see any problem. I can see the lines in Range Bar 10 pips. Could you please elaborate?
Best Regards,
Panagiotis
@PanagiotisCharalampous