How To Identify Price Action Of The Previous and Compare It To The Current Bar
How To Identify Price Action Of The Previous and Compare It To The Current Bar
02 Jul 2013, 12:58
Hi everyone,
I am trying to figure out how to identify the following:

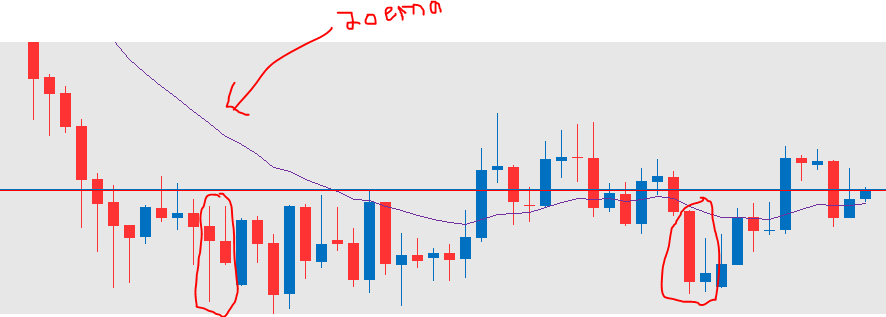
1) I want to identify all bars that are below the 20 EMA that are bear bars and when the next bar price action occurs within the price action of the previous bar. Then just want to display a simple YES above the bar. Also the bar must not touch the 20 EMA.
2) I would also like to identify all bars that are above the 20 EMA that are bulls bars and where the next bar all the price action occurs within the previous bar. Then just want to display a simple YES above the bar. Also the bar must not touch the 20 EMA.
I have managed to label individual bars with various bits of information such as open/close/low of the bar but am not sure how to compare the current bar price action to the previous bar. I am also struggling to find the current price of the 20 EMA to use it as a variable. Sorry I am just a beginner with this so any help you can give me would be much appreciated.
Thanks!
Glenn
Replies
CobainsCat
29 Jul 2013, 12:53
RE:
Hi,
To identify the previous bar below the 20 ema you can compare the price (open, close, high, low whichever you want) to the ema.
e.g. if ( MarketSeries.High[index-1] < ema.Result[index-1] )
where ema is: private ExponentialMovingAverage ema;
initialized in the Initialize() method:
e.g. ema = Indicators.ExponentialMovingAverage(MarketSeries.Close, 20);
To see if it is a bear bar you compare the open to close
e.g. if ( MarketSeries.Open[index-1] > MarketSeries.Close[index-1]
You can do the same for as far back as you want with a loop
for (int i = index - Period; i < index; i++)
            {
                var lastBarBelowEma = MarketSeries.High[i - 1] < ema.Result[i - 1];
                var lastBarBear = MarketSeries.Open[i - 1] > MarketSeries.Close[i - 1];
                var priceActionWithinLastBar = MarketSeries.High[i] < MarketSeries.High[i - 1] &&
                                               MarketSeries.Low[i] > MarketSeries.Low[i - 1];

                if (lastBarBelowEma && lastBarBear && priceActionWithinLastBar)
                {
                    double yValue = MarketSeries.High[i] + Symbol.PipSize*2;

                    ChartObjects.DrawText("objectName", "Yes", i, yValue, VerticalAlignment.Center,
                                          HorizontalAlignment.Center, Colors.Red);
                }

            }
You can do something the equivalent with bars above ema.
Hope it helps.
Hi ATrader,
Thank you very much for the kind response. I will give this a go.
Glenn
@CobainsCat

atrader
29 Jul 2013, 12:33
Hi,
To identify the previous bar below the 20 ema you can compare the price (open, close, high, low whichever you want) to the ema.
e.g. if ( MarketSeries.High[index-1] < ema.Result[index-1] )
where ema is: private ExponentialMovingAverage ema;
initialized in the Initialize() method:
e.g. ema = Indicators.ExponentialMovingAverage(MarketSeries.Close, 20);
To see if it is a bear bar you compare the open to close
e.g. if ( MarketSeries.Open[index-1] > MarketSeries.Close[index-1]
You can do the same for as far back as you want with a loop
for (int i = index - Period; i < index; i++)
            {
                var lastBarBelowEma = MarketSeries.High[i - 1] < ema.Result[i - 1];
                var lastBarBear = MarketSeries.Open[i - 1] > MarketSeries.Close[i - 1];
                var priceActionWithinLastBar = MarketSeries.High[i] < MarketSeries.High[i - 1] &&
                                               MarketSeries.Low[i] > MarketSeries.Low[i - 1];

                if (lastBarBelowEma && lastBarBear && priceActionWithinLastBar)
                {
                    double yValue = MarketSeries.High[i] + Symbol.PipSize*2;

                    ChartObjects.DrawText("objectName", "Yes", i, yValue, VerticalAlignment.Center,
                                          HorizontalAlignment.Center, Colors.Red);
                }

            }
You can do something the equivalent with bars above ema.
Hope it helps.
@atrader