Multiple timeframe indicator malfunctioning (redraw error?)
31 Jan 2017, 19:54
Hello All,
I’m new to programming my own indicators and would love to get some feedback/support on an issue I’m having.
INTRO/BACKGROUND:
I’ve created an indicator (code below) which gives the close price of the 3minute chart. I’ve been using this indicator on the 1minute chart. I use this indicator’s data for the calculation of other indicators.
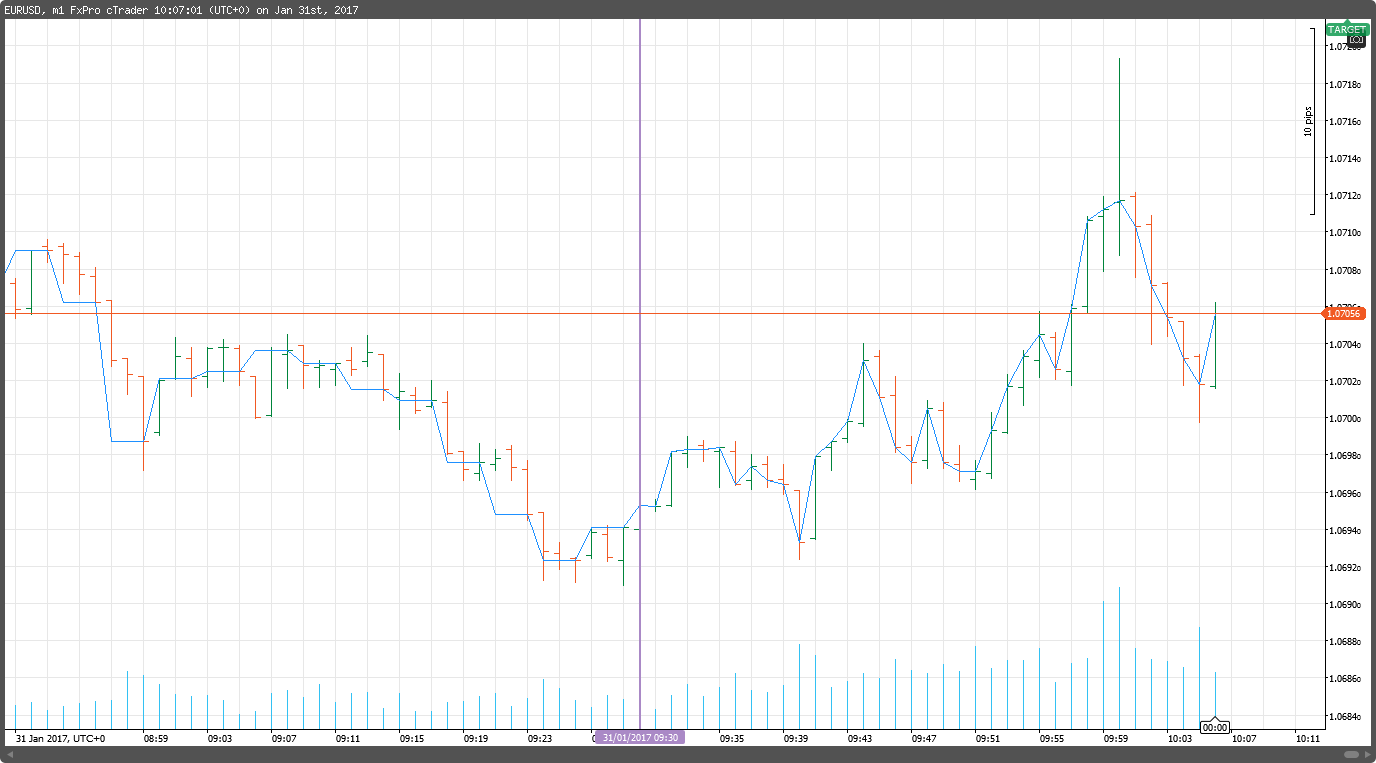
I’ve added an image of the indicator in use below (blue line). The vertical purple line shows where I opened the chart.
To the left: the historical data;
To the right: the real-time data.
BELOW: 3m Close indicator Chartshot [Vertical purple line = chart open]

ISSUE DESCRIPTION:
You can see that with the historical data the indicator retroactively does a great job. With the real-time data however it simply gives the close price of the active 1minute chart. I understand that from opening the 3m bar and closing the 3m bar, the “close” price is simply the current price – but then why does it just start joining the dots of the close prices of the 1m chart??
I would expect that it should be a straight line from the last 3m close to the current price and become fixed in its position when the 3m close is up.
TEMPORARY SOLUTION:
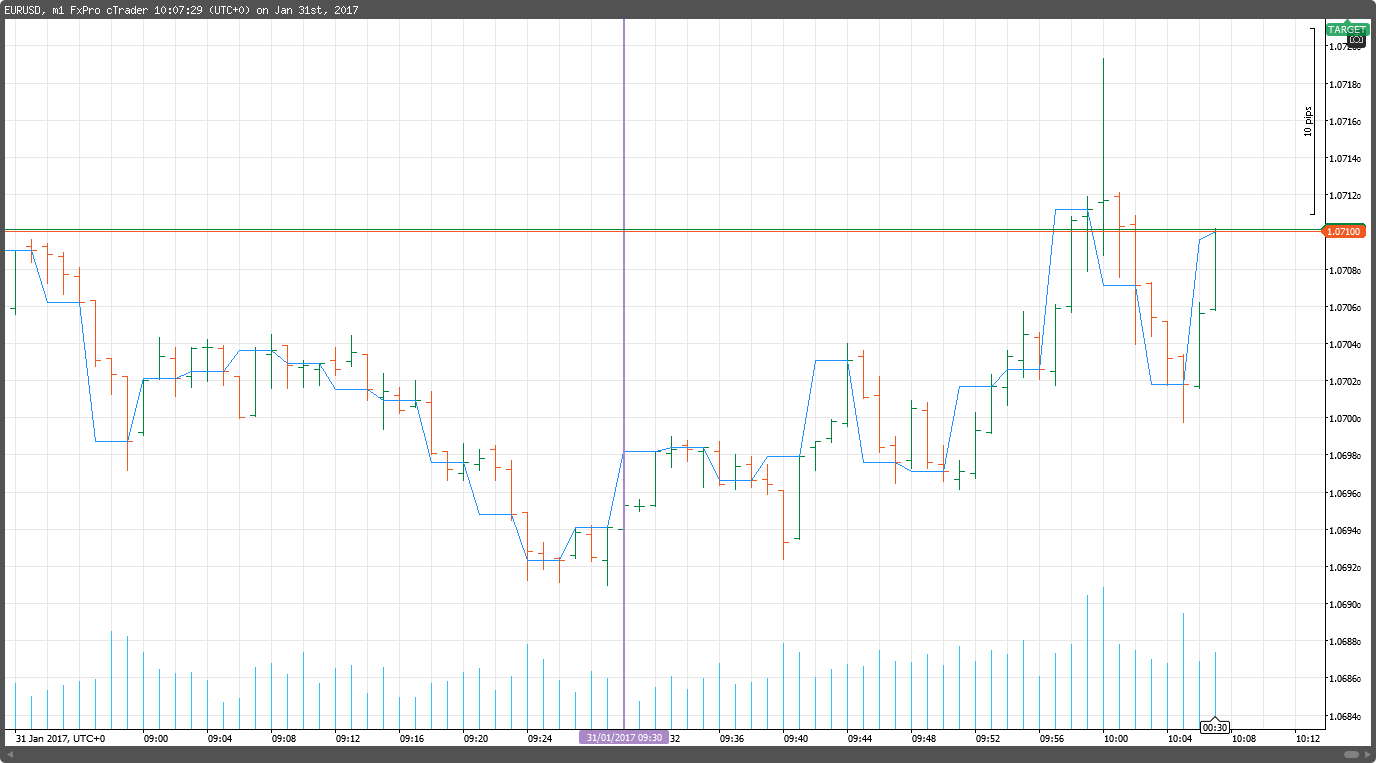
Refreshing the chart fixes the redraw issue up to the point of refresh but then continues to give 1m close in real-time.
BELOW: 3m Close indicator Chartshot AFTER REFRESH [Vertical purple line = chart open]:

WHY THIS CAUSES PROBLEMS:
Because I have other indicators referenced/calculated using the 3m close, it basically throws them all out of whack as well. This also appears to carry itself to robots, even when backtesting. It’s all a mess. This is apparent when explicitly sourcing the indicator as well as implicitly referencing it inside another indicator.
AIM:
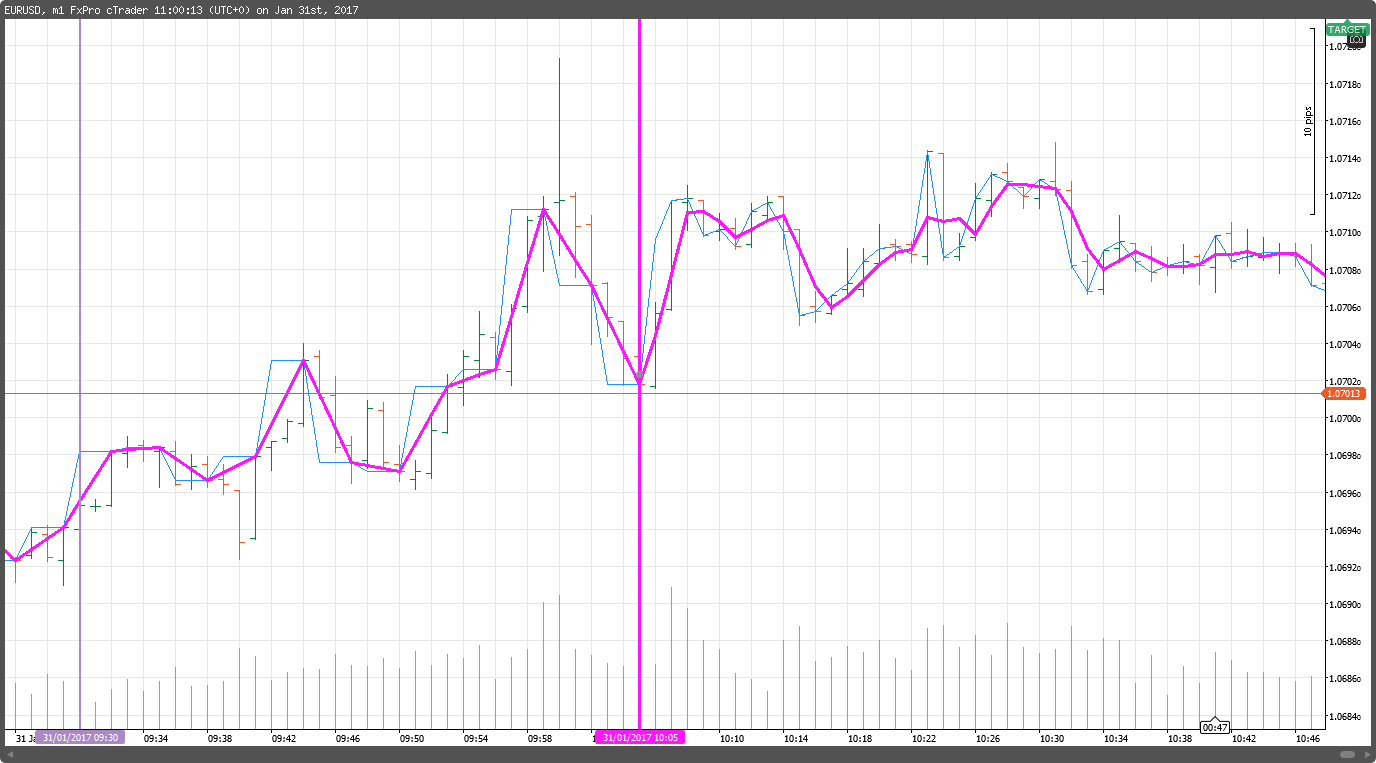
I’ve added another image showing a pink line tracing the price points. This line is a 3 period Simple MA using the 3m close indicator as its source. It appears to do a good job of linking the 3m close prices with straight lines – until it becomes real-time!
This is essentially what I’m after, or what I wish to accomplish: creating lines using the other timeframe data points.
It's not an issue for me if the calculated variables are not "fixed" until the end of the 3m period, i.e. between 3m close points.
BELOW: 3m Close indicator Chartshot with 3 period SMA explicitly added [Pink], [Vertical pink line = chart open]:

Additional points:
I’ve seen the “multiple –timeframe moving average” example at /forum/whats-new/1463
This is what I used as a template when creating
1) The Close price indicator; and
2) An MA implicitly referencing the 3m close (code & chartshot below).
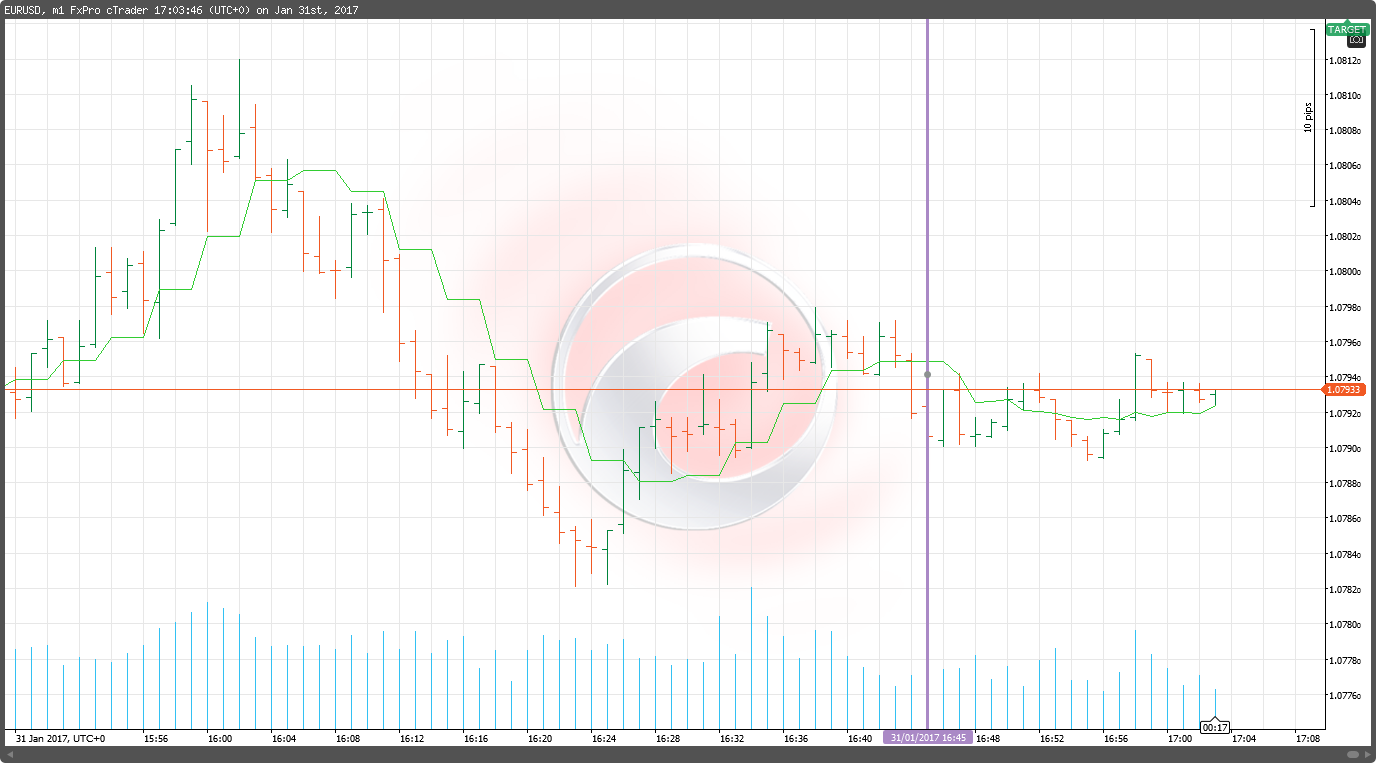
Doesn't really look like the example we see at the link...
BELOW: Simple MA with 3m Close implicit indicator Chartshot, period=3 [Vertical purple line = chart open]:

I hope someone smarter than me can see where I’ve made a rookie mistake or assumption and knows how to remedy it.
Maybe I've also been staring at this stuff for too long o.O
Thanks for taking the time to look at this.
John
BELOW: 3m Close indicator code:
using System;
using cAlgo.API;
using cAlgo.API.Internals;
using cAlgo.API.Indicators;
using cAlgo.Indicators;

namespace cAlgo
{
    [Indicator(IsOverlay = true, AccessRights = AccessRights.None)]
    public class Close_3m : Indicator
    {
        [Output("Main", Color = Colors.DodgerBlue)]
        public IndicatorDataSeries Result { get; set; }

        private MarketSeries series3;

        protected override void Initialize()
        {
            series3 = MarketData.GetSeries(TimeFrame.Minute3);
        }

        public override void Calculate(int index)
        {
            var index3 = series3.OpenTime.GetIndexByTime(MarketSeries.OpenTime[index]);
            if (index3 != -1)
                Result[index] = series3.Close[index3];
        }
    }
}
BELOW: Simple MA with 3m Close implicit indicator code:
using System;
using cAlgo.API;
using cAlgo.API.Internals;
using cAlgo.API.Indicators;
using cAlgo.Indicators;

namespace cAlgo
{
    [Indicator(IsOverlay = true, AccessRights = AccessRights.None)]
    public class Close_3m_MA_v2 : Indicator
    {
        [Parameter(DefaultValue = 1)]
        public int Period { get; set; }

        [Output("Main", Color = Colors.LimeGreen)]
        public IndicatorDataSeries Result { get; set; }

        private MarketSeries series3;
        private MovingAverage ma3;

        protected override void Initialize()
        {
            series3 = MarketData.GetSeries(TimeFrame.Minute3);
            ma3 = Indicators.MovingAverage(series3.Close, Period, MovingAverageType.Triangular);
        }

        public override void Calculate(int index)
        {
            var index3 = series3.OpenTime.GetIndexByTime(MarketSeries.OpenTime[index]);
            if (index3 != -1)
                Result[index] = ma3.Result[index3];
        }

        private int GetIndexByDate(MarketSeries series, DateTime time)
        {
            for (int i = series.Close.Count - 1; i > 0; i--)
            {
                if (time == series.OpenTime[i])
                    return i;
            }
            return -1;
        }
    }
}
Replies
JohnK
01 Feb 2017, 13:17
RE:
tmc. said:
Hi John, you are reading close value of 3-minute chart every minute. Therefore it returns you close value of a bar that is still in the progress. You would need to repaint previous values of all indexes that are within one 3-minute chart bar in order to achieve flat lines as in the history where you can read only OHLC values of closed bars. I hope it makes any sense.
Hi tmc
I appreciate you getting back to me. As I mentioned, my "temporary solution" for repainting has been to refresh the chart periodically. Do you know of a way in which the indicator can be made to repaint itself upon closing the 3m bar? And I guess subsequently any indicators referencing this if need be?
@JohnK
whis.gg
01 Feb 2017, 13:53
You can't force other indicators referencing to this to repaint as well but here is the solution the indicator itself.
using cAlgo.API;
using cAlgo.API.Internals;

namespace cAlgo
{
    [Indicator(IsOverlay = true, TimeZone = TimeZones.UTC, AccessRights = AccessRights.None)]
    public class PricePoints : Indicator
    {
        [Parameter("Timeframe", DefaultValue = "Minute3")]
        public TimeFrame CustomTimeFrame { get; set; }

        [Output("Main")]
        public IndicatorDataSeries Result { get; set; }

        private MarketSeries ms;
        private int lastIdx;

        protected override void Initialize()
        {
            ms = MarketData.GetSeries(CustomTimeFrame);
        }

        public override void Calculate(int index)
        {
            var idx = ms.OpenTime.GetIndexByTime(MarketSeries.OpenTime[index]);

            if (idx != lastIdx)
            {
                Result[index] = ms.Close[idx];
                lastIdx = idx;
            }
            else
            {
                for (int i = MarketSeries.OpenTime.GetIndexByExactTime(ms.OpenTime[idx]); i <= index; i++)
                {
                    Result[i] = ms.Close[lastIdx];
                }
            }
        }
    }
}
@whis.gg
whis.gg
01 Feb 2017, 14:36
This is essentially what I’m after, or what I wish to accomplish: creating lines using the other timeframe data points.
You should make a method that would do the work rather than complicating it by using moving average. See the solution below.
using cAlgo.API;
using cAlgo.API.Internals;

namespace cAlgo
{
    [Indicator(IsOverlay = true, TimeZone = TimeZones.UTC, AccessRights = AccessRights.None)]
    public class PricePoints : Indicator
    {
        [Parameter("Timeframe", DefaultValue = "Minute3")]
        public TimeFrame CustomTimeFrame { get; set; }

        [Output("Main")]
        public IndicatorDataSeries Result { get; set; }

        private MarketSeries ms;
        private int lastIdx = 0;

        protected override void Initialize()
        {
            ms = MarketData.GetSeries(CustomTimeFrame);
        }

        public override void Calculate(int index)
        {
            var idx = ms.OpenTime.GetIndexByExactTime(MarketSeries.OpenTime[index]);

            if (idx > lastIdx)
            {
                Result[index - 1] = ms.Close[idx - 1];
                lastIdx = idx;
            }
            //else
            //{
            //    Result[index] = MarketSeries.Close[index];

            //    for (int i = MarketSeries.OpenTime.GetIndexByExactTime(ms.OpenTime[lastIdx]); i < index; i++)
            //    {
            //        Result[i] = double.NaN;
            //    }
            //}
        }
    }
}
Commented area is plotting last bar that is still in the progress.
@whis.gg
JohnK
01 Feb 2017, 20:40
RE:
Thanks for taking the time and effort to respond and offer solutions. It's much appreciated!
I've had the chance now to look at the two solutions you gave. As I said I'm new to coding my own indicators and coding in general so I’m a bit slow at this. I've just been trying to get my head around what you've shown.
Looking at your first solution...
What I see it does:
Creates an indicator value for each Chart-TF index point / bar.
Indicator value @Custom-TF index point = Custom-TF value.
Indicator value between last Custom-TF index and current Chart-TF index = Current Close value (= same for both Custom-TF & Actual-TF) = Current price.
How the data affects downstream calculations/referenced indicators:
Any referenced indicator which is calculated using e.g. “Source[index]” calculates only values at the Custom-TF index – no in between values are considered from the Chart-TF. Plotted calculated values remain.
Looking at your second solution...
What I see it does:
(Without else clause)
Creates an indicator value only for each Chart-TF index point / bar which coincides with the Custom-TF index.
(With else clause)
Additionally creates an indicator value for the current Chart-TF index point = Current Close value (= same for both Custom-TF & Actual-TF) = Current price.
How the data affects downstream calculations/referenced indicators:
Any referenced indicator which is calculated using e.g. “Source[index]” calculates only values at the Custom-TF index – no in between values are considered from the Chart-TF. Plotted calculated values disappear.
I’ve tried to follow and understand your code. I assume the reason why the downstream calculations suffer is because in cases where the Custom-TF & Chart-TF don’t coincide, the result is not Result[index] but Result[i] - and and indicator calculating using Source[index] doesn't pick-up the Result[i]...?
Also, I have no idea how the “lastIdx” works. Completely lost here. No idea what it is or how it’s used. Seems to come out of nowhere, fits everywhere, and is very useful.
@JohnK
whis.gg
01 Feb 2017, 23:34
Let me make few things clear. the Calculate(int index) method that you override in the indicator is called on each bar (index) starting from zero - first bar on the chart (historical) up to current bar and then it's called on each price change during live market, therefore it's most likely going to be called multiple times with same index and you might call it repainting at latest bar.
When you are getting series from different timeframe the index values are not equal to your chart timeframe. Therefore you always need to find associated index between both series. That's the reason why indicator acts slightly different on historical and live data. The built-in function GetIndexBy(Exact)Time will know "future" close of that candle, because it's already closed when retrieved in the history. During live market it's going to return you current close value, but this value might change until new bar opens.
The variable called lastIdx is just holding last index of custom market series and checks for new bar (higher index) - it's true only when new bar opens.
The loops I used are both different. In first solution it's repainting historical values of the indicator Result in order to duplicate historical chart behaviour. The second solution is just setting NaN values of all previous candles that are not equal to close time of custom timeframe so it doesn't plot flat line anymore but connects points only.
Essentially you want to make the source indicator not to be repainting at all or delegate an event which would hold indexes that were repainted as args and subscribe to it in the indicator that's using it. Then you can force the indicator to recalculate certain indexes as well.
@whis.gg
JohnK
02 Feb 2017, 16:17
RE:
OK, I see. That explanation made it clearer for me, thanks. I think I'm starting to get my head around it a bit now.
I should say thanks! Not only for providing the different solutions but also for helping me understand these things a bit better. Definitely much appreciated!
@JohnK

whis.gg
01 Feb 2017, 10:08
Hi John, you are reading close value of 3-minute chart every minute. Therefore it returns you close value of a bar that is still in the progress. You would need to repaint previous values of all indexes that are within one 3-minute chart bar in order to achieve flat lines as in the history where you can read only OHLC values of closed bars. I hope it makes any sense.
@whis.gg