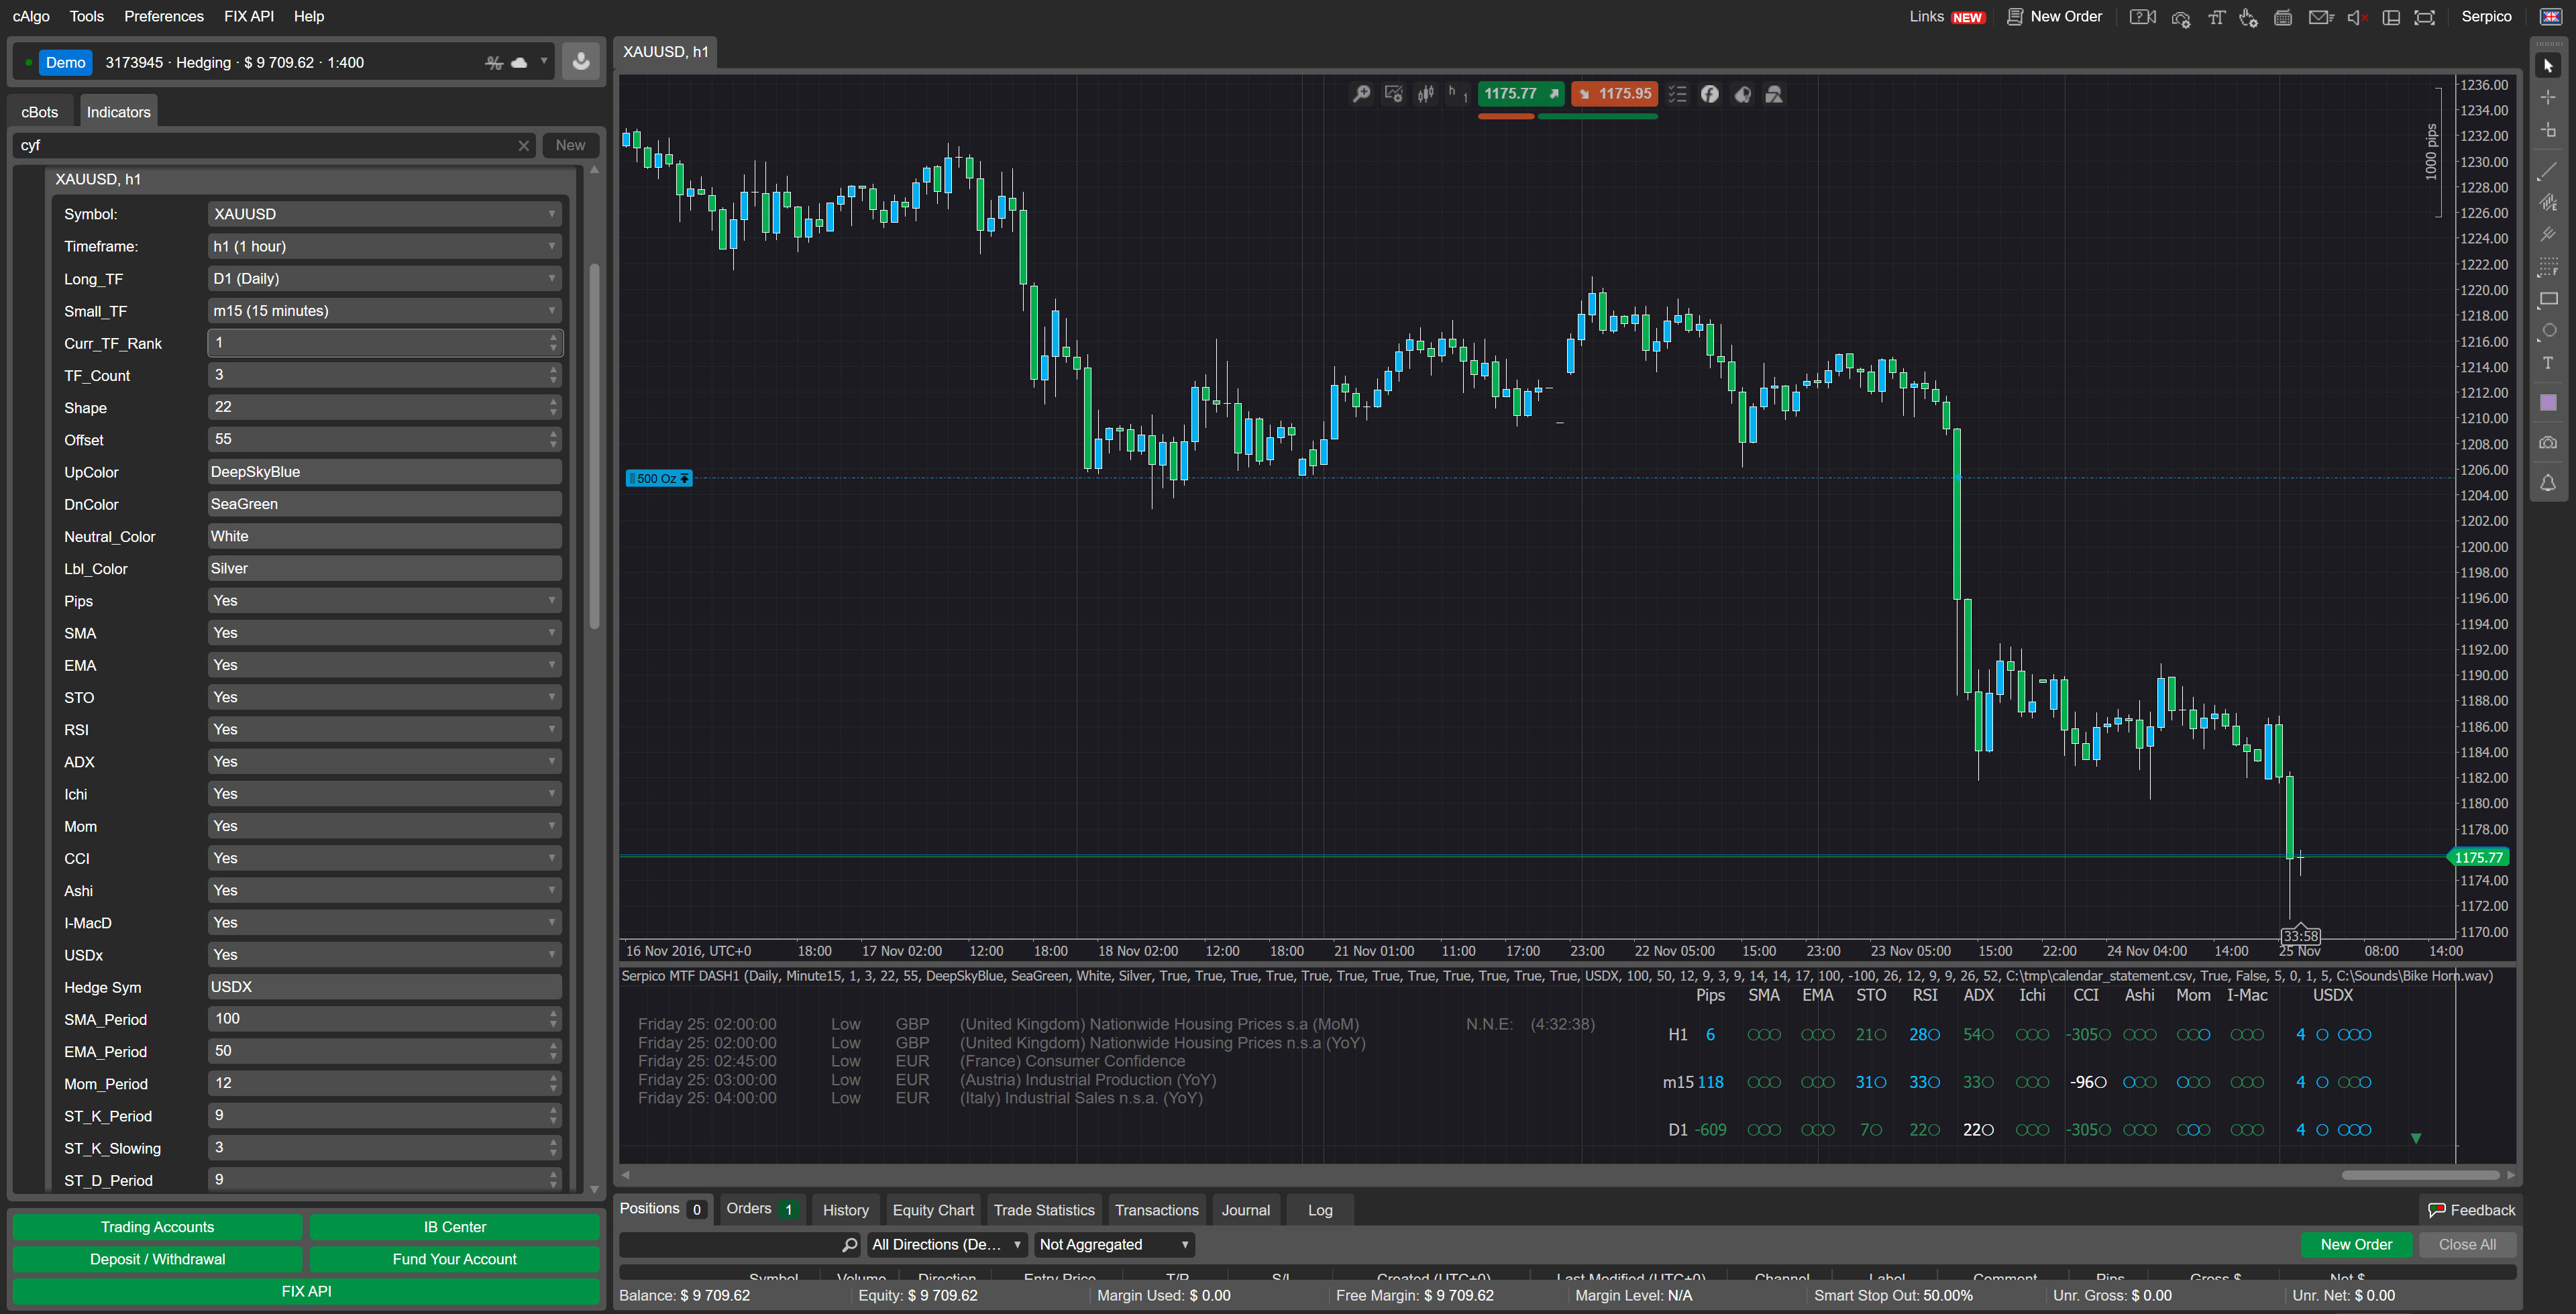
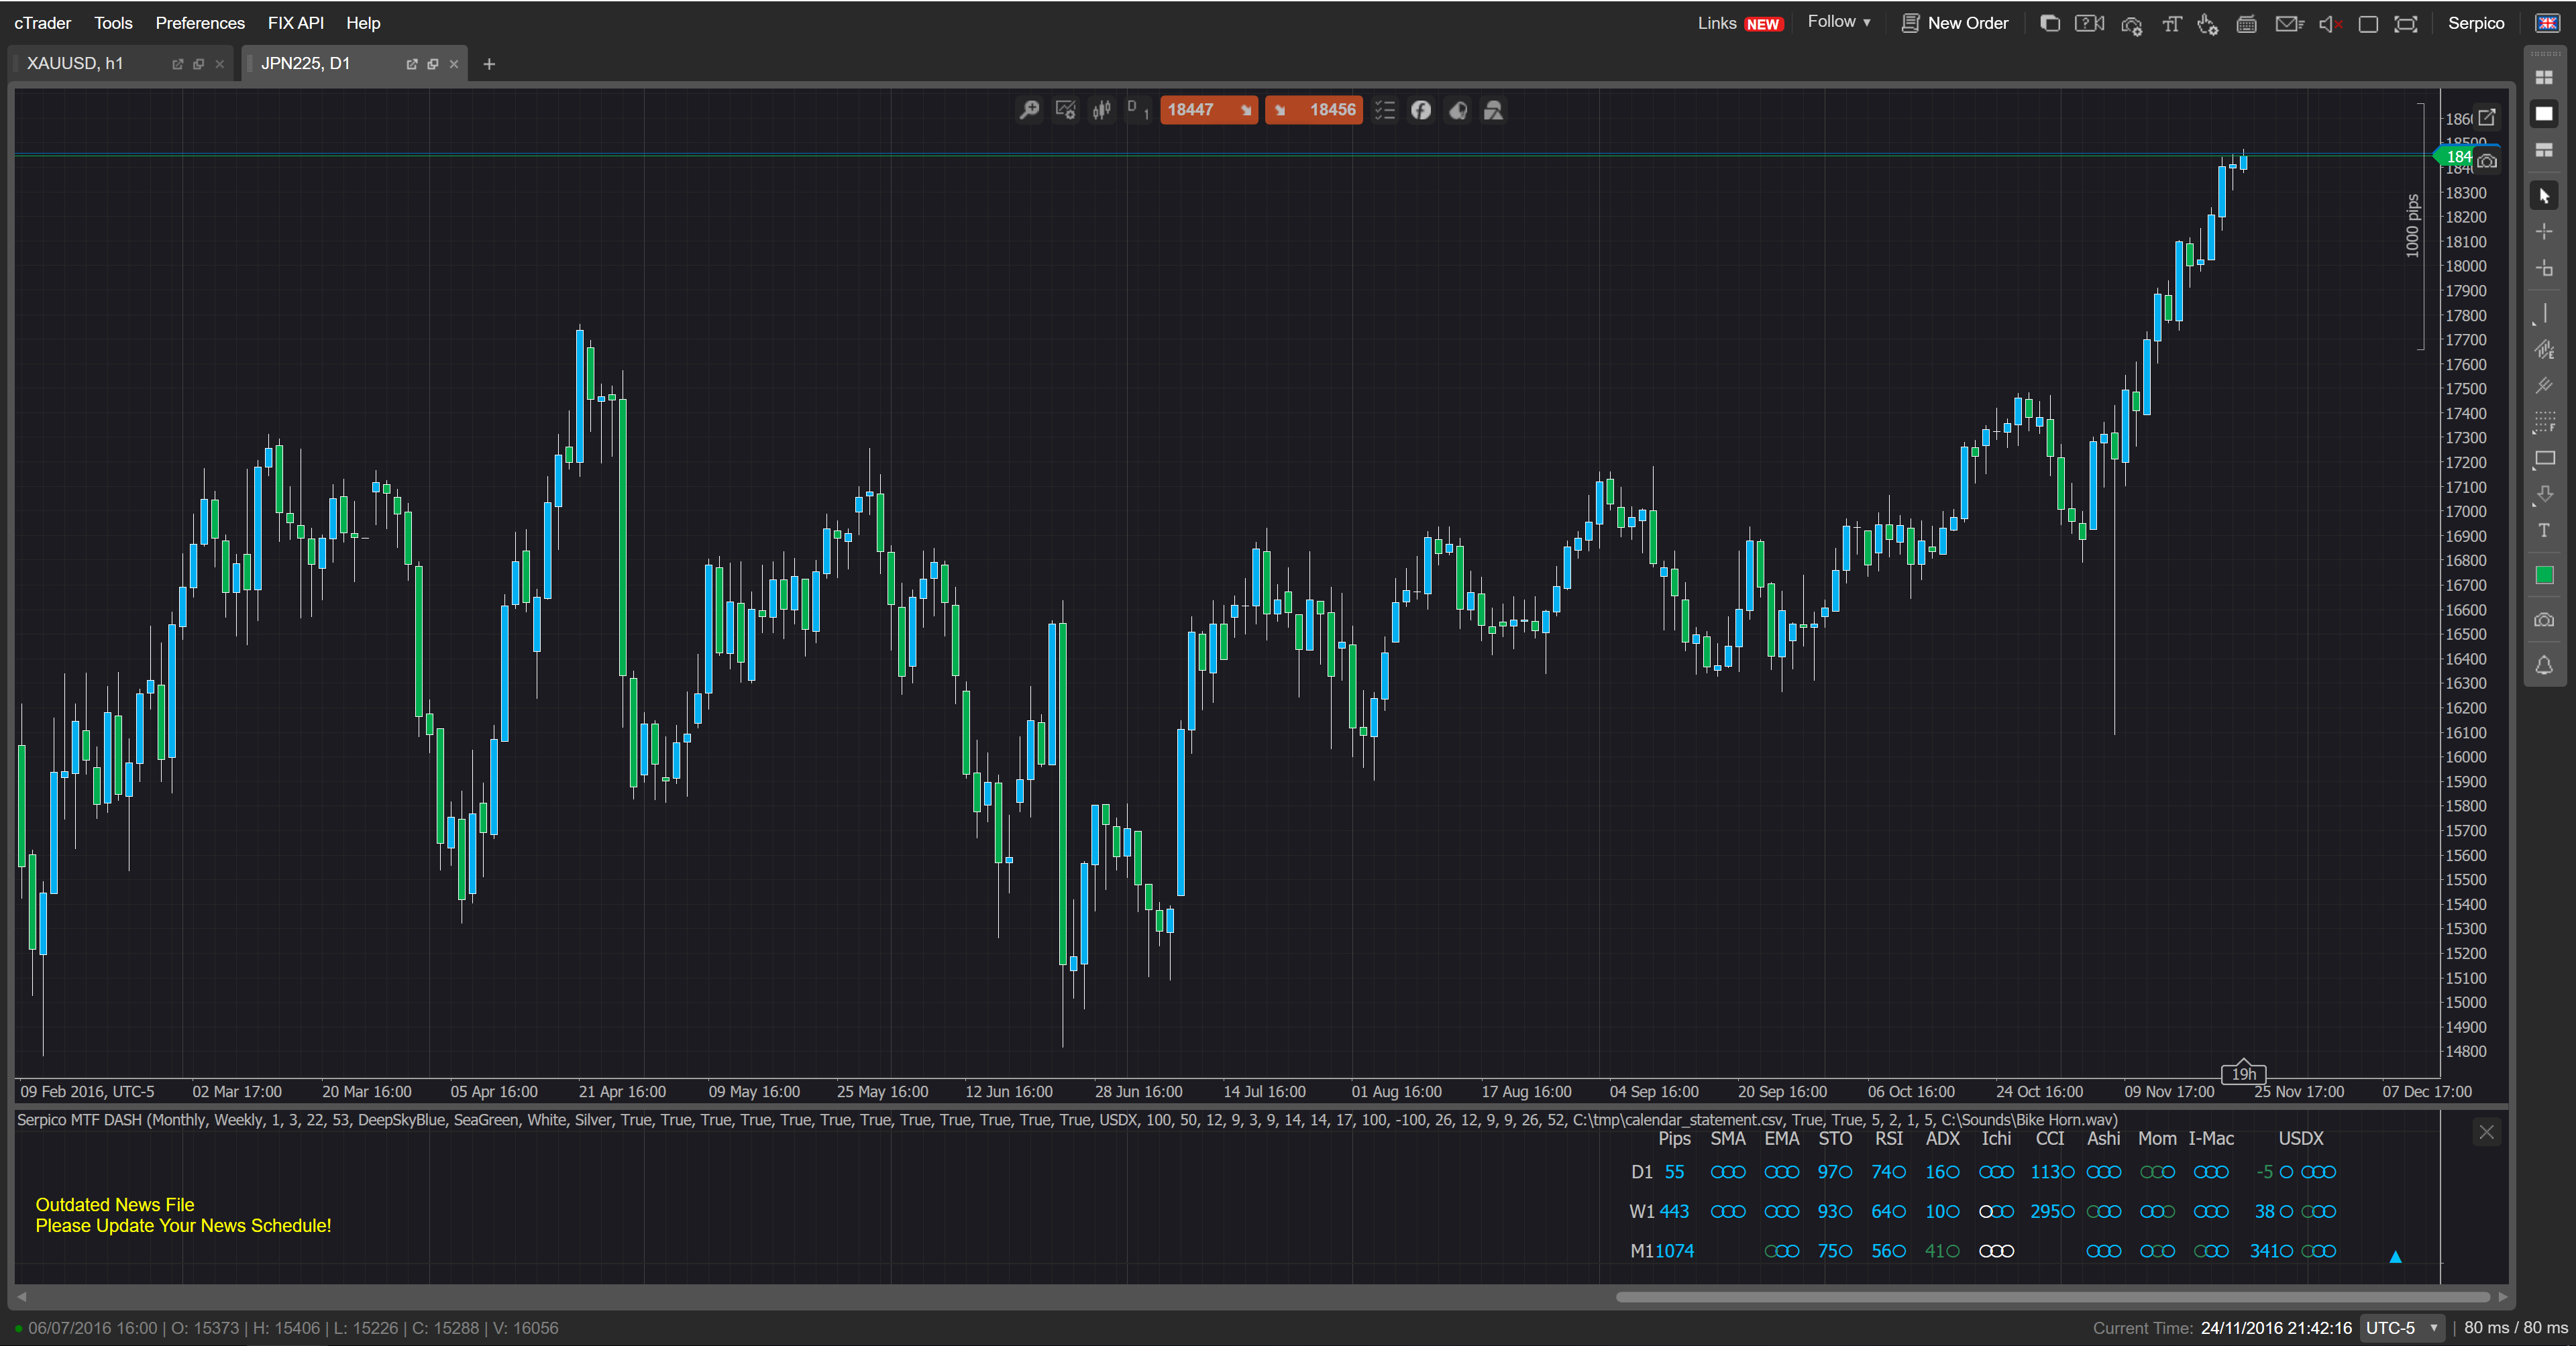
Serpico Multiple Time Frame Dashboard with News module

Serpico Multiple Time Frame Dashboard with News module
25 Nov 2016, 05:15
Serpico Multiple Time Frame Dashboard with News module
Basic Indicator Information
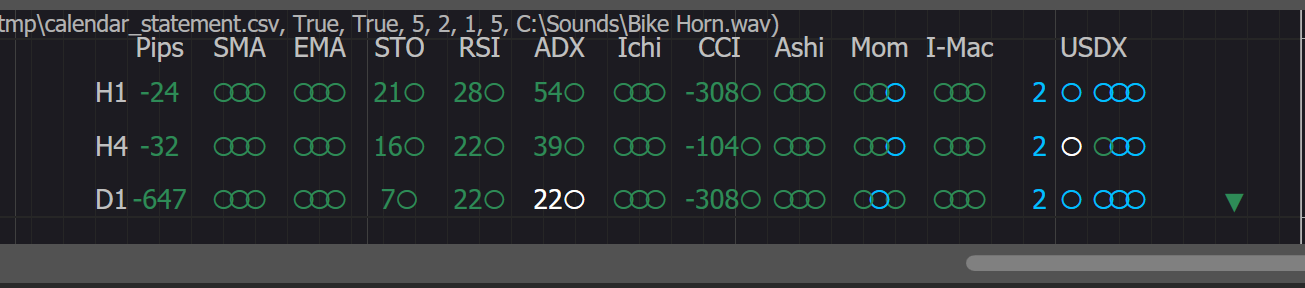
-SMA (100 Period Default)
-Simple Moving Average :
Bars represent the Direction of the moving Average , If a bar is bullish ,it means it exceeds the previous bar in value .. I.e. more in PRICE
and if a Bar Is bearish it means its Value is less than the previous Bar
I.e Less in Price .
-EMA (50 Period Default)
-Exponential Moving Average :
Bars represent the Direction of the moving average , If a Bar Is bullish, it means it exceeds the previous bar in value
.. I.e. more in Price & the Opposite for the other direction.
- Ichimoku
White in ichimoku means the price is in the Cloud .. this simply means NO Trade .. Price is in a support or resistance area IF "UpColor" .. it means price is above the cloud --->BUY IF "DnColor" .. it means price is below the cloud ---> SELL
-Momentum :
Same as Moving Averages , Bullish bar when the current value exceeds the previous value & vice versa .
If price is going down , and the Lower time frame starts to plot Bullish color ... this indicates a near reversal
it means the power/momentum behind Selling is decreasing .. because in selling Dream indicator should plot
bearish bars. if it plots bullish bars .. this indicates loss of power or even Divergence .
-RSI :
The Number represents the current value of RSI , The Bar represents the direction
If the current value exceeds the previous value .. Bullish Color
if the current value is less than the previous value .. bearish color
- News Module
Filter by Symbol, Filter by priority, 8 Lines Max, Clock
- Ashi
Plots last 3 candles on selected Time Frames, When all 3 are Bullish or Bearish Plots an Arrow Signal
- Hedge Sym
Displays last 3 Ashi Candles on selected Symbol and Momentum on the selected Time Frames
- I-Mac
impulse MACD
- Pips
Pips Heat MAP
If interested in this Indicator
EMail. silvioduque@mail.com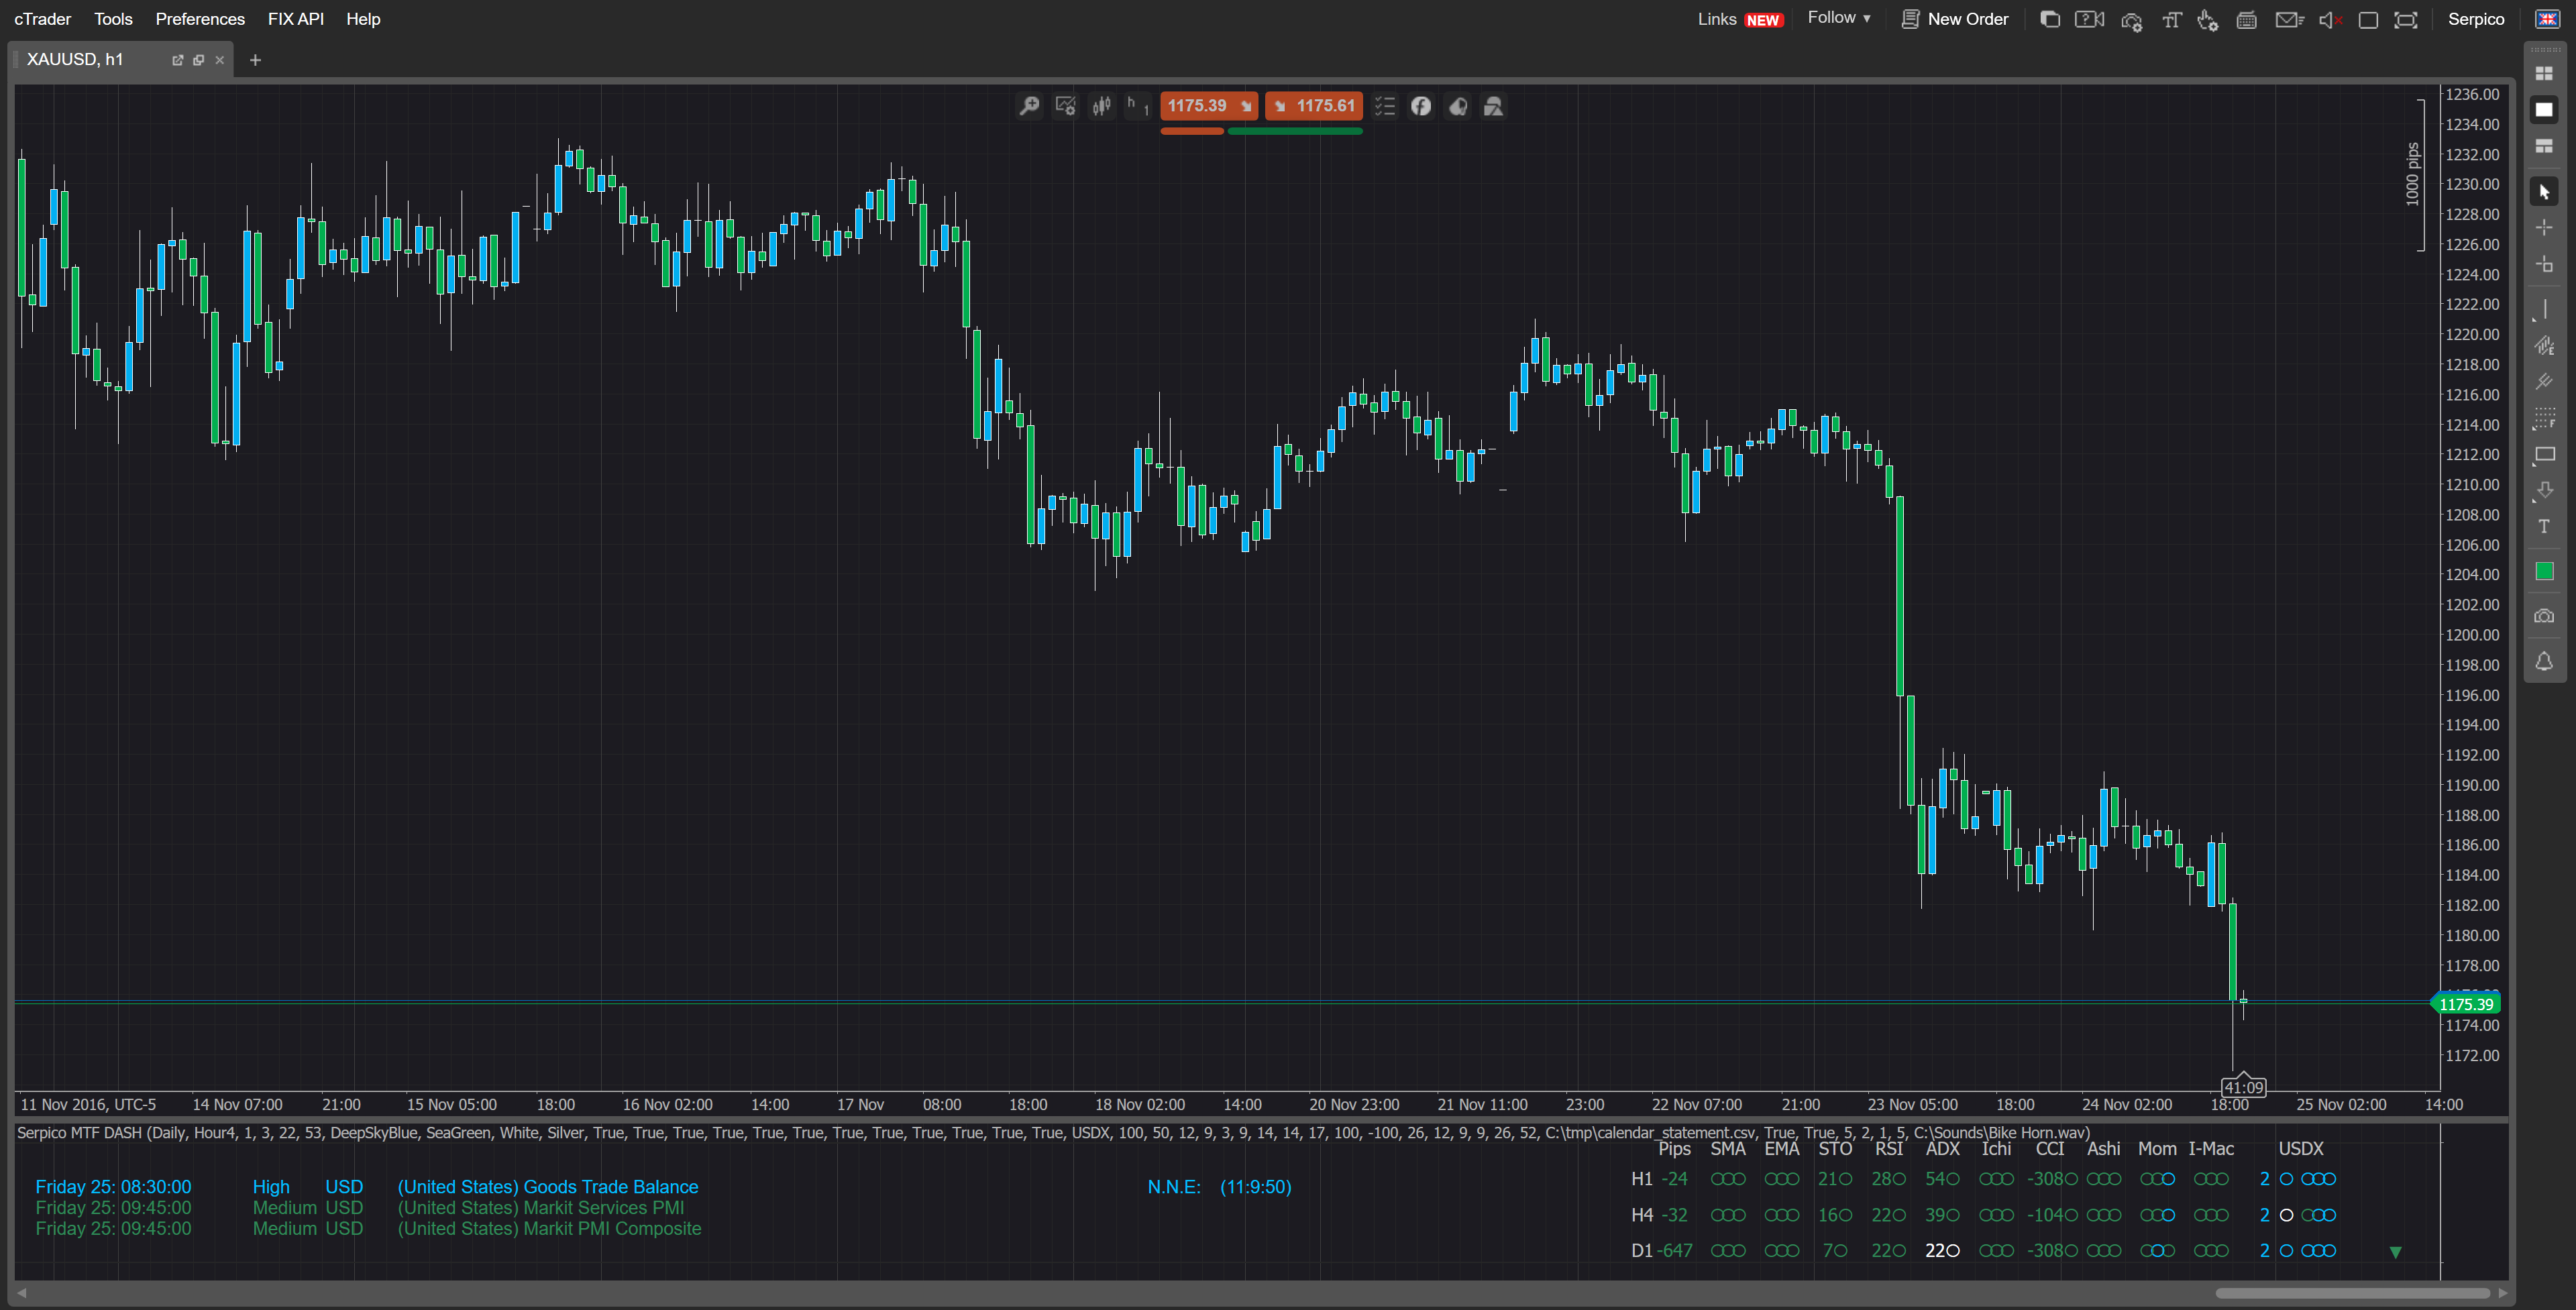

This Indicator was coded for me by a forum member, NOT FREE
... Deleted by UFO ...