How in ctrader make indicator position right to price axis

How in ctrader make indicator position right to price axis
01 Dec 2024, 10:30
Greetz!
How in cTrader make the indicator position right to price axis, and not to time separator, maximum I could figure out is to do DateTime endTime = lastBarTime.AddMinutes(20);
but if I zoom in or out, how to make it adapt to the price axis? I'm using Chart.DrawRectangle, can't find any method, to stick it to price ;(
Replies
PanagiotisCharalampous
02 Dec 2024, 07:52
RE: How in ctrader make indicator position right to price axis
EDG777 said:
not working ;\
Hi there,
Please share your indicator code so that we can help you further.
Best regards,
Panagiotis
@PanagiotisCharalampous
EDG777
02 Dec 2024, 10:51
( Updated at: 02 Dec 2024, 14:15 )
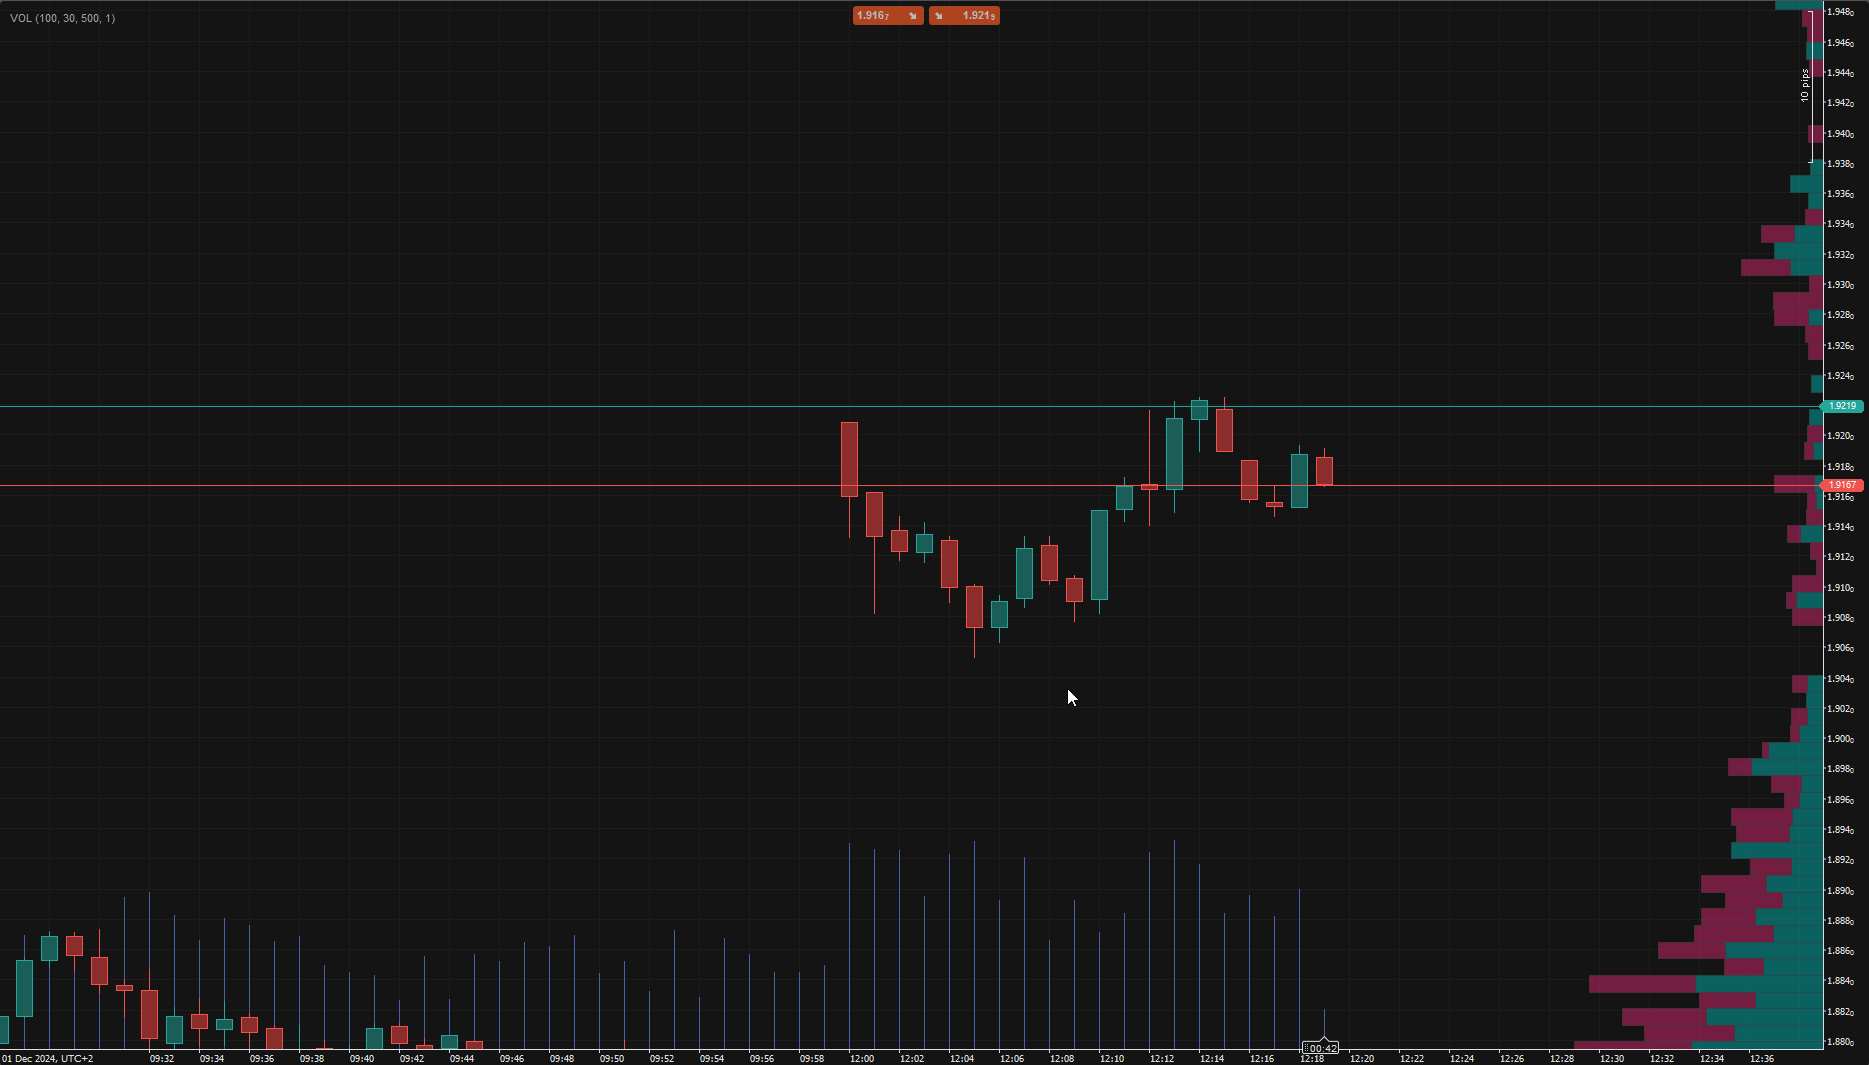
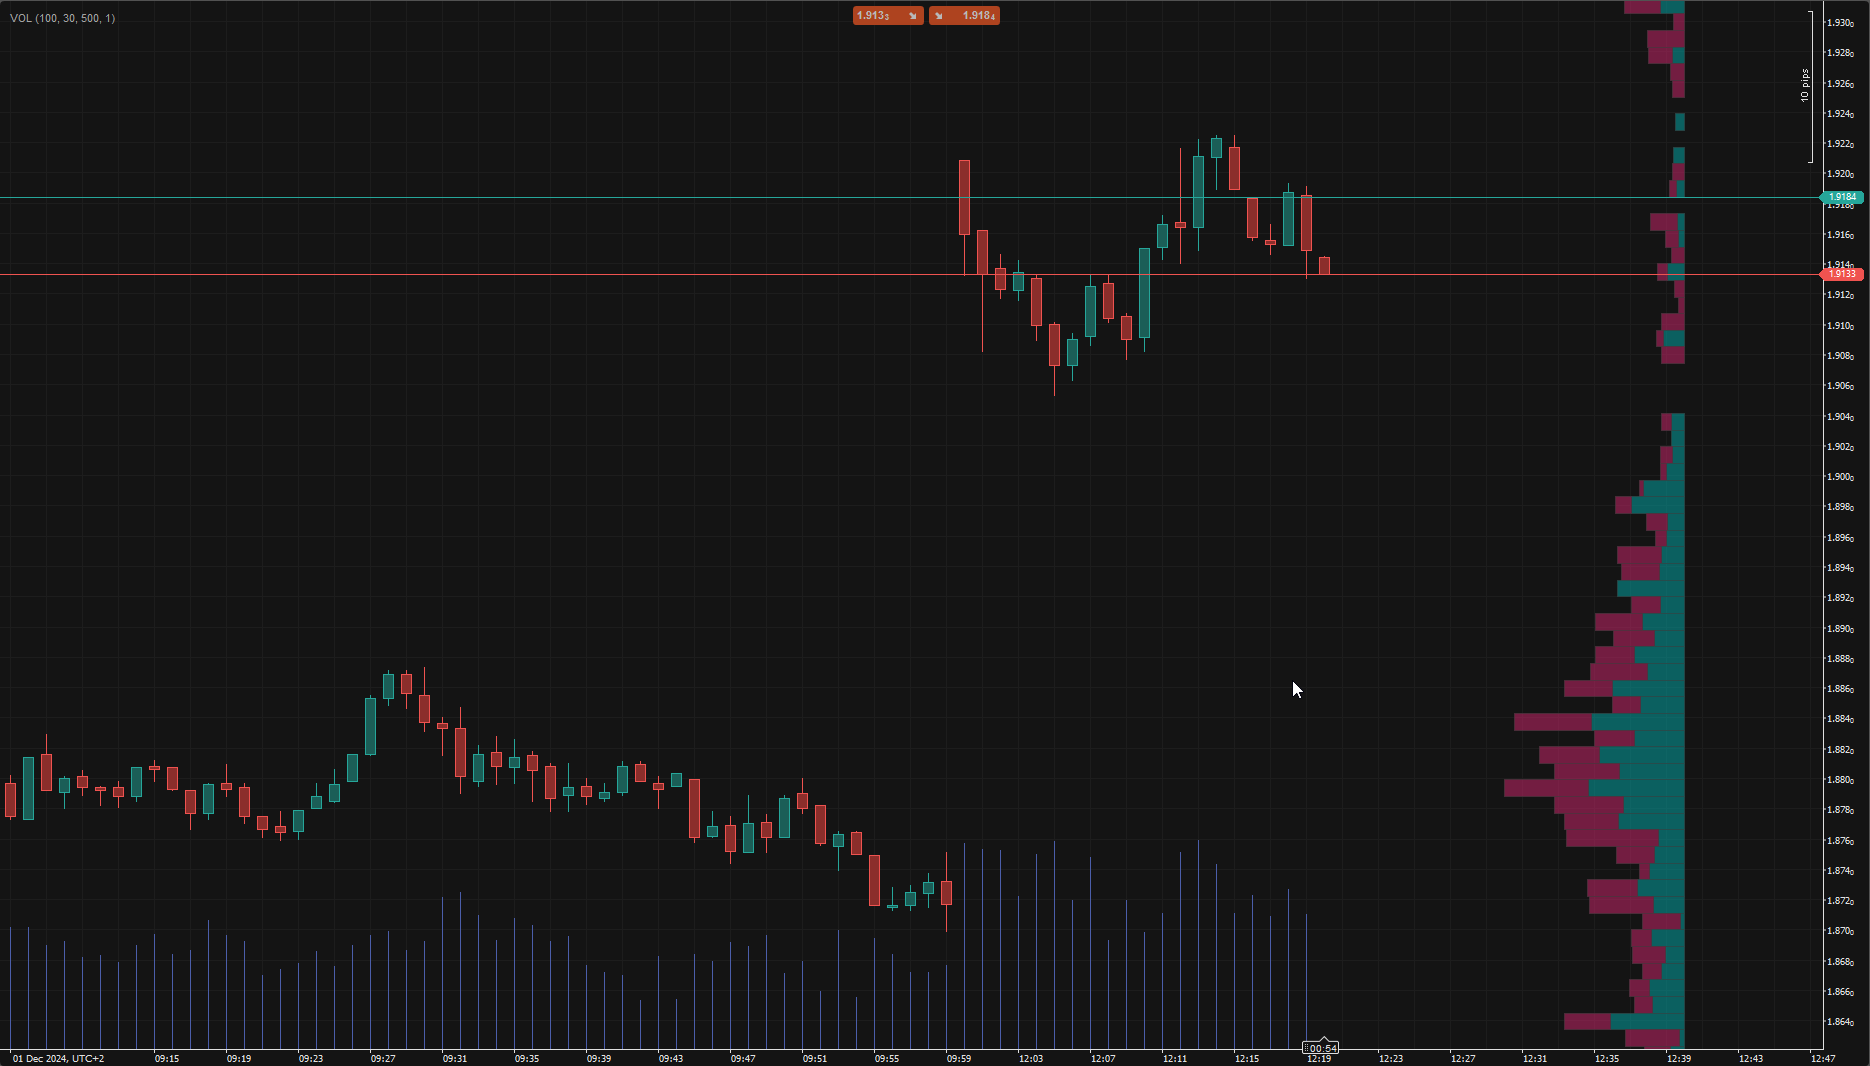
Basicly I'm trying to copy this indicator:
https://www.tradingview.com/support/solutions/43000703076-visible-range-volume-profile/

using System;
using System.Collections.Generic;
using System.Linq;
using cAlgo.API;
using cAlgo.API.Indicators;
using cAlgo.API.Internals;

namespace cAlgo.Indicators
{
    [Indicator(IsOverlay = true, TimeZone = TimeZones.UTC, AccessRights = AccessRights.None)]
    public class EnhancedVolumeProfile : Indicator
    {
        [Parameter("Number of Rows", DefaultValue = 24, MinValue = 10, MaxValue = 100)]
        public int RowSize { get; set; }

        [Parameter("Width (Minutes)", DefaultValue = 30, MinValue = 5, MaxValue = 200)]
        public int WidthInMinutes { get; set; }

        [Parameter("Lookback Bars", DefaultValue = 500, MinValue = 10, MaxValue = 5000)]
        public int LookbackBars { get; set; }

        [Parameter("Zoom Scale Factor", DefaultValue = 1.0, MinValue = 0.1, MaxValue = 5.0)]
        public double ZoomScaleFactor { get; set; }

        private Color upColor;
        private Color downColor;
        private Color borderColor;
        private Dictionary<double, VolumeData> volumeProfile;

        protected override void Initialize()
        {
            upColor = Color.FromArgb(120, 0, 180, 180);
            downColor = Color.FromArgb(120, 220, 38, 115);
            borderColor = Color.FromArgb(180, 50, 50, 50);
            volumeProfile = new Dictionary<double, VolumeData>();
        }

        public override void Calculate(int index)
        {
            // Only process if we're at the last visible bar
            if (index != Chart.LastVisibleBarIndex)
                return;

            // Clear previous drawings on each calculation
            Chart.Objects.Where(obj => obj.Name.StartsWith("VP_")).ToList().ForEach(obj => Chart.RemoveObject(obj.Name));

            int startIndex = Math.Max(0, index - LookbackBars);

            // Calculate the time span between bars to determine zoom level
            TimeSpan barTimeSpan = index > 0
                ? MarketSeries.OpenTime[index] - MarketSeries.OpenTime[index - 1]
                : TimeSpan.FromMinutes(1);

            // Adjust the offset based on chart timeframe and zoom
            int baseOffset = (int)(180 * ZoomScaleFactor); // Base offset in seconds
            double timeframeAdjustment = barTimeSpan.TotalSeconds / 60.0; // Adjustment based on timeframe
            int adjustedOffset = (int)(baseOffset * timeframeAdjustment);

            double priceHigh = double.MinValue;
            double priceLow = double.MaxValue;

            for (int i = startIndex; i <= index; i++)
            {
                if (MarketSeries.High[i] > priceHigh)
                    priceHigh = MarketSeries.High[i];
                if (MarketSeries.Low[i] < priceLow)
                    priceLow = MarketSeries.Low[i];
            }

            double priceRange = priceHigh - priceLow;
            double rowHeight = Math.Max(Symbol.TickSize, Math.Round(priceRange / RowSize / Symbol.TickSize) * Symbol.TickSize);

            volumeProfile.Clear();

            // Calculate volume profile
            for (int i = startIndex; i <= index; i++)
            {
                double price = Math.Round(MarketSeries.Close[i] / rowHeight) * rowHeight;
                bool isUpBar = MarketSeries.Close[i] >= MarketSeries.Open[i];
                double volume = MarketSeries.TickVolume[i];

                if (!volumeProfile.ContainsKey(price))
                    volumeProfile[price] = new VolumeData();

                if (isUpBar)
                    volumeProfile[price].UpVolume += volume;
                else
                    volumeProfile[price].DownVolume += volume;
            }

            double maxVolume = volumeProfile.Values.Max(v => v.UpVolume + v.DownVolume);
            DateTime lastBarTime = MarketSeries.OpenTime[Chart.LastVisibleBarIndex];

            // Draw volume profile with zoom-adjusted positioning
            foreach (var kvp in volumeProfile.OrderByDescending(x => x.Key))
            {
                double price = kvp.Key;
                var data = kvp.Value;

                double totalVolRatio = (data.UpVolume + data.DownVolume) / maxVolume;
                double upRatio = data.UpVolume / (data.UpVolume + data.DownVolume);
                double downRatio = 1 - upRatio;

                double totalWidth = 10 * totalVolRatio;
                double upWidth = totalWidth * upRatio;
                double downWidth = totalWidth * downRatio;

                DateTime endTime = lastBarTime.AddMinutes(20);

                // Draw up volume
                if (data.UpVolume > 0)
                {
                    var rect = Chart.DrawRectangle(
                        $"VP_Up_{price}",
                        endTime.AddMinutes(-upWidth),
                        price,
                        endTime,
                        price + rowHeight,
                        upColor);
                    rect.IsFilled = true;

                    var border = Chart.DrawRectangle(
                        $"VP_Up_Border_{price}",
                        endTime.AddMinutes(-upWidth),
                        price,
                        endTime,
                        price + rowHeight,
                        borderColor);
                    border.IsFilled = false;
                    border.Thickness = 1;
                }

                // Draw down volume
                if (data.DownVolume > 0)
                {
                    var rect = Chart.DrawRectangle(
                        $"VP_Down_{price}",
                        endTime.AddMinutes(-(upWidth + downWidth)),
                        price,
                        endTime.AddMinutes(-upWidth),
                        price + rowHeight,
                        downColor);
                    rect.IsFilled = true;

                    var border = Chart.DrawRectangle(
                        $"VP_Down_Border_{price}",
                        endTime.AddMinutes(-(upWidth + downWidth)),
                        price,
                        endTime.AddMinutes(-upWidth),
                        price + rowHeight,
                        borderColor);
                    border.IsFilled = false;
                    border.Thickness = 1;
                }
            }
        }

        private class VolumeData
        {
            public double UpVolume { get; set; }
            public double DownVolume { get; set; }
        }
    }
}
@EDG777
firemyst
01 Dec 2024, 14:30 ( Updated at: 02 Dec 2024, 06:51 )
On every bar, try redrawing the indicator at the “LastVisibleBarIndex”.
Documented here:
https://help.ctrader.com/ctrader-algo/references/Chart/Chart/#lastvisiblebarindex
@firemyst