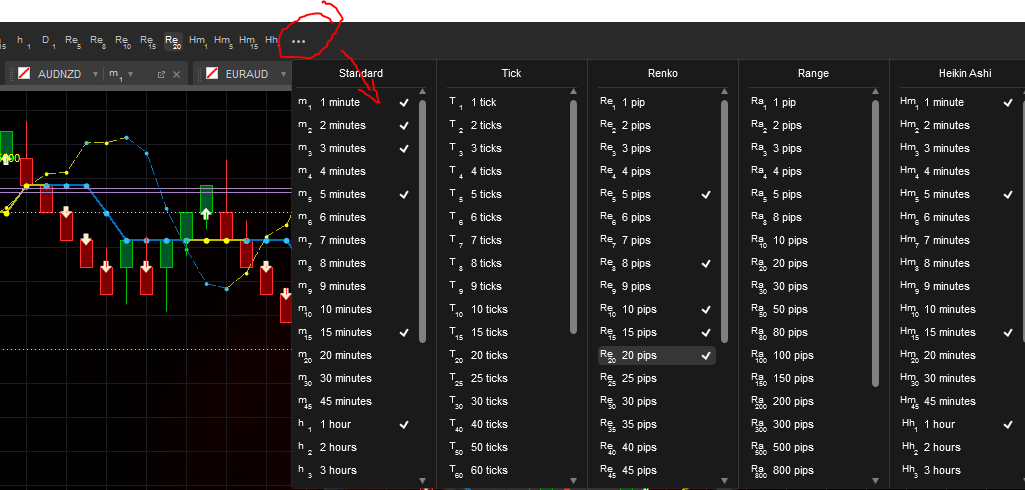
Values for Tick Charts
27 May 2023, 16:28
Where I can fit the values for Tick Charting manually?
Example: I want have a value of 70 in Tick Chart. But where?
Replies
juergen.kral
28 May 2023, 10:38
( Updated at: 21 Dec 2023, 09:23 )
RE:
firemyst said:
You have to take what's given. If a time value isn't available, you can't manually add it in as far as I'm aware:
If you want other time frames, you'd have to write Spotware for the suggestion to include it.
Thanks for your reply - but in every other program I have the possibility to set my own values. That is quite easy to code.
@juergen.kral
juergen.kral
28 May 2023, 21:52
RE:
firemyst said:
Well, I do agree with you about it being somewhat easy to code.
You'll have to speak to Spotware about it. Or offer your coding services for them :-)
But in the interim, perhaps post it to the "Suggestions" forum:
aha.....thanks a lot for the tip!
@juergen.kral


firemyst
27 May 2023, 18:02
You have to take what's given. If a time value isn't available, you can't manually add it in as far as I'm aware:
If you want other time frames, you'd have to write Spotware for the suggestion to include it.
@firemyst