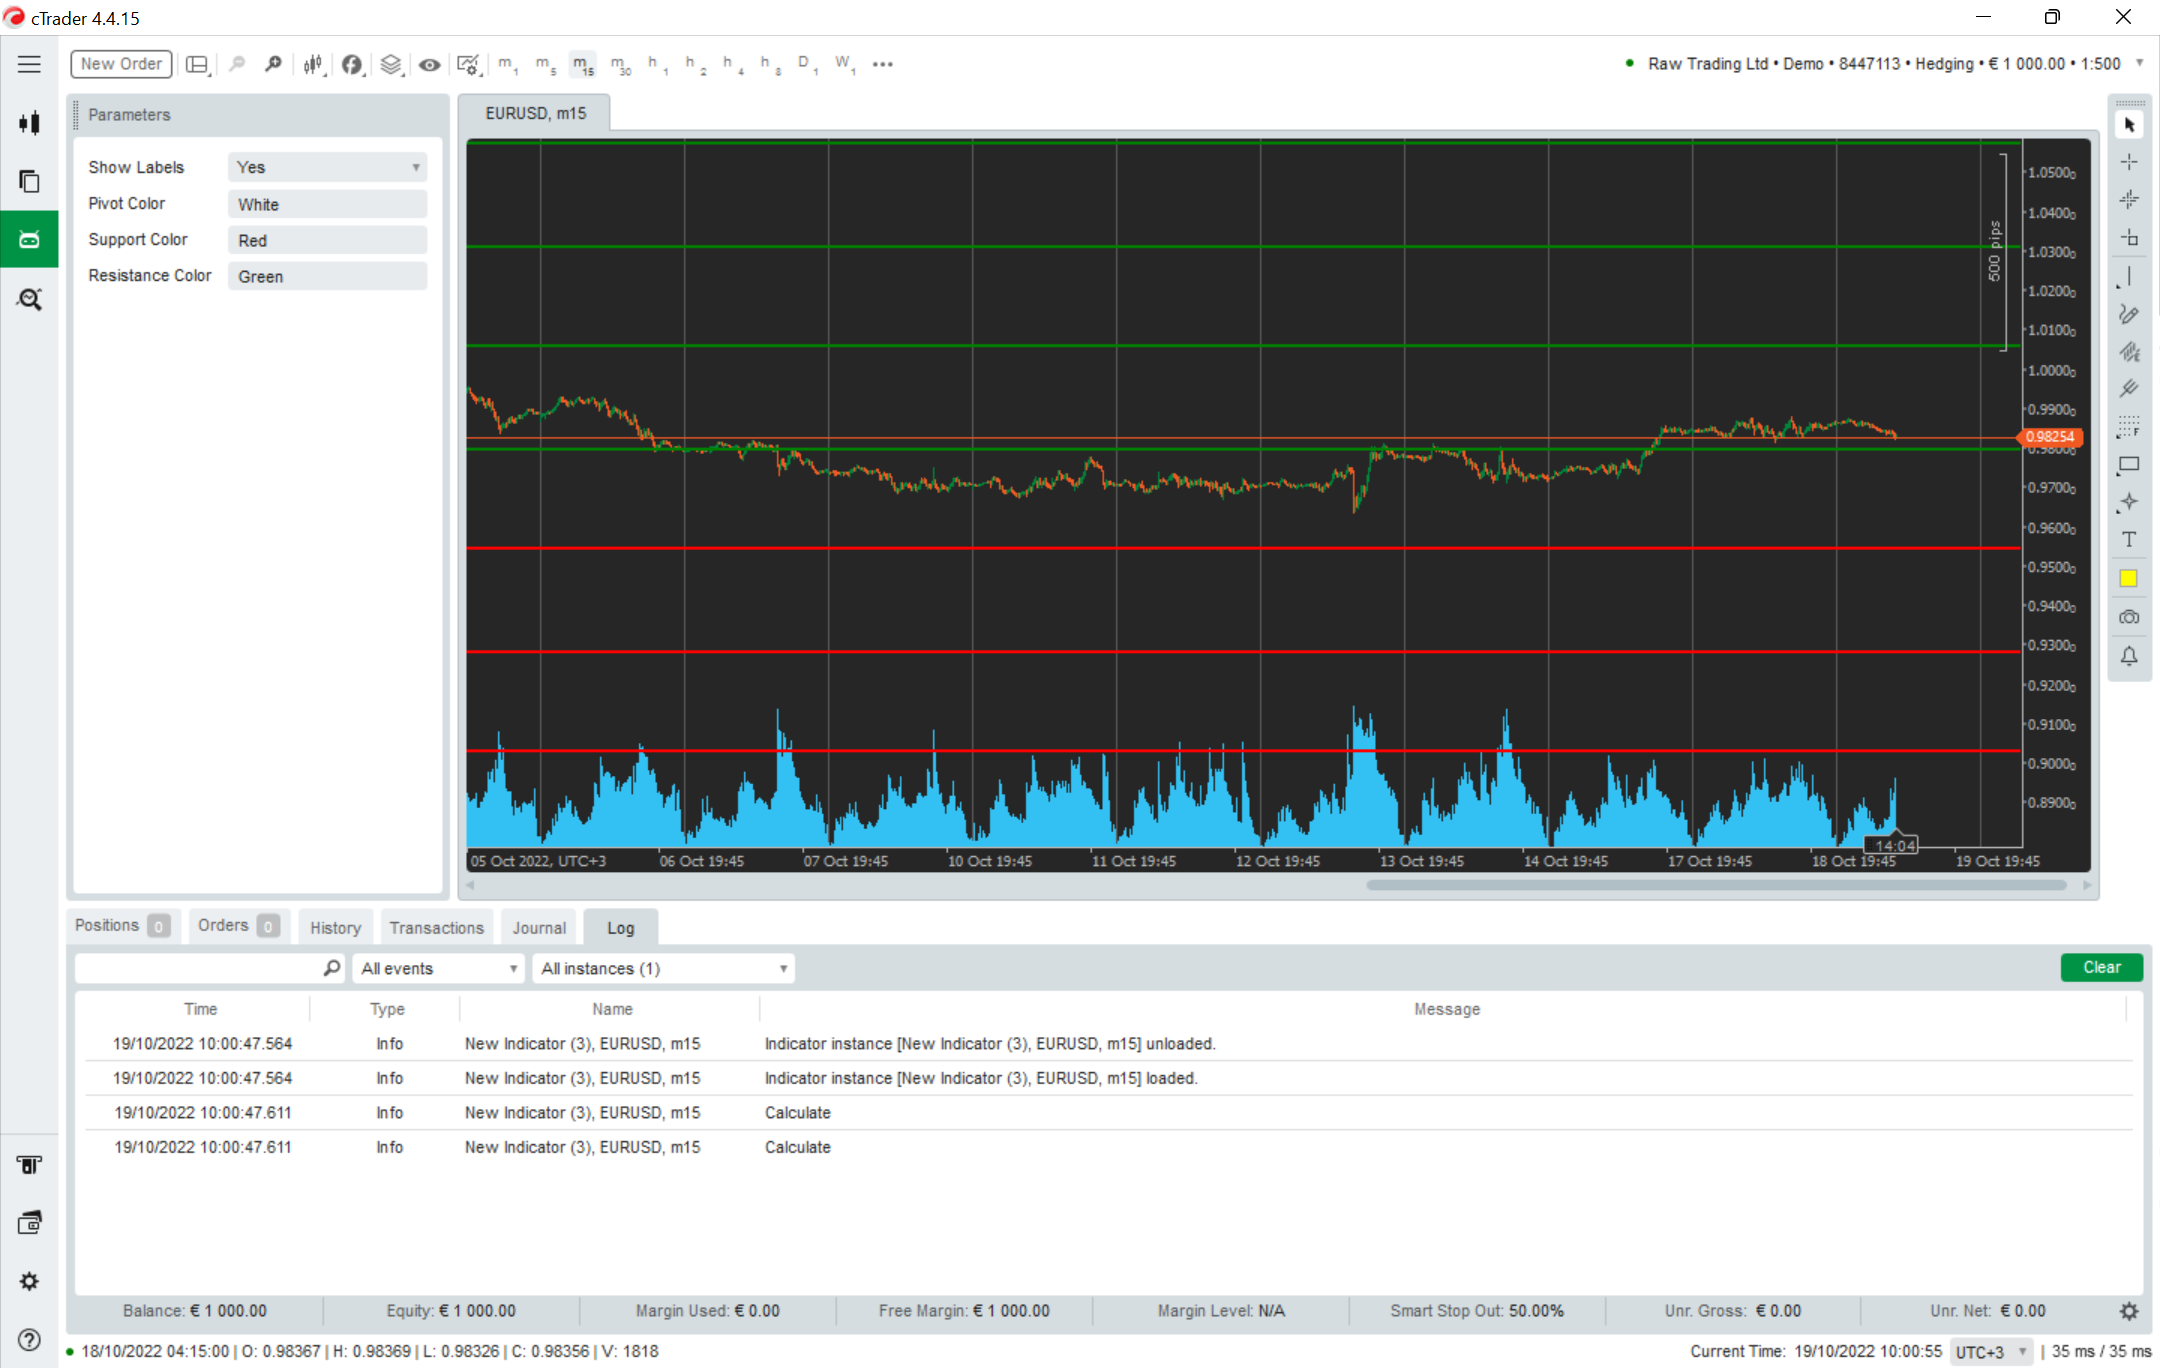
Monthly Pivot Points not showing in 1 mins, 5 mins and 15 mins Timeframes
Monthly Pivot Points not showing in 1 mins, 5 mins and 15 mins Timeframes
19 Oct 2022, 01:25
Hello,
I'm trying to edit this code I found for free, but I'm unable to do the following: I want the Monthly pivot Points to show whenever I'm in the 15 mins, 5 mins and 1 mins timeframes.
I was able to make them appear in the Hourly timeframes by changing the code from this:
if (TimeFrame <= TimeFrame.Hour)
PivotTimeFrame = TimeFrame.Daily;
else if (TimeFrame < TimeFrame.Daily)
{
PivotTimeFrame = TimeFrame.Weekly;
}
else
PivotTimeFrame = TimeFrame.Monthly;
Changing it to this:
/* if (TimeFrame < TimeFrame.Hour4)
PivotTimeFrame = TimeFrame.Daily;
if (TimeFrame <= TimeFrame.Hour)
PivotTimeFrame = TimeFrame.Weekly;
else if (TimeFrame < TimeFrame.Daily)
{
PivotTimeFrame = TimeFrame.Monthly;
}
else */
PivotTimeFrame = TimeFrame.Monthly;
And it works when I'm in the Hourly timeframes. But that's it, it doesn't show up when I'm in the Timeframes that are in minutes.
Thanks in advance for your time!
Replies
PanagiotisChar
19 Oct 2022, 10:01
Hi there,
I tried this and it works fine. You just need to scroll back the chart so that enough data is loaded for the pivot points to be calculated

Need help? Join us on Telegram
Need premium support? Trade with us
@PanagiotisChar
717616
19 Oct 2022, 21:19
( Updated at: 21 Dec 2023, 09:22 )
RE:
PanagiotisChar said:
Hi there,
I tried this and it works fine. You just need to scroll back the chart so that enough data is loaded for the pivot points to be calculated
Need help? Join us on Telegram
Need premium support? Trade with us
Hello,
Yes, you're right. After scrolling back and forth, they now appear! I just need a more powerful computer LOL :')
@717616


717616
19 Oct 2022, 01:42
RE:
eddie.th616 said:
The whole code is this:
using System;
using cAlgo.API;
using cAlgo.API.Internals;
using cAlgo.API.Indicators;
namespace cAlgo.Indicators
{
[Indicator(IsOverlay = true, TimeZone = TimeZones.EasternStandardTime, AccessRights = AccessRights.None)]
public class PivotPoints : Indicator
{
private DateTime _previousPeriodStartTime;
private int _previousPeriodStartIndex;
private TimeFrame PivotTimeFrame;
Color pivotColor = Color.White;
Color supportColor = Color.Red;
Color resistanceColor = Color.Green;
[Parameter("Show Labels", DefaultValue = true)]
public bool ShowLabels { get; set; }
[Parameter("Pivot Color", DefaultValue = "White")]
public string PivotColor { get; set; }
[Parameter("Support Color", DefaultValue = "Red")]
public string SupportColor { get; set; }
[Parameter("Resistance Color", DefaultValue = "Green")]
public string ResistanceColor { get; set; }
protected override void Initialize()
{
/* if (TimeFrame < TimeFrame.Hour4)
PivotTimeFrame = TimeFrame.Daily;
if (TimeFrame <= TimeFrame.Hour)
PivotTimeFrame = TimeFrame.Weekly;
else if (TimeFrame < TimeFrame.Daily)
{
PivotTimeFrame = TimeFrame.Monthly;
}
else */
PivotTimeFrame = TimeFrame.Monthly;
pivotColor = Color.FromName(PivotColor);
supportColor = Color.FromName(SupportColor);
resistanceColor = Color.FromName(ResistanceColor);
}
private DateTime GetStartOfPeriod(TimeFrame tf, DateTime dateTime)
{
return CutToOpenByNewYork(tf, dateTime, PivotTimeFrame);
}
private DateTime GetEndOfPeriod(DateTime dateTime)
{
if (TimeFrame == TimeFrame.Weekly)
{
return new DateTime(dateTime.Year, 1, 1).AddYears(1);
}
if (PivotTimeFrame == TimeFrame.Monthly)
{
return new DateTime(dateTime.Year, dateTime.Month, 1).AddMonths(1);
}
if (PivotTimeFrame == TimeFrame.Weekly)
{
int diff = (7 + (dateTime.DayOfWeek - DayOfWeek.Sunday)) % 7;
return dateTime.AddDays(-1 * diff).Date;
}
return AddPeriod(CutToOpenByNewYork(TimeFrame, dateTime, PivotTimeFrame), PivotTimeFrame);
}
public override void Calculate(int index)
{
if (TimeFrame == TimeFrame.Monthly)
return;
var currentPeriodStartTime = GetStartOfPeriod(TimeFrame, Bars.OpenTimes[index]);
if (currentPeriodStartTime == _previousPeriodStartTime)
return;
if (index > 0)
CalculatePivots(_previousPeriodStartTime, _previousPeriodStartIndex, currentPeriodStartTime, index);
_previousPeriodStartTime = currentPeriodStartTime;
_previousPeriodStartIndex = index;
}
private void CalculatePivots(DateTime startTime, int startIndex, DateTime startTimeOfNextPeriod, int index)
{
var high = Bars.HighPrices[startIndex];
var low = Bars.LowPrices[startIndex];
var close = Bars.ClosePrices[startIndex];
var i = startIndex + 1;
while (GetStartOfPeriod(TimeFrame, Bars.OpenTimes[i]) == startTime && i < Bars.ClosePrices.Count)
{
high = Math.Max(high, Bars.HighPrices[i]);
low = Math.Min(low, Bars.LowPrices[i]);
close = Bars.ClosePrices[i];
i++;
}
var pivotStartTime = startTimeOfNextPeriod;
var pivotEndTime = GetEndOfPeriod(startTimeOfNextPeriod);
var pivot = (high + low + close) / 3;
var r1 = 2 * pivot - low;
var s1 = 2 * pivot - high;
var r2 = pivot + high - low;
var s2 = pivot - high + low;
var r3 = high + 2 * (pivot - low);
var s3 = low - 2 * (high - pivot);
Chart.DrawTrendLine("pivot " + startIndex, pivotStartTime, pivot, pivotEndTime, pivot, resistanceColor, 2);
Chart.DrawTrendLine("r1 " + startIndex, pivotStartTime, r1, pivotEndTime, r1, resistanceColor, 2);
Chart.DrawTrendLine("r2 " + startIndex, pivotStartTime, r2, pivotEndTime, r2, resistanceColor, 2);
Chart.DrawTrendLine("r3 " + startIndex, pivotStartTime, r3, pivotEndTime, r3, resistanceColor, 2);
Chart.DrawTrendLine("s1 " + startIndex, pivotStartTime, s1, pivotEndTime, s1, supportColor, 2);
Chart.DrawTrendLine("s2 " + startIndex, pivotStartTime, s2, pivotEndTime, s2, supportColor, 2);
Chart.DrawTrendLine("s3 " + startIndex, pivotStartTime, s3, pivotEndTime, s3, supportColor, 2);
if (!ShowLabels)
return;
var dr1 = (int)Math.Abs((pivot - r1) / Symbol.PipSize);
var dr2 = (int)Math.Abs((pivot - r2) / Symbol.PipSize);
var dr3 = (int)Math.Abs((pivot - r3) / Symbol.PipSize);
var ds1 = (int)Math.Abs((pivot - s1) / Symbol.PipSize);
var ds2 = (int)Math.Abs((pivot - s2) / Symbol.PipSize);
var ds3 = (int)Math.Abs((pivot - s3) / Symbol.PipSize);
Chart.DrawText("Lpivot " + startIndex, "P", index, pivot, pivotColor);
Chart.DrawText("Lr1 " + startIndex, string.Format("R1 ({0})", dr1), index, r1, resistanceColor);
Chart.DrawText("Lr2 " + startIndex, string.Format("R2 ({0})", dr2), index, r2, resistanceColor);
Chart.DrawText("Lr3 " + startIndex, string.Format("R3 ({0})", dr3), index, r3, resistanceColor);
Chart.DrawText("Ls1 " + startIndex, string.Format("S1 ({0})", ds1), index, s1, supportColor);
Chart.DrawText("Ls2 " + startIndex, string.Format("S2 ({0})", ds2), index, s2, supportColor);
Chart.DrawText("Ls3 " + startIndex, string.Format("S3 ({0})", ds3), index, s3, supportColor);
}
private static DateTime CutToOpenByNewYork(TimeFrame tf, DateTime date, TimeFrame timeFrame)
{
if (tf == TimeFrame.Weekly)
{
return new DateTime(date.Year, 1, 1, 0, 0, 0, DateTimeKind.Unspecified);
}
if (timeFrame == TimeFrame.Daily)
{
var hourShift = (date.Hour + 24 - 17) % 24;
return new DateTime(date.Year, date.Month, date.Day, date.Hour, 0, 0, DateTimeKind.Unspecified).AddHours(-hourShift);
}
if (timeFrame == TimeFrame.Weekly)
return GetStartOfTheWeek(date);
if (timeFrame == TimeFrame.Monthly)
{
return new DateTime(date.Year, date.Month, 1, 0, 0, 0, DateTimeKind.Unspecified);
}
throw new ArgumentException(string.Format("Unknown timeframe: {0}", timeFrame), "timeFrame");
}
private static DateTime GetStartOfTheWeek(DateTime dateTime)
{
return dateTime.Date.AddDays((double)DayOfWeek.Sunday - (double)dateTime.Date.DayOfWeek).AddHours(-7);
}
public DateTime AddPeriod(DateTime dateTime, TimeFrame timeFrame)
{
if (timeFrame == TimeFrame.Daily)
{
return dateTime.AddDays(1);
}
if (timeFrame == TimeFrame.Weekly)
{
return dateTime.AddDays(7);
}
if (timeFrame == TimeFrame.Monthly)
return dateTime.AddMonths(1);
throw new ArgumentException(string.Format("Unknown timeframe: {0}", timeFrame), "timeFrame");
}
}
}
@717616