Trend line timeframe-dependent irregularities and faults

Trend line timeframe-dependent irregularities and faults
03 Mar 2021, 16:12
When drawing a trendline on a higher time frame, they move in relation to current price when dropping down to a lower time frame.
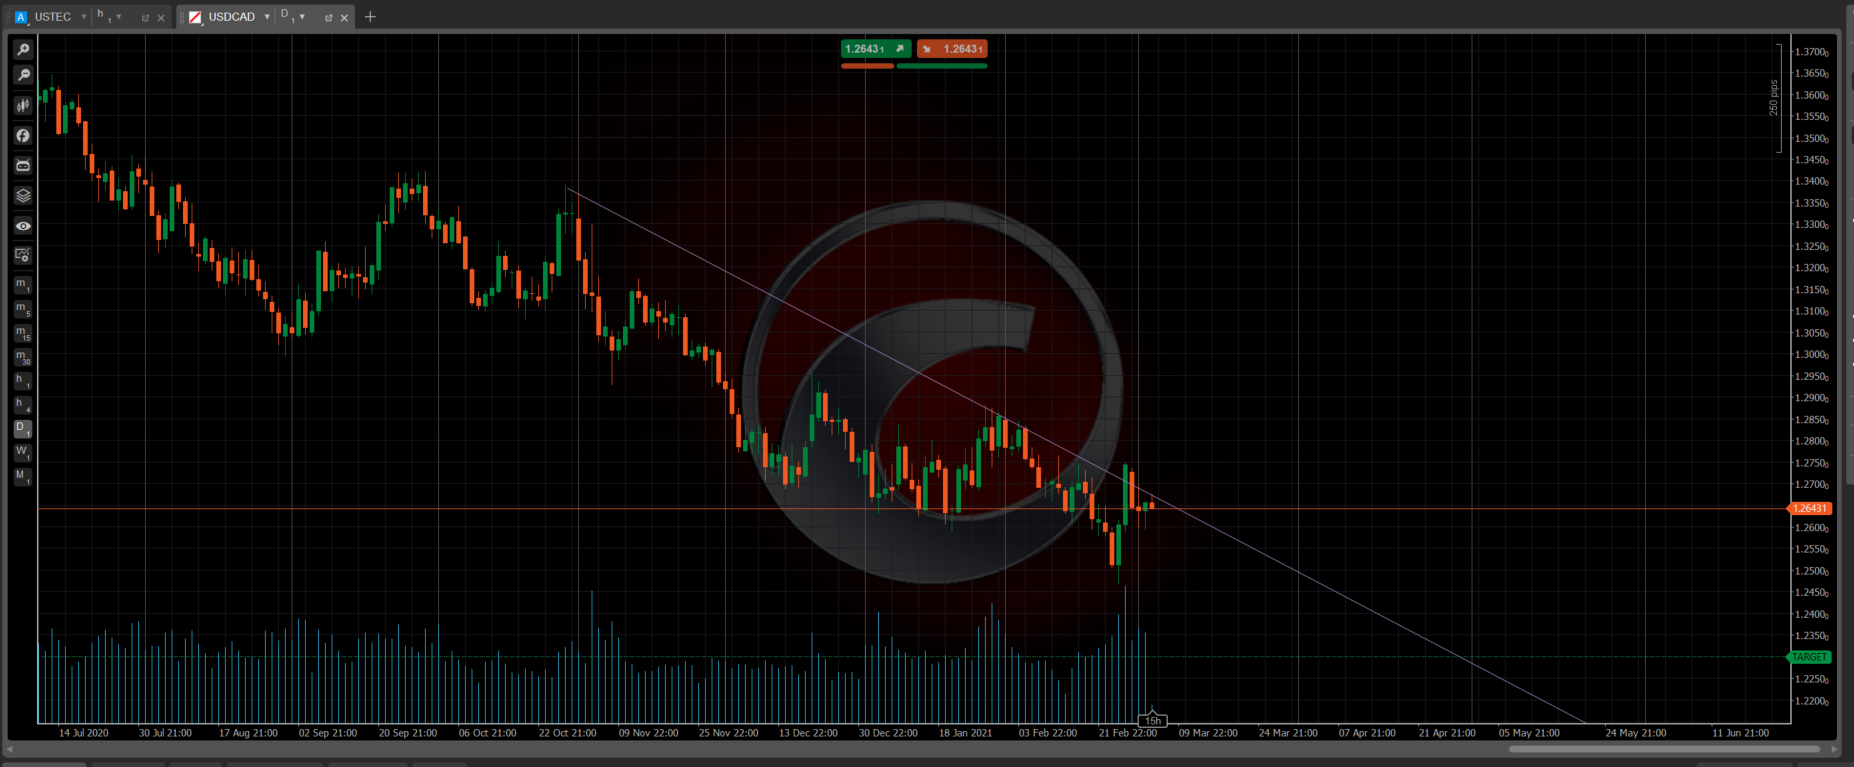
For example, I have a downward trendline drawn on the daily time frame on USDCAD. When I have the daily timeframe chart displayed and measure the trendline from current price, current price is 43 pips BELOW the trendline. When I drop down to an hourly chart however, current price is trading 23 pips ABOVE that exact same trendline. This makes it virtually impossible to know "where we are" in terms of the daily trendline when looking at a lower timeframe. Why is this happening?
Replies
intraflay
03 Mar 2021, 17:12
RE:
PanagiotisCharalampous said:
Hi intraflay,
Could you share some screenshots of what you are looking at? Make sure we can see the broker, symbol and timeframe.
Best Regards,
Panagiotis
Sure - have just taken two chart shots on the platform. Broker is IC Markets


@intraflay
intraflay
03 Mar 2021, 17:15
( Updated at: 21 Dec 2023, 09:22 )
RE: RE:
intraflay said:
PanagiotisCharalampous said:
Hi intraflay,
Could you share some screenshots of what you are looking at? Make sure we can see the broker, symbol and timeframe.
Best Regards,
Panagiotis
Sure - have just taken two chart shots on the platform. Broker is IC Markets

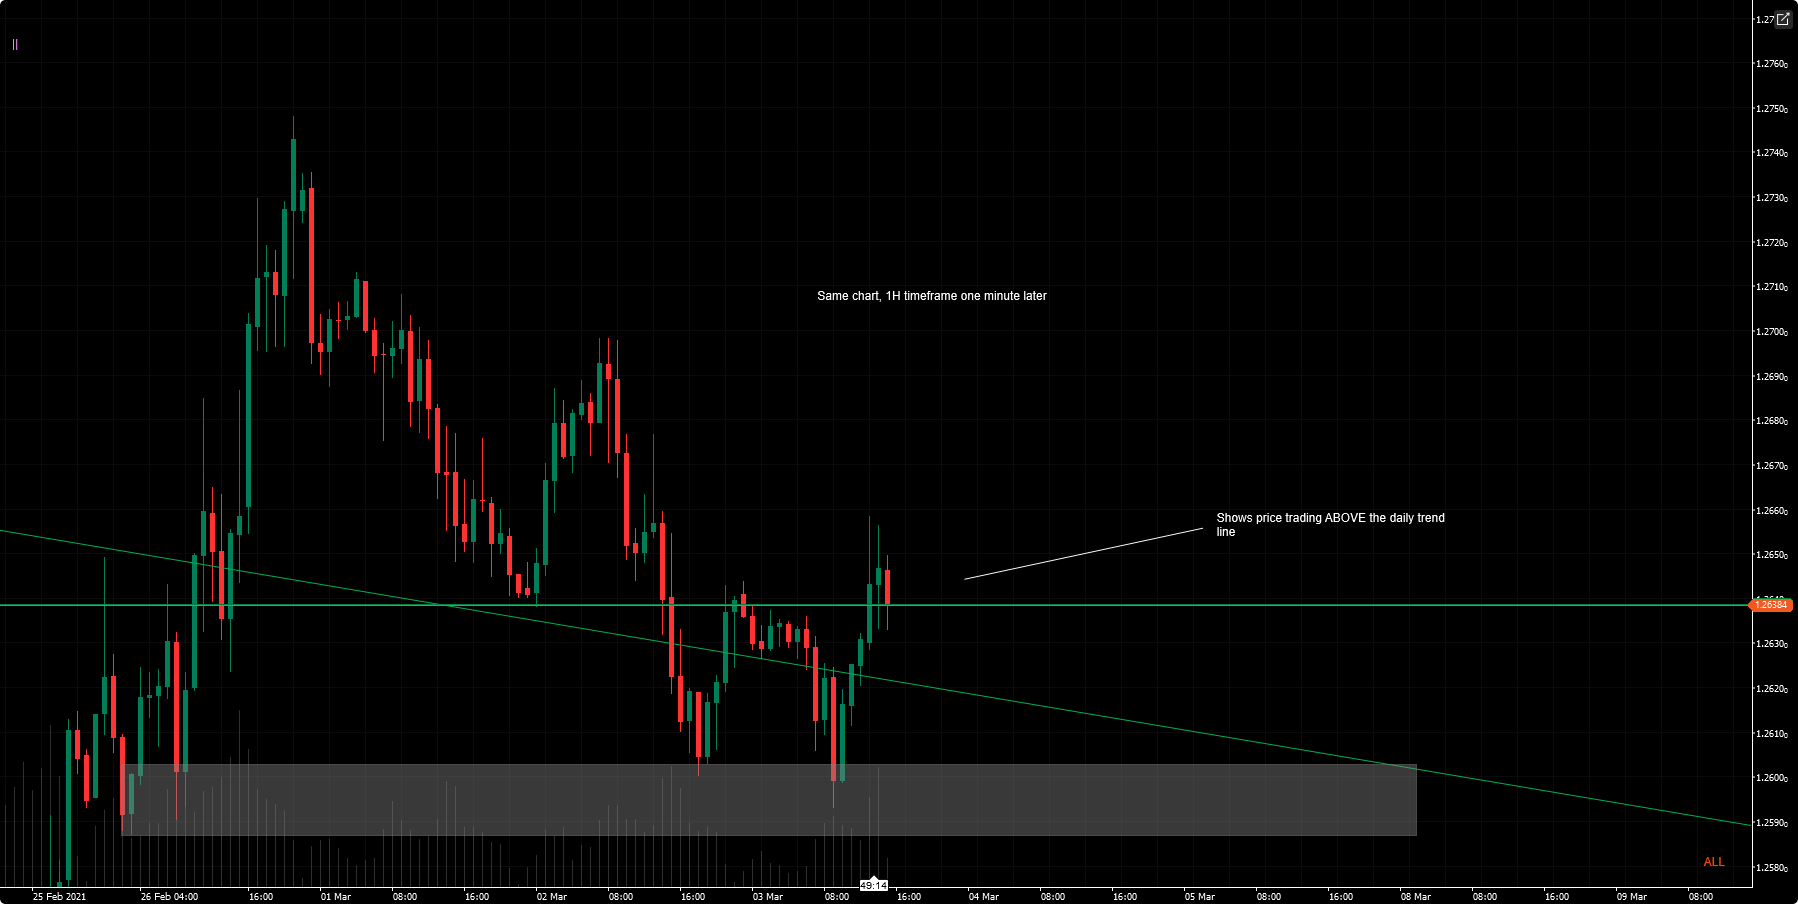
Oh and this is USDCAD as described in my first post... but FYI it does the same thing no matter what the symbol is.
@intraflay
PanagiotisCharalampous
04 Mar 2021, 08:24
Hi intraflay,
I tried this and looks fine to me

 Can you try scrolling back the chart so that all the h1 data is loaded? Let me know if this fixes the issue
Best Regards,
Panagiotis
@PanagiotisCharalampous
intraflay
04 Mar 2021, 14:05
( Updated at: 21 Dec 2023, 09:22 )
RE:
PanagiotisCharalampous said:
Hi intraflay,
I tried this and looks fine to me
Can you try scrolling back the chart so that all the h1 data is loaded? Let me know if this fixes the issue
Best Regards,
Panagiotis
Hi - thanks for looking into it. But unfortunately, no! I have scrolled back as far as 2014 on the hourly and still, it does the same thing. Have opened a new chart and tried from fresh but still, same problem. Also tried it on 2 other pairs and have the same issue. I have also drawn the same trend line in terms of length etc, but on the hourly chart.. and then when I switch to the daily timeframe, that same trend line is way above the price points which I had drawn it based upon.
@intraflay
PanagiotisCharalampous
04 Mar 2021, 14:51
Hi intraflay,
Can you please post a full screenshot of the cTrader window? I need to see the complete information of your cTrader instance. Unfortunately this issue might happen, when there are data inconsistencies between the timeframes e.g. bars missing, causing the bars to shifted left or right. There is not much we can do if this is the case
Best Regards,
Panagiotis
@PanagiotisCharalampous
PanagiotisCharalampous
03 Mar 2021, 16:48
Hi intraflay,
Could you share some screenshots of what you are looking at? Make sure we can see the broker, symbol and timeframe.
Best Regards,
Panagiotis
Join us on Telegram
@PanagiotisCharalampous