Tick charts are "incorrect"

Tick charts are "incorrect"
20 Sep 2020, 19:59
I am gathering tick data information and have noticed this error (or what I feel should be classified as an error).
When plotting "10 Tick" charts, the bars are only considering ticks where the bid price changes. This means there could be more than 10 ticks inside a "10 Tick" bar if some bid prices are repeated.
Example:
This is an example "10 Tick" bar for EURNZD (broker, IC Markets, Live account)
open time close time open bid close bid
![]()
I have downloaded the single tick entries and reconciled it to have been formed from this set of ticks:
Tick time tick price
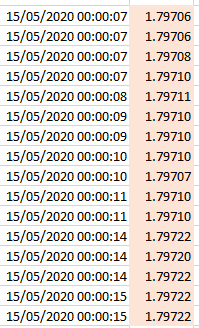
As you can see, there are more than "10 Ticks", but if you ignore the rows where the price does not change, then there are 10 ticks.
I have done this reconciliation for multiple "10 Tick" bars and they all exhibit this behaviour.
I believe this should be classified as an error since "10 Tick" should mean exactly that, not "10 Ticks of price change".
The price not changing under a new tick is just as useful to know as the price changing in a new tick.
I wanted to attached the csv files which contain the "10 Tick" and single tick data I extracted, but couldn't see a way to do that here. Please let me know how to take this further as I really need the accuracy of these "Tick n" charts are very important in the strategies I am considering.
Replies
trend_meanreversion
27 Sep 2020, 04:06
Hi mate,
I use tick charts extensively in my research and trading so possibly might be able to answer your questions (which I think you already know answers to).
1) Yes tick charts are based only on "Bid" price change, so only bid price change is considered as tick change. This is intended feature I suppose as possibly incorporating both bid and ask change to be considered as a tick might be computationally expensive and doesn't align with how ctrader/other platforms treat their charts ( even in simple timebased TimeFrames such as 5min, 30mins etc ). OHLC data on charts that you see corresponds to bid price so I am afraid it is just how tick is defined -> any change in bid price is defined as a valid tick.
2) Personally, I would have preferred change in "mid-price" as a valid tick definition but I suppose I can live with current definition as well. You can create own DataSeries within a cBot which only stores "N-tick" information whenever bid price changes or ask price changes and thus can work with your own definition of "Ticks".
Hope it helps. Happy Trading :)
-TRMR
@trend_meanreversion
hao.han
27 Sep 2020, 04:49
Thank you for the reply TRMR, greatly appreciated!
The aim of all this is to construct "information-Driven Bars" as discussed by Prado in his book Advances in Financial Machine Learning, where tracking tick moves is very important.
By any chance, have you looked into this in your research give you mention you have done extensive research into tick based analysis? Any tips/help if so? (not looking for the holy grail recipe or anything!)
@hao.han
trend_meanreversion
27 Sep 2020, 05:19
RE:
hao.han said:
Thank you for the reply TRMR, greatly appreciated!
The aim of all this is to construct "information-Driven Bars" as discussed by Prado in his book Advances in Financial Machine Learning, where tracking tick moves is very important.
By any chance, have you looked into this in your research give you mention you have done extensive research into tick based analysis? Any tips/help if so? (not looking for the holy grail recipe or anything!)
Hi Hao,
Glad that you are looking at tick charts for your research as I feel it is the most under rated analysis for retail traders. I do like Prado's work and do think that imbalance bars/analysis is quite useful. I have tried to look at it before and it did give me alpha in very short term but unfortunately, fast execution became a problem so gave up the idea.
But I do utilize other tick analysis and keep experimenting with it( things as simple as uptick / downtick ratio can be helpful ! ). In fact my recent twitter experiment uses tick analysis as one of the components [ https://ctrader.com/forum/ctrader-support/24402 ]
Happy Trading !
-TRMR
@trend_meanreversion
snowchilli
10 Oct 2020, 03:15
RE: "Bid" price change
trend_meanreversion said:
Hi mate,
I use tick charts extensively in my research and trading so possibly might be able to answer your questions (which I think you already know answers to).
1) Yes tick charts are based only on "Bid" price change, so only bid price change is considered as tick change. This is intended feature I suppose as possibly incorporating both bid and ask change to be considered as a tick might be computationally expensive and doesn't align with how ctrader/other platforms treat their charts ( even in simple timebased TimeFrames such as 5min, 30mins etc ). OHLC data on charts that you see corresponds to bid price so I am afraid it is just how tick is defined -> any change in bid price is defined as a valid tick.
2) Personally, I would have preferred change in "mid-price" as a valid tick definition but I suppose I can live with current definition as well. You can create own DataSeries within a cBot which only stores "N-tick" information whenever bid price changes or ask price changes and thus can work with your own definition of "Ticks".
Hope it helps. Happy Trading :)
-TRMR
@TRMR
1) by "Bid" price change, do you mean a bid price has changed due to a position being opened / closed?
otherwise, it would be sounding as if you are referring to what the "Market Depth" view offers, ie many ask and bid prices staggered by price live with each price point being augmented with aggregate volume (that the liquidity provider of the broker can show),
2) wouldn't you need the positions's volume as well to evaluate the "weight" of a tick?
A 50 lot position could be thought of as more telling where the money is headed than a 0.01 lot position.
@snowchilli
trend_meanreversion
12 Oct 2020, 05:28
RE: RE: "Bid" price change
snowchilli said:
trend_meanreversion said:
Hi mate,
I use tick charts extensively in my research and trading so possibly might be able to answer your questions (which I think you already know answers to).
1) Yes tick charts are based only on "Bid" price change, so only bid price change is considered as tick change. This is intended feature I suppose as possibly incorporating both bid and ask change to be considered as a tick might be computationally expensive and doesn't align with how ctrader/other platforms treat their charts ( even in simple timebased TimeFrames such as 5min, 30mins etc ). OHLC data on charts that you see corresponds to bid price so I am afraid it is just how tick is defined -> any change in bid price is defined as a valid tick.
2) Personally, I would have preferred change in "mid-price" as a valid tick definition but I suppose I can live with current definition as well. You can create own DataSeries within a cBot which only stores "N-tick" information whenever bid price changes or ask price changes and thus can work with your own definition of "Ticks".
Hope it helps. Happy Trading :)
-TRMR
@TRMR
1) by "Bid" price change, do you mean a bid price has changed due to a position being opened / closed?
otherwise, it would be sounding as if you are referring to what the "Market Depth" view offers, ie many ask and bid prices staggered by price live with each price point being augmented with aggregate volume (that the liquidity provider of the broker can show),2) wouldn't you need the positions's volume as well to evaluate the "weight" of a tick?
A 50 lot position could be thought of as more telling where the money is headed than a 0.01 lot position.
Hi mate,
1) by "Bid" price change, do you mean a bid price has changed due to a position being opened / closed?
otherwise, it would be sounding as if you are referring to what the "Market Depth" view offers, ie many ask and bid prices staggered by price live with each price point being augmented with aggregate volume (that the liquidity provider of the broker can show),
When I said "Bid" price change , it meant the best Bid price level change. If best bid level is changed, then only a tick is counted in cTrader. It doesn't provide any information about the position open or close. It is purely based on price change (which can be driven by anything executed buy/sell trade or no trade at all at times in underlying)
2) wouldn't you need the positions's volume as well to evaluate the "weight" of a tick?
Ideally yes but when you are dealing with CFDs , then you don't get the liberty to get underlying prices, ticks, trades data etc. So actual market makers on exchange ( read HFTs ) do analyze all the information about market microstructure for their market making / trading algorithms. But I have seen even tick data ( as per defined by cTrader platform ) also shows some alpha and can be used in advanced trading algorithms. ( Stand-alone tick analysis may or may not be helpful, but combining it with other sophistication could help..at least it did for me). Hope it helps !
@trend_meanreversion
jonfleon
05 Mar 2024, 08:20
Hi,
I'm new to CTrader and the reason I subscribed to CTrader platform is the ready-to-use built in tick chart. However, I'd found the same ‘issue’ as hao han did. Can it be solved? I wish to have ‘10 ticks is defined and programed as10 transactions that had taken place among traders regardless of volume, buy or sell’ Please shed some light. Thanks.
@jonfleon
PanagiotisCharalampous
05 Mar 2024, 13:32
RE: Tick charts are "incorrect"
jonfleon said:
Hi,
I'm new to CTrader and the reason I subscribed to CTrader platform is the ready-to-use built in tick chart. However, I'd found the same ‘issue’ as hao han did. Can it be solved? I wish to have ‘10 ticks is defined and programed as10 transactions that had taken place among traders regardless of volume, buy or sell’ Please shed some light. Thanks.
No it cannot. Bars are constructed by bid prices only
@PanagiotisCharalampous
hao.han
20 Sep 2020, 20:08 ( Updated at: 21 Dec 2023, 09:22 )
I attached a further example here, as my previous one might have been ambiguous in price alignment.
EURNZD (broker, IC Markets, Live account)
Single "Tick 10" bar:
This was reconciled to 12 "Tick 1" bars:
I believe this is because there were two instances where the price did not change - leaving 10 ticks where price changed to form the "Tick 10" bar.
@hao.han